Ali Al-Rady

Shri Subramanian

Will Potts
AI coding assistants are quickly becoming a core part of software engineering workflows, helping developers write, refactor, and review code faster. But without effective monitoring, it can be difficult to know whether these tools are performing reliably and proving useful to engineers. As organizations scale their use of tools like Claude Code, key questions emerge:
- Who’s using these tools, and how much?
- Are tools performing reliably?
- What’s the estimated cost and return on investment (ROI)?
To help teams answer these questions, we’re excited to introduce Claude Code Monitoring within Datadog’s AI Agents Console, available now in Preview. The AI Agents Console provides a unified view of your organization’s AI agents and coding assistants, extending the same observability you already rely on for your applications and infrastructure. By monitoring Claude Code with the AI Agents Console, you can track usage and adoption across your organization, analyze performance and reliability trends, and understand total, user, and model-level spend and ROI all in one place.
In this post, we’ll explore how the AI Agents Console enables you to evaluate Claude Code performance in your environment and ensure adoption remains efficient, reliable, and cost-effective.
Get a real-time overview of Claude Code activity
As AI coding assistants become integral to development workflows, platform and engineering leaders need immediate insight into Claude Code usage, spend, and performance. Once your organization enables telemetry for Claude Code, you can view real-time telemetry from Claude Code sessions in the AI Agents Console. The Summary tab provides a high-level snapshot of Claude Code usage and performance across your organization. Here, you can quickly see:
- Total spend and token usage across all users
- User activity trends over time
- Error rates and latency patterns to assess stability
- Git commits and PRs associated with Claude Code activity
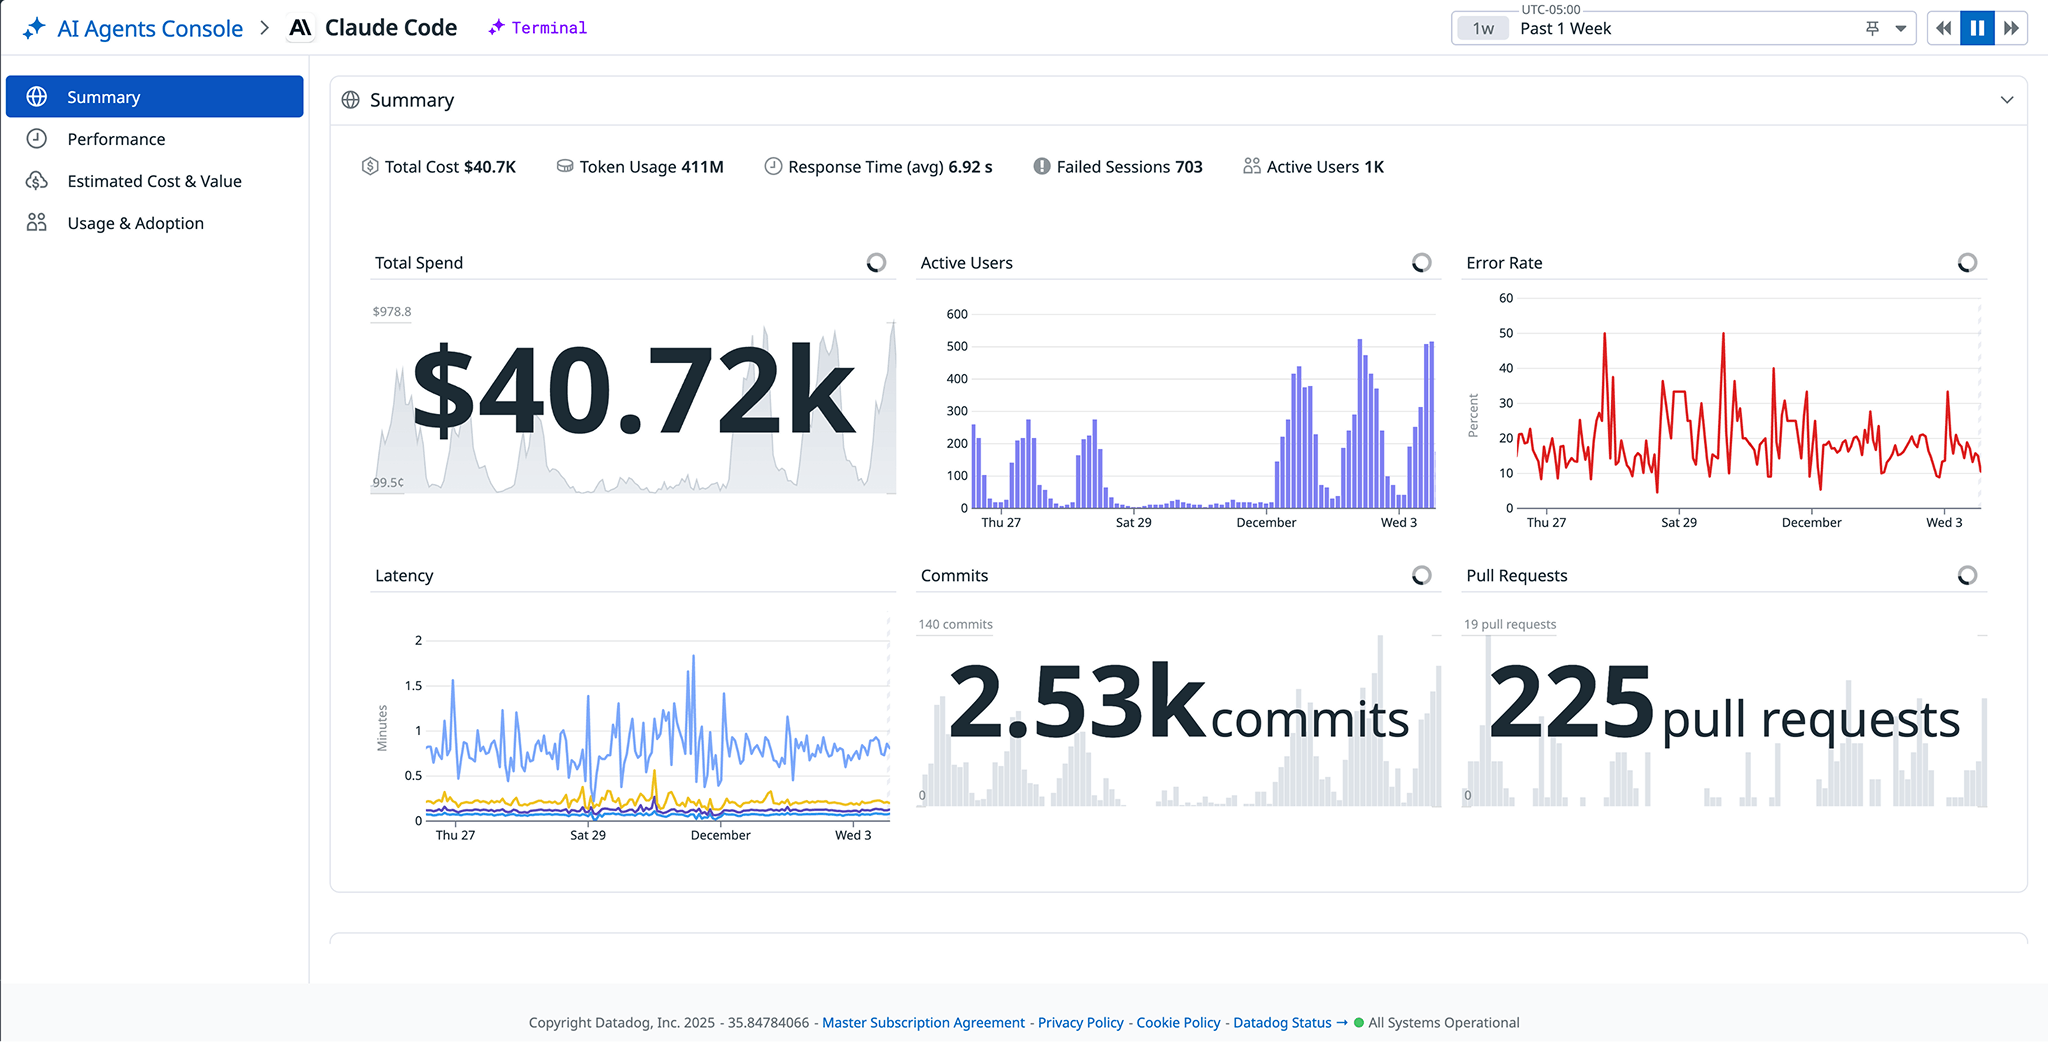
These metrics give platform and engineering leaders an instant understanding of adoption, stability, and cost in a unified view—you can use this view to spot anomalies at a glance for further investigation. For instance, you might identify elevated spend week-over-week without a correlated increase in user activity, indicating that new, expensive usage has occurred that you may need to audit.
Monitor Claude Code responsiveness and reliability
When AI coding assistants lag or return errors, developer productivity stalls. But identifying whether slow responses stem from model latency, network bottlenecks, misconfigurations, or rate limiting can be difficult without real-time visibility into agent performance metrics. The AI Agents Console aggregates key Claude Code performance metrics to surface latency percentiles, error rate trends, top failed bash commands, and success rates—and also surfaces requests by repository, giving you project-level insight into where issues are occurring and how different codebases are engaging with Claude Code.
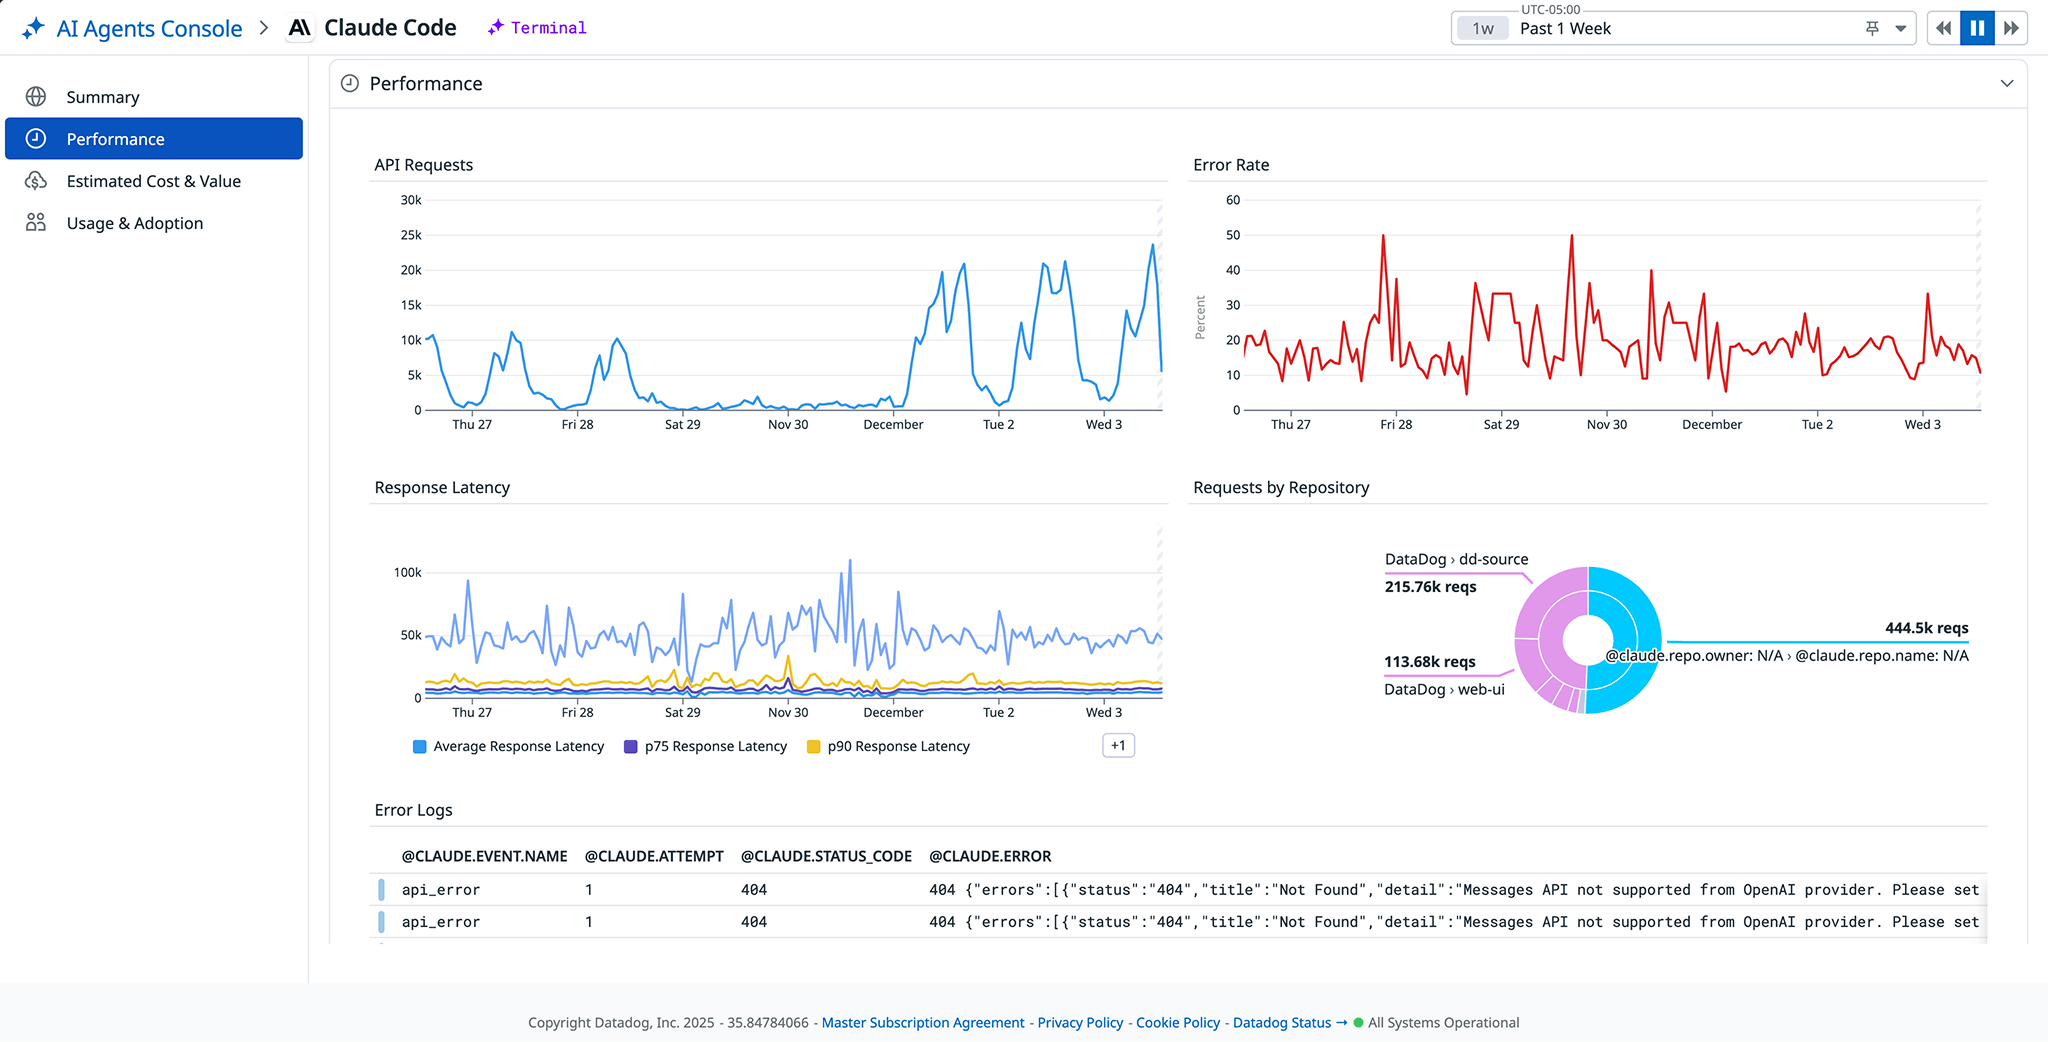
When you observe elevated error counts or latency from this view, you can immediately pivot to related logs for additional context and troubleshooting. Claude Code’s error logs can tell you more about the types of errors being thrown, helping you plan remediation. For example, the following screenshot shows a correlated 429 “Rate limit exceeded” error log. The user’s authentication and session metadata is included in this log so you can trace the issue further.
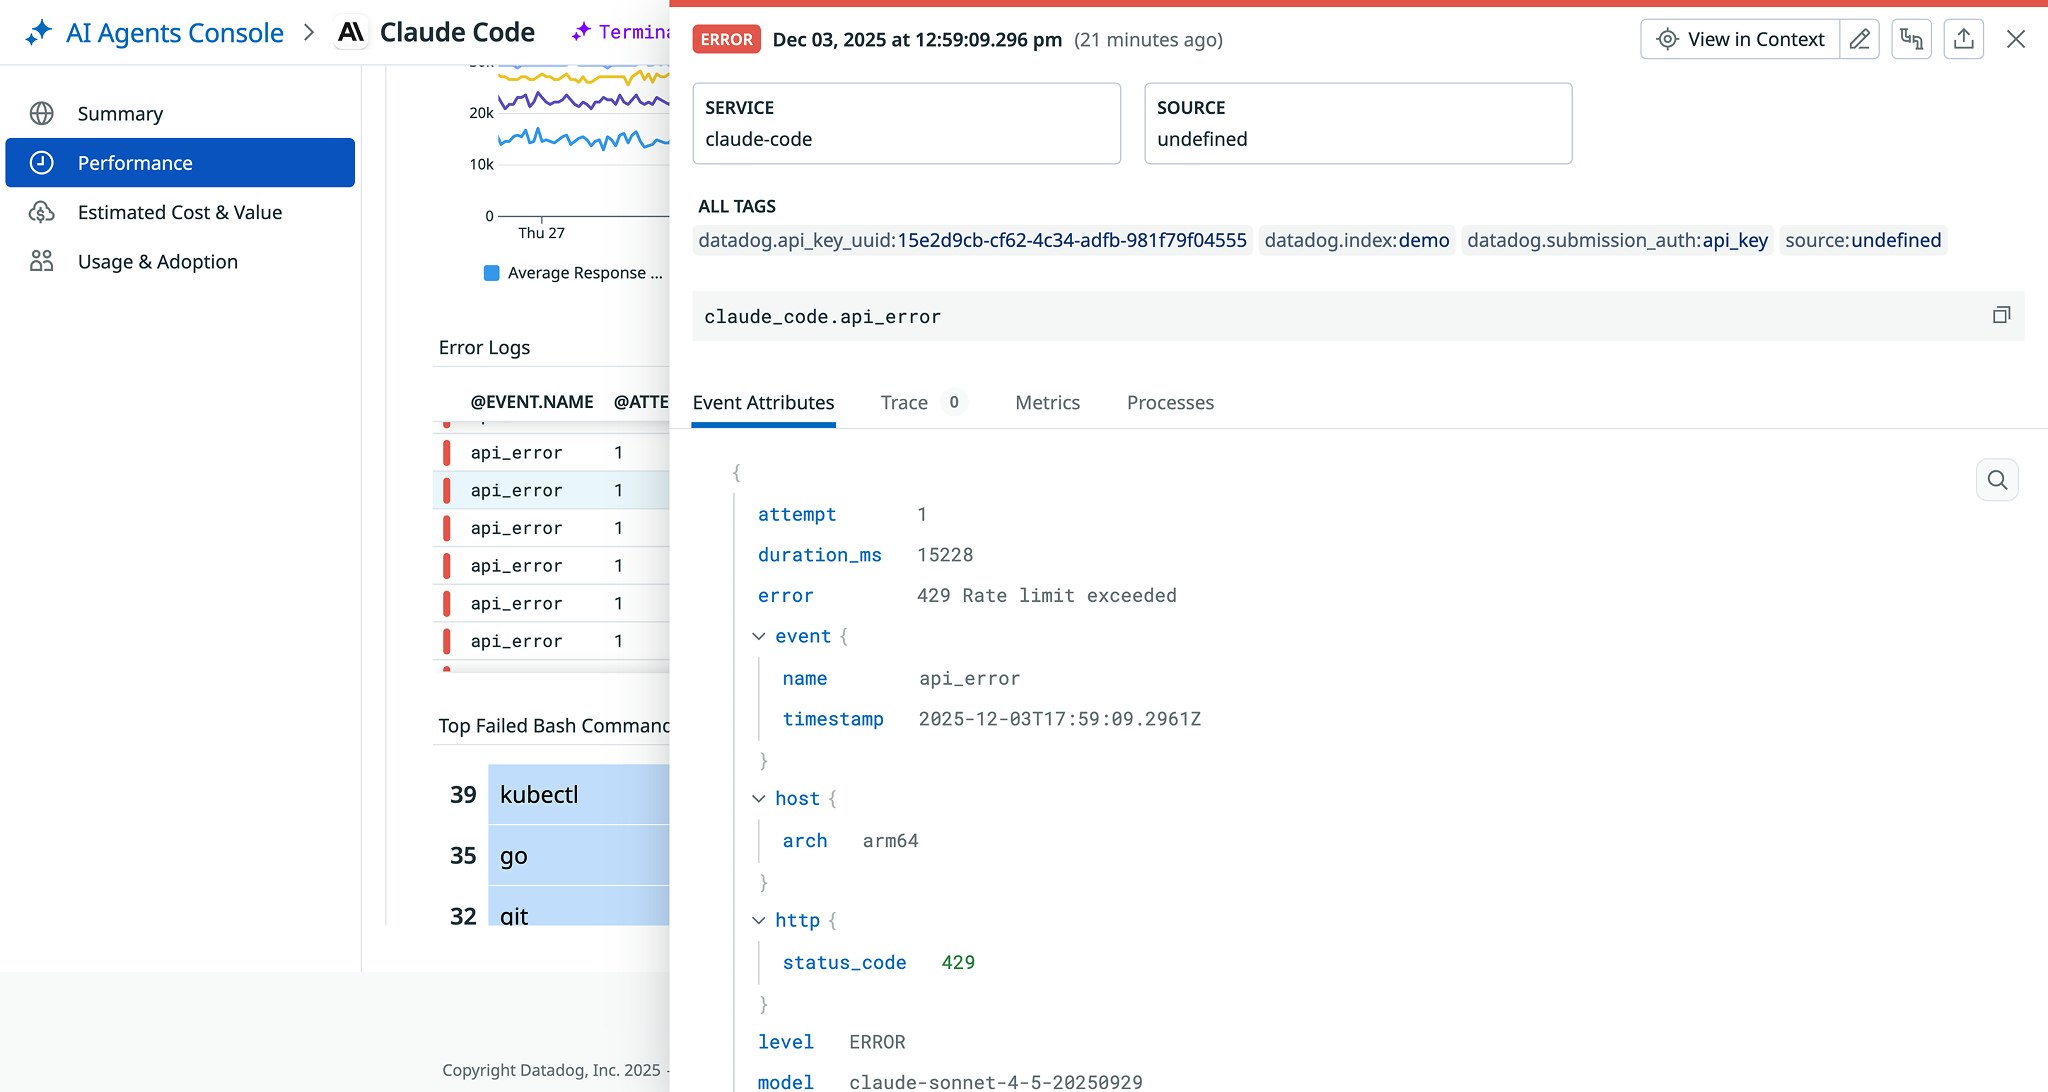
Track Claude Code spend and measure ROI
AI-assisted development introduces new cost dynamics. Without clear attribution of spend by user or model, it’s nearly impossible to understand where your budget is going—or how much value these tools actually deliver. Teams need transparent cost and usage data to evaluate ROI and guide responsible AI adoption. The AI Agents Console’s “Cost & Value” tab helps you measure Claude Code’s financial impact and optimize your usage. You can use this tab to view estimated total and per-user spend, model-specific cost trends (such as Sonnet vs. Opus vs. Haiku), and cumulative cost trends over time—all alongside performance metrics.

These insights make it easier to ensure AI adoption remains aligned with organizational budgets and priorities. For instance, your team might notice that usage of the Claude Code Opus model has grown three times faster than Haiku over the past month, even though most requests don’t require the higher-priced model. With this insight, you adjust the default configuration for routine code reviews to use Haiku, reserving Opus only for complex refactoring tasks. This reduces costs without affecting developer experience.
Understand how teams are engaging with Claude Code
Platform and engineering leaders need engagement data to ensure the consistent, effective use of coding assistants across their organizations. Without insight into usage trends, session durations, and code change activity, it’s hard to tell whether these assistants are truly improving development velocity or just sitting idle. The “Usage & Adoption” section highlights how Claude Code is being used day-to-day across your organization. You can track active users, sessions, and lines of code changed, along with commits and pull requests linked to Claude Code activity. The console also shows session duration, top users and common commands, and sessions by repository, helping you understand how developers are engaging across projects.
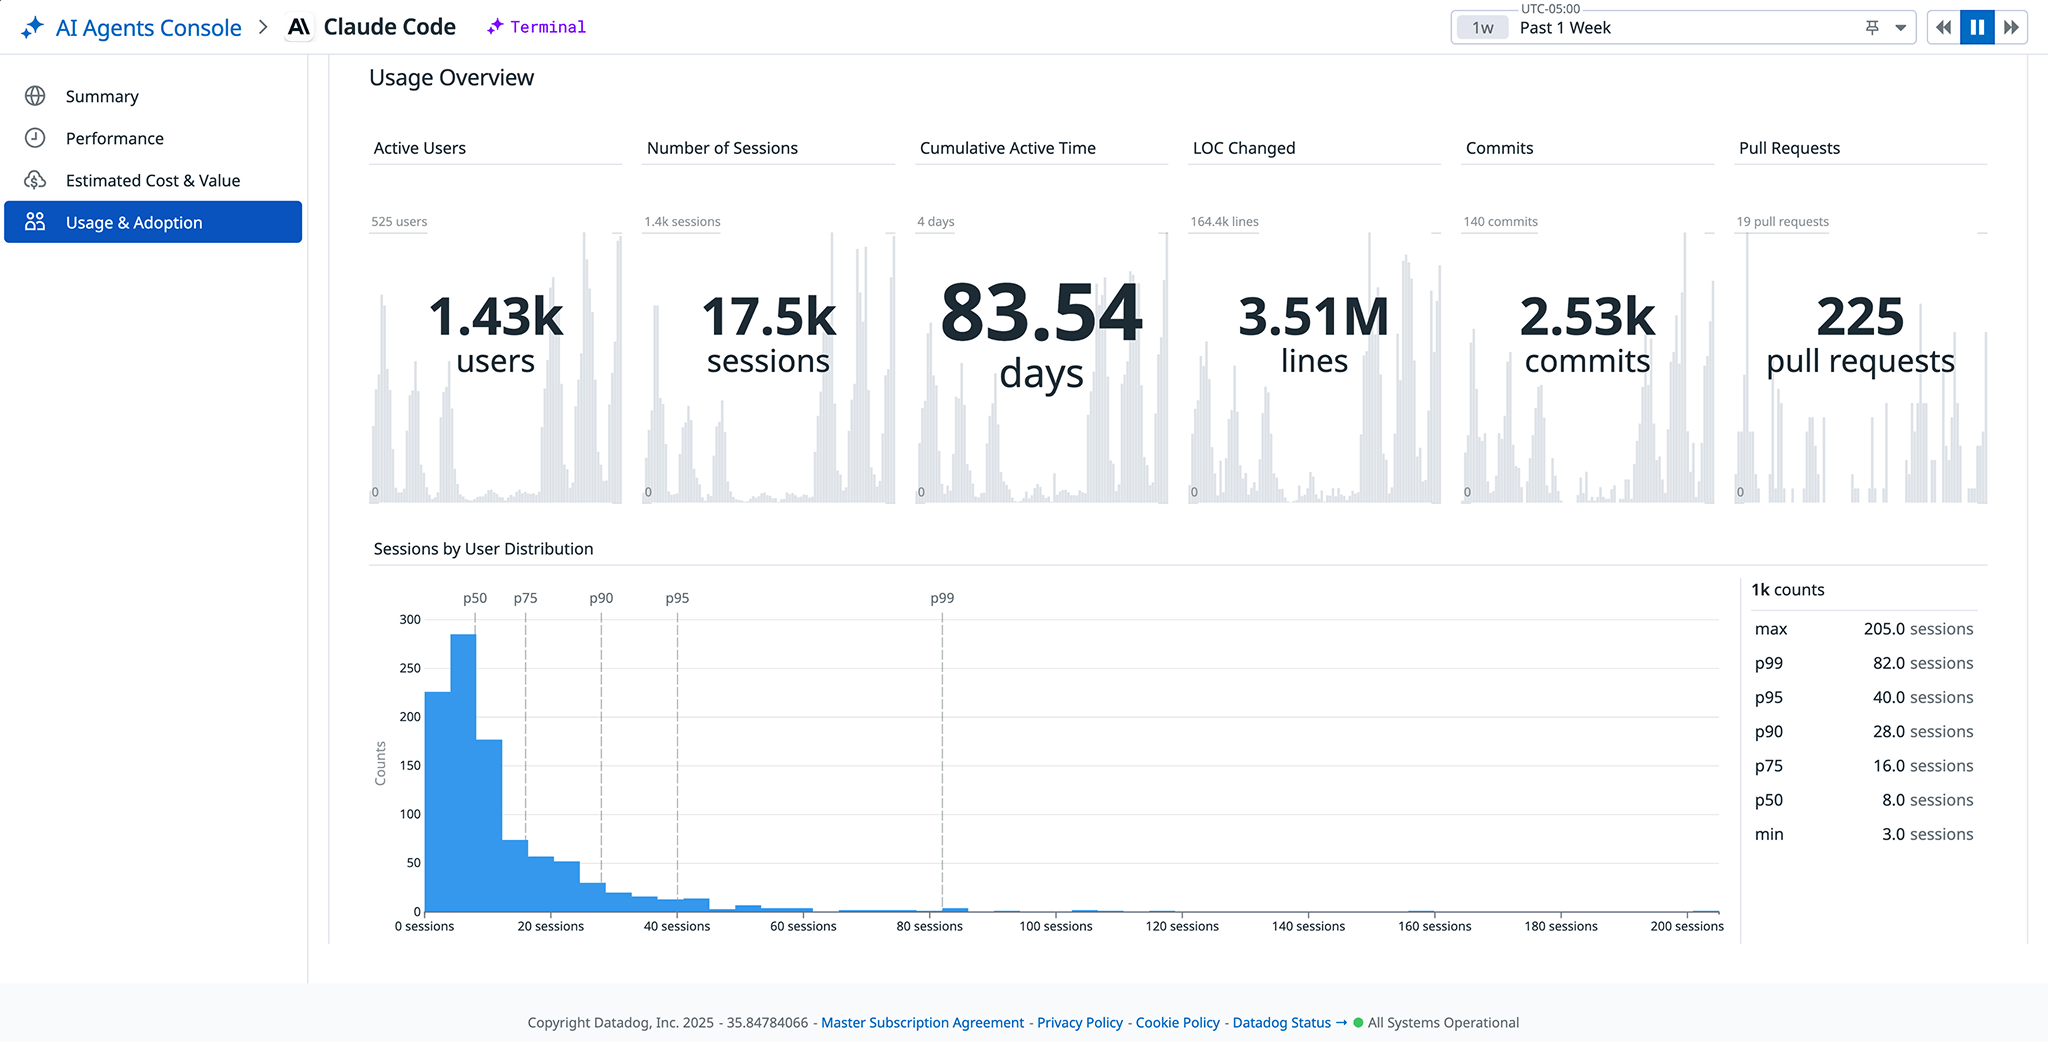
Additionally, the console surfaces client details—including the editors, CLIs, versions, and platforms where Claude Code is used—to give you a clearer picture of your organization’s AI coding landscape. This data helps teams evaluate productivity impact, identify opportunities for enablement, and ensure Claude Code is being used effectively across the development lifecycle.
For instance, let’s say you discover that most Claude Code sessions are initiated from VS Code extensions, but only a handful come from JetBrains IDEs. At the same time, repositories linked to mobile projects show almost no activity. By examining session metadata in the “Usage & Adoption” view, you identify that the JetBrains plugin is out of date and not configured for token authentication. This suggests that configuration issues were limiting adoption.
Get started with the Claude Code Monitoring Preview
AI coding assistants like Claude Code are transforming software development workflows, but teams often lack visibility into how these tools are used, how reliably they perform, and what they cost. Datadog Claude Code Monitoring addresses these challenges by surfacing real-time insights into adoption, performance, and spend, all within the AI Agents Console.
By providing a unified view of Claude Code activity, Datadog helps teams evaluate reliability, track ROI, and ensure AI adoption remains cost-effective and impactful. To get started, check out our Claude Code Monitoring documentation or sign up for the Preview.
If you don’t already have a Datadog account, you can sign up for a free trial.


