Grant Palmer

Aaron Kaplan
Azure SQL Managed Instance is a fully managed platform-as-a-service (PaaS) database engine. Among the variety of Azure SQL database services, SQL Managed Instance has become a popular option by enabling organizations to take a relatively hands-off approach. It offloads routine database management tasks—like upgrades, patches, backups, and basic monitoring—onto Microsoft, and it runs on the latest stable version of the SQL Server database engine on high-availability infrastructure in order to ensure 99.99 percent uptime. These features, together with its nearly comprehensive feature compatibility with SQL Server, make SQL Managed Instance particularly well-suited for users migrating from on-prem to cloud databases.
This post will explore how Datadog’s integration with SQL Managed Instance can help you gain deep visibility into your instances so you can proactively optimize your database usage and performance.
Gain full visibility into SQL Managed Instance
Once you’ve set up the integration, you’ll have access to a centralized overview of your SQL Managed Instance usage and performance via the out-of-the-box (OOTB) dashboard.
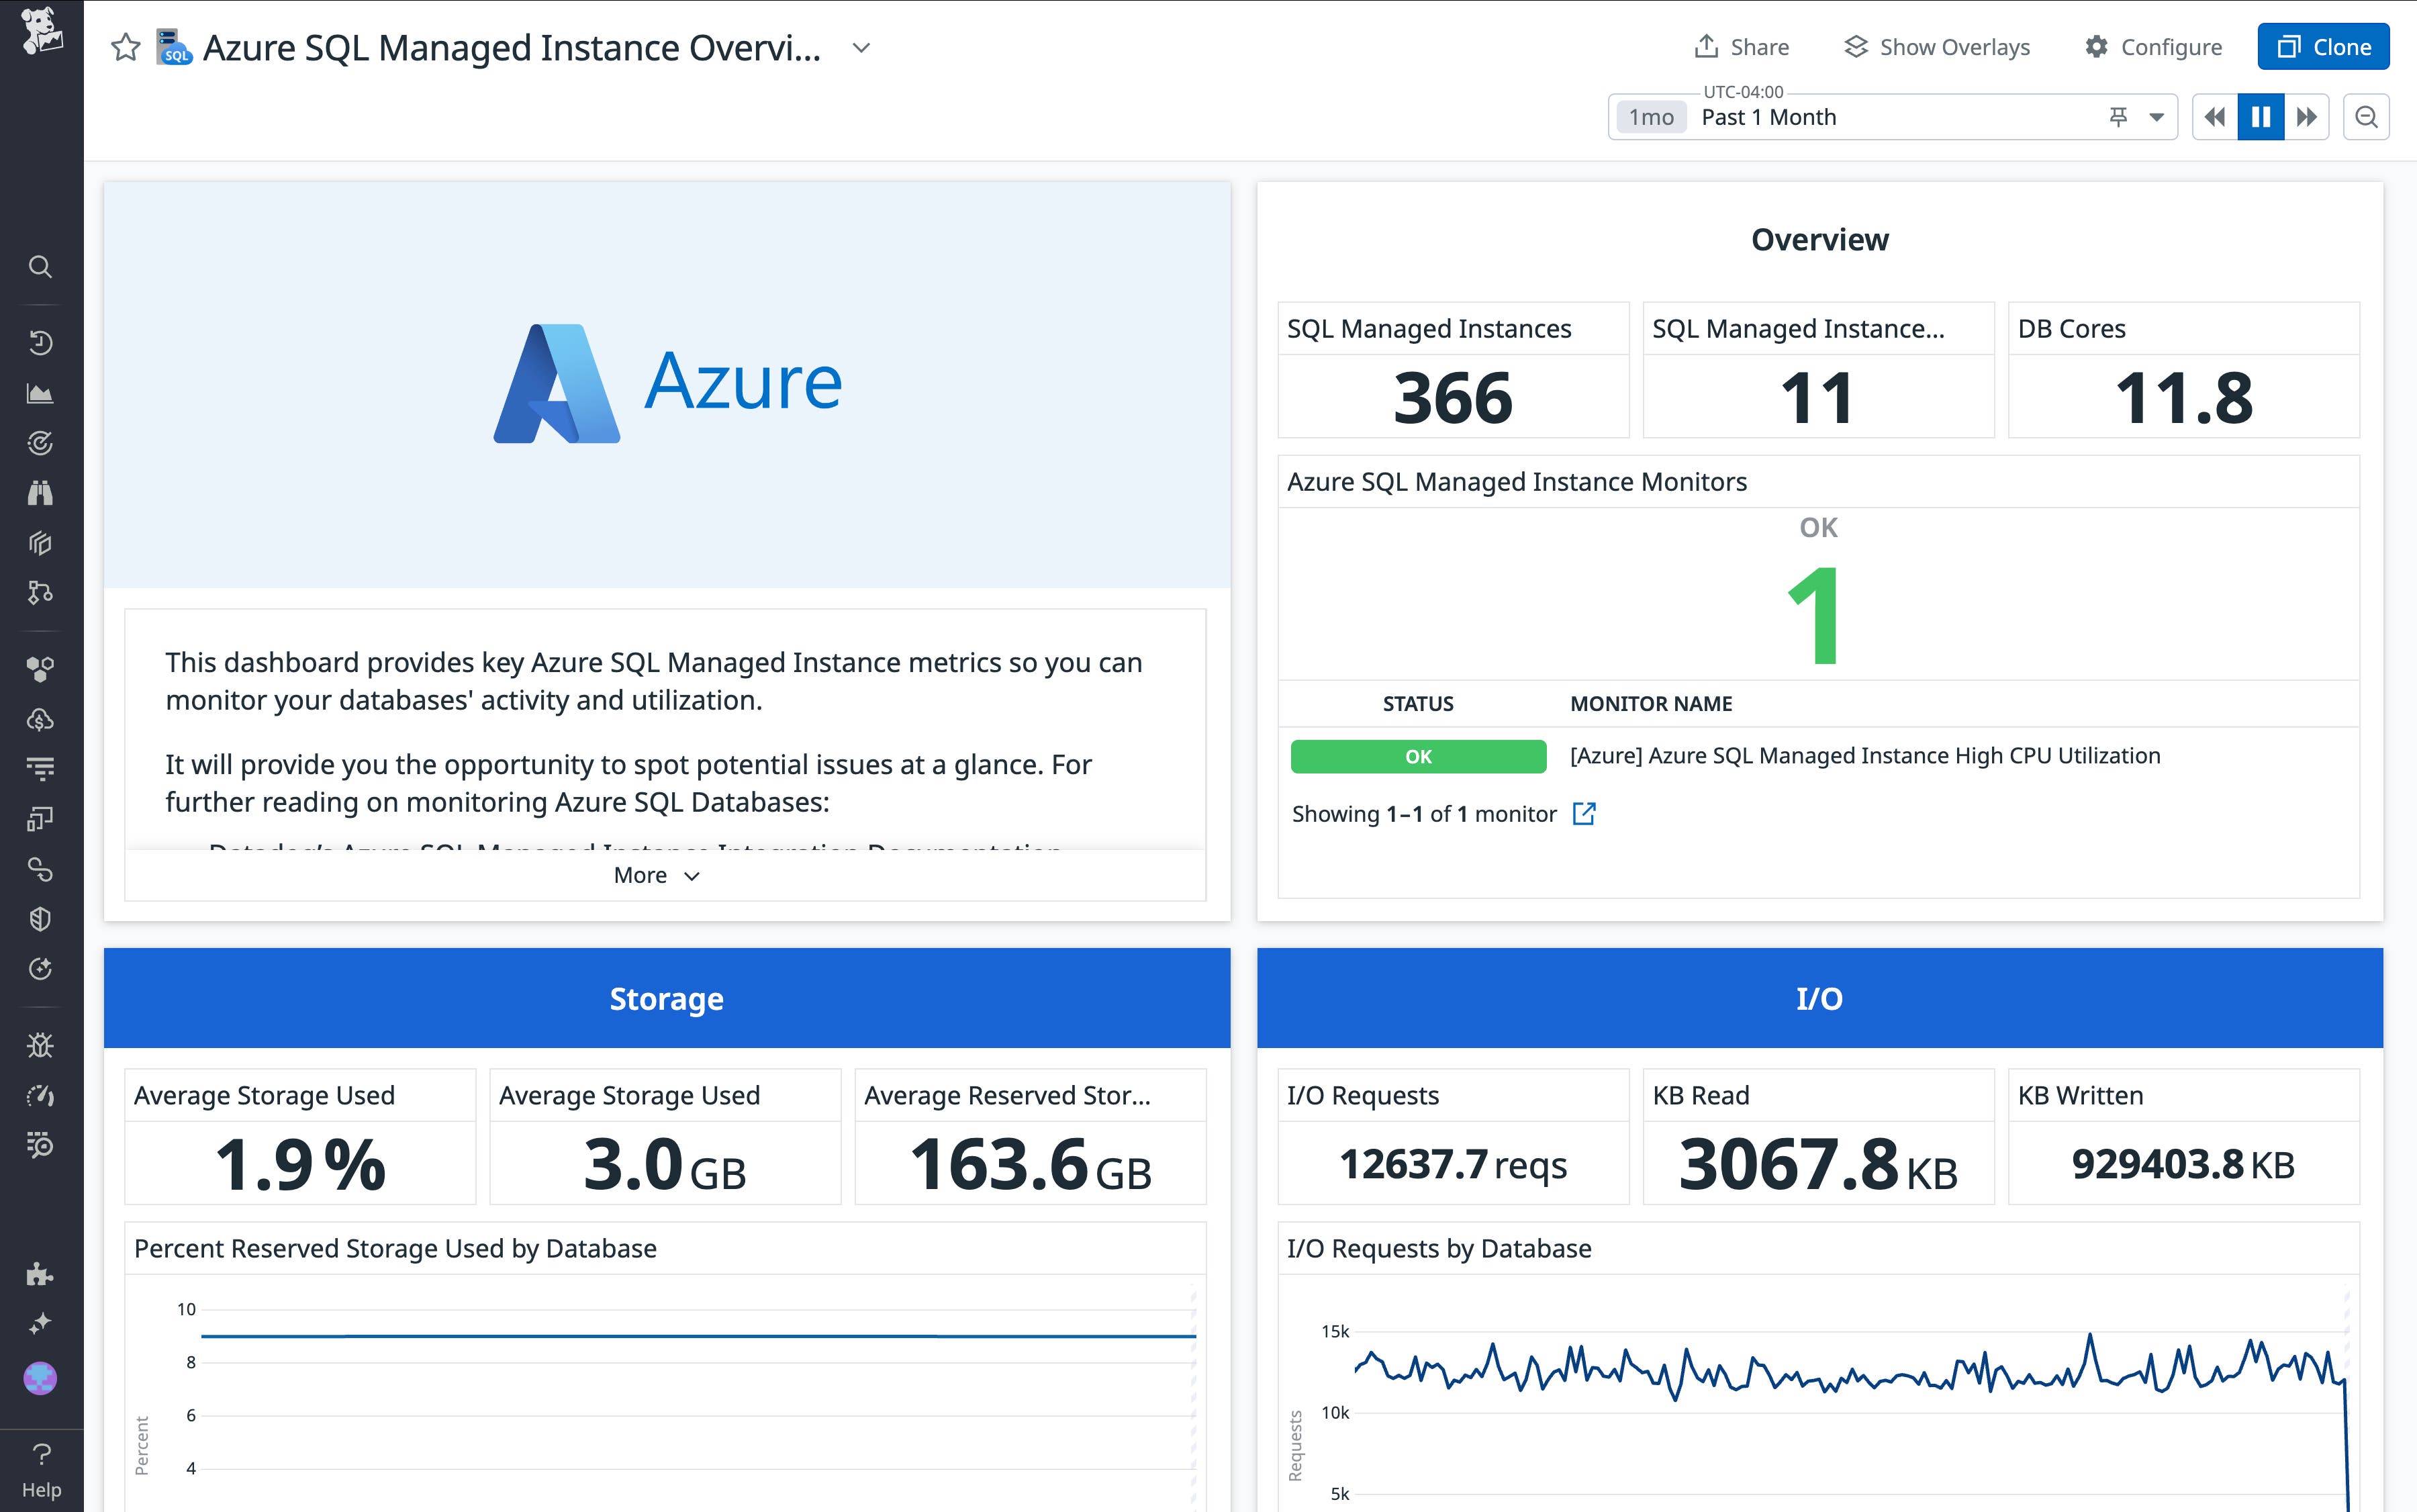
The dashboard’s Overview panel condenses key high-level data, breaking down the total scope of your SQL Managed Instance fleet (in terms of number of instances, databases, and database cores) and the statuses of any monitors you have configured for it.
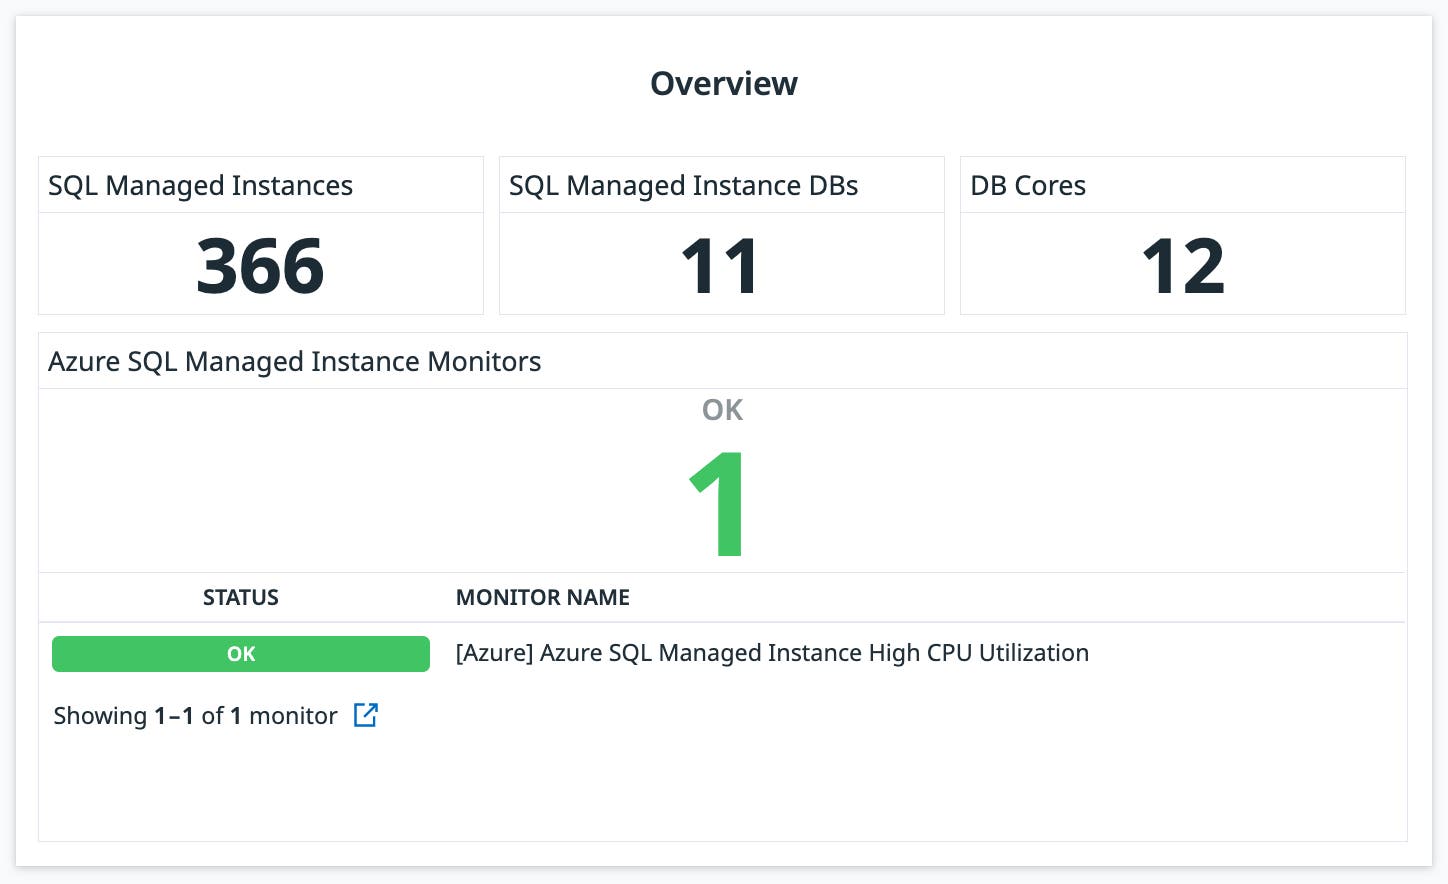
You can turn here for a quick audit of your SQL Managed Instance inventory, or to assess the top-line health and performance tracked by your monitors at a glance.
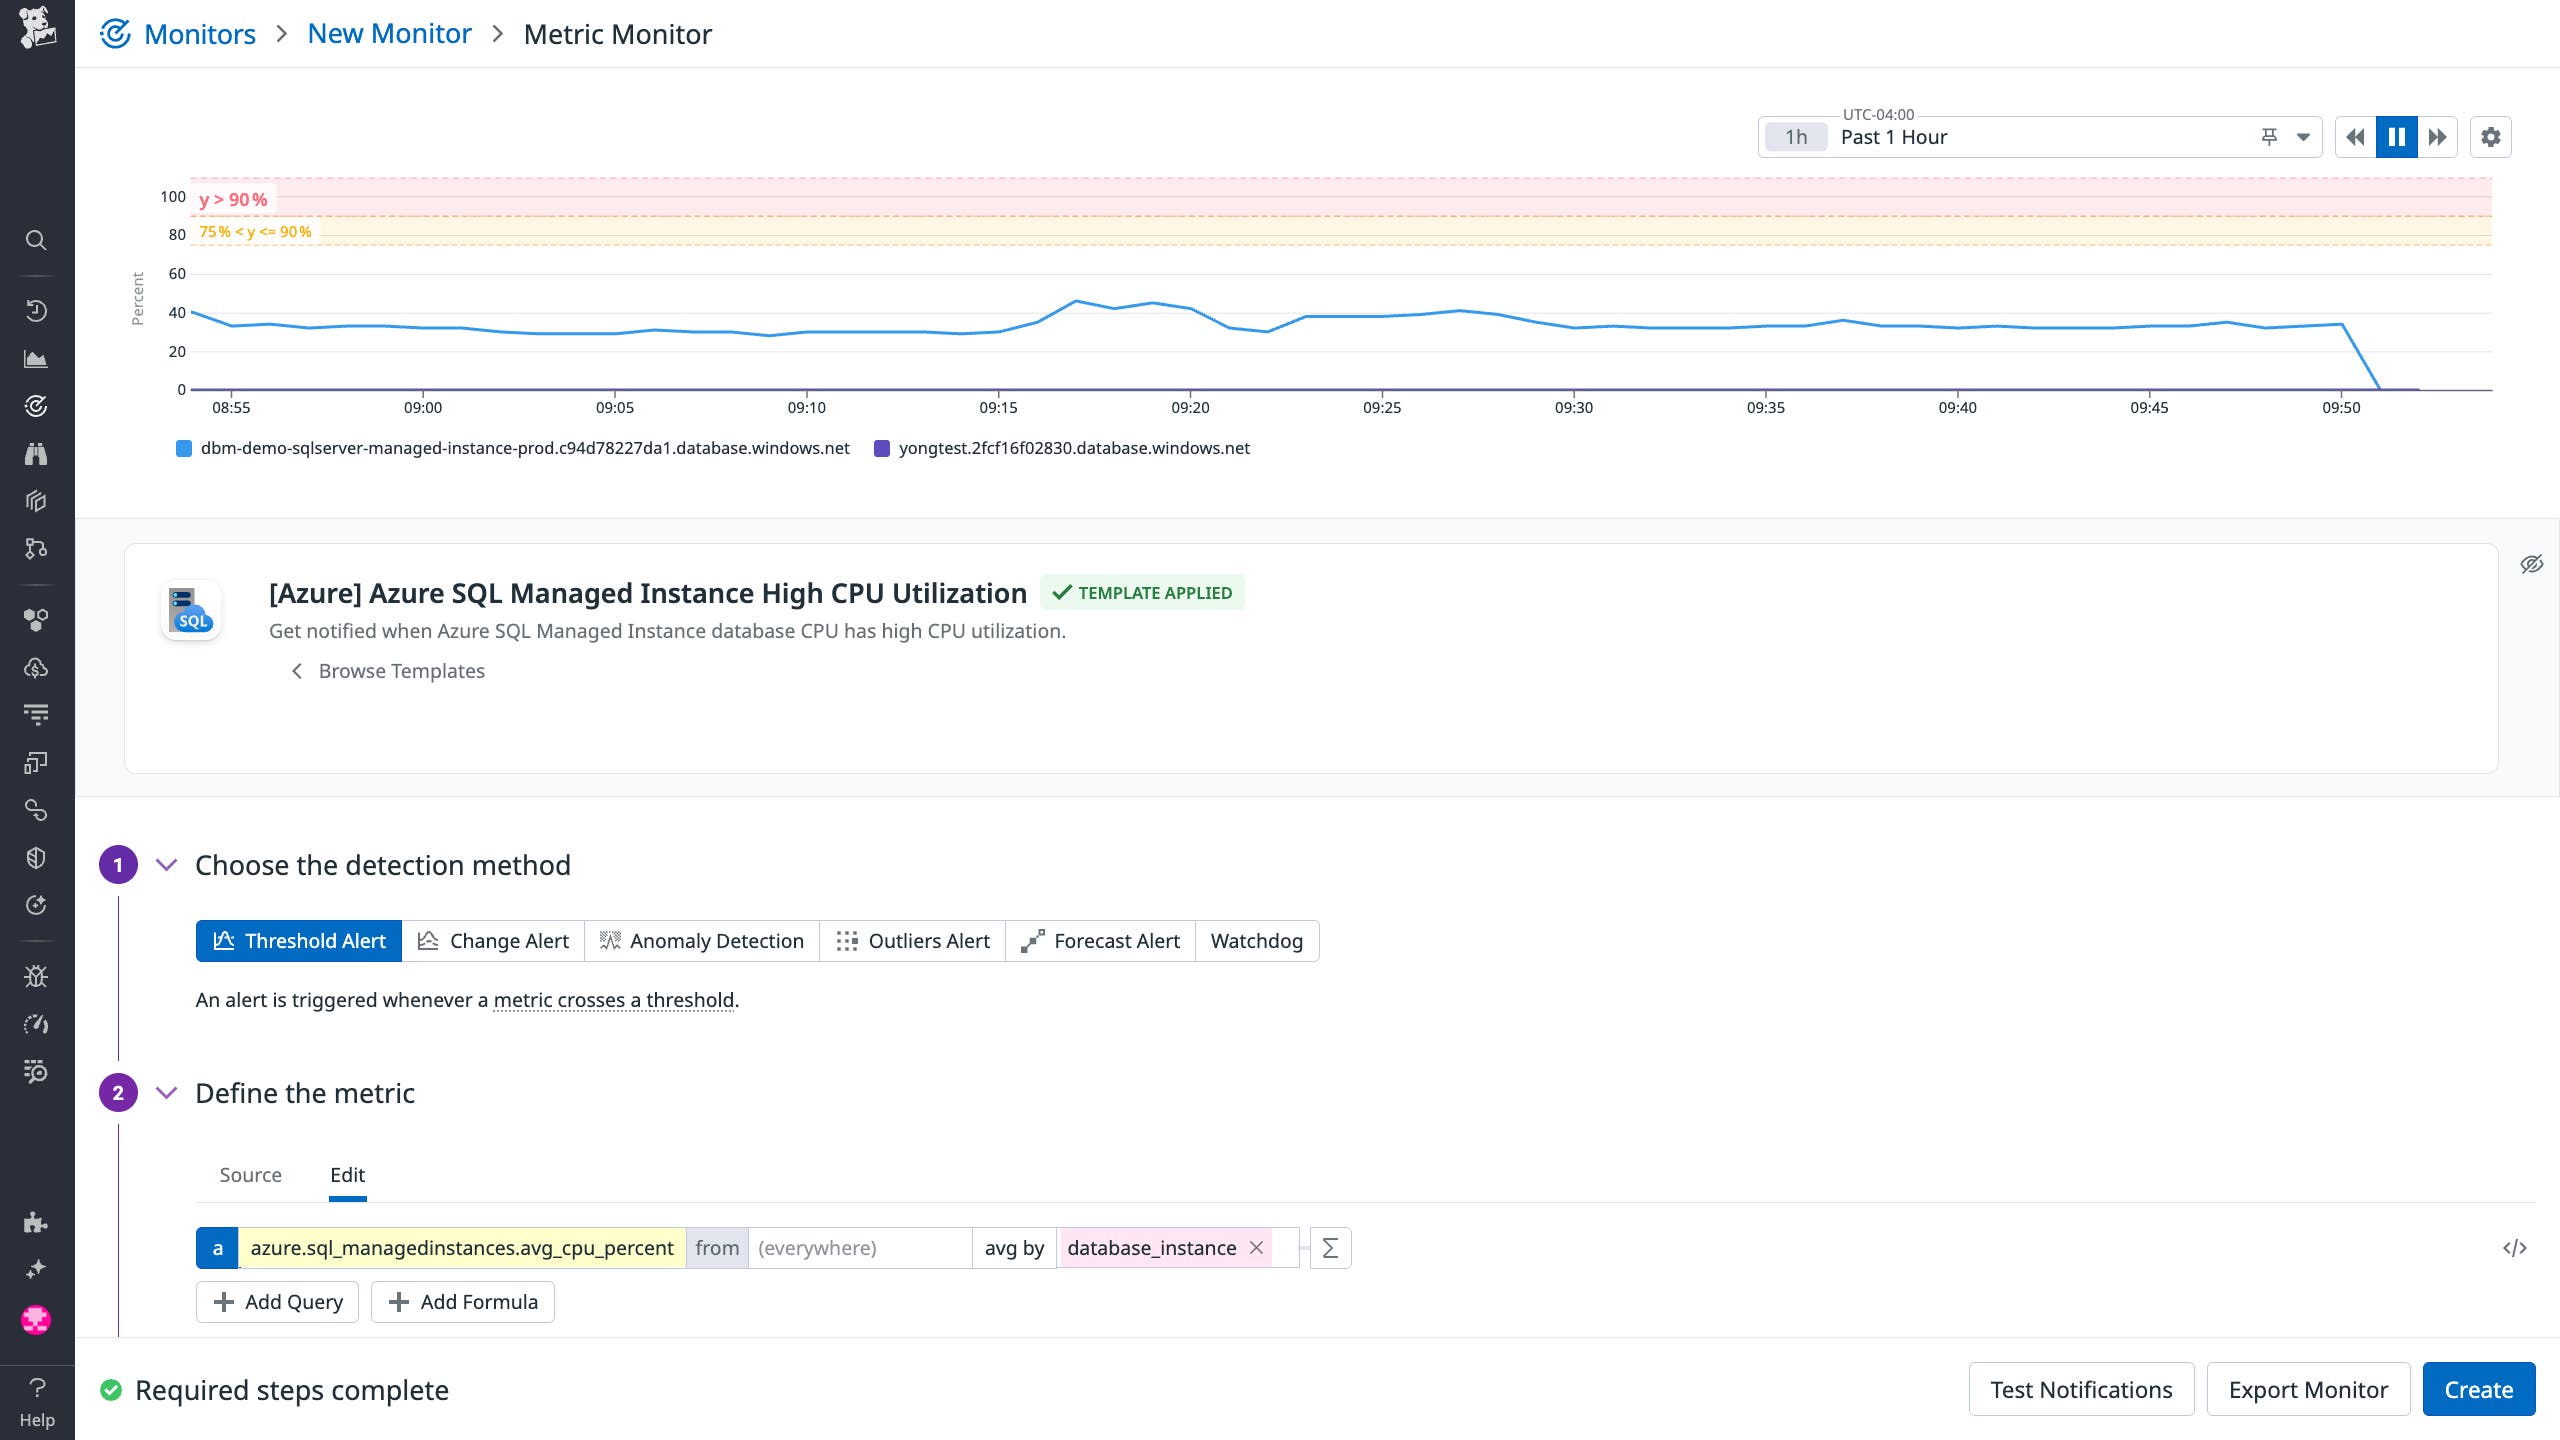
The monitor for high CPU utilization shown above is included with the integration out of the box. By default, this monitor issues a warning when CPU utilization exceeds 75 percent and an alert when it exceeds 90 percent. These (customizable) thresholds are defined in accordance with best practices to help you take preemptive action against performance degradation.
For closer analysis of performance and usage, you can turn to the dashboard’s I/O and Storage panels.
Proactively optimize database usage and performance
In the I/O panel, you can track I/O requests both throughout your entire fleet of instances and by database, as well as KBs read, KBs written, and bytes read by database.
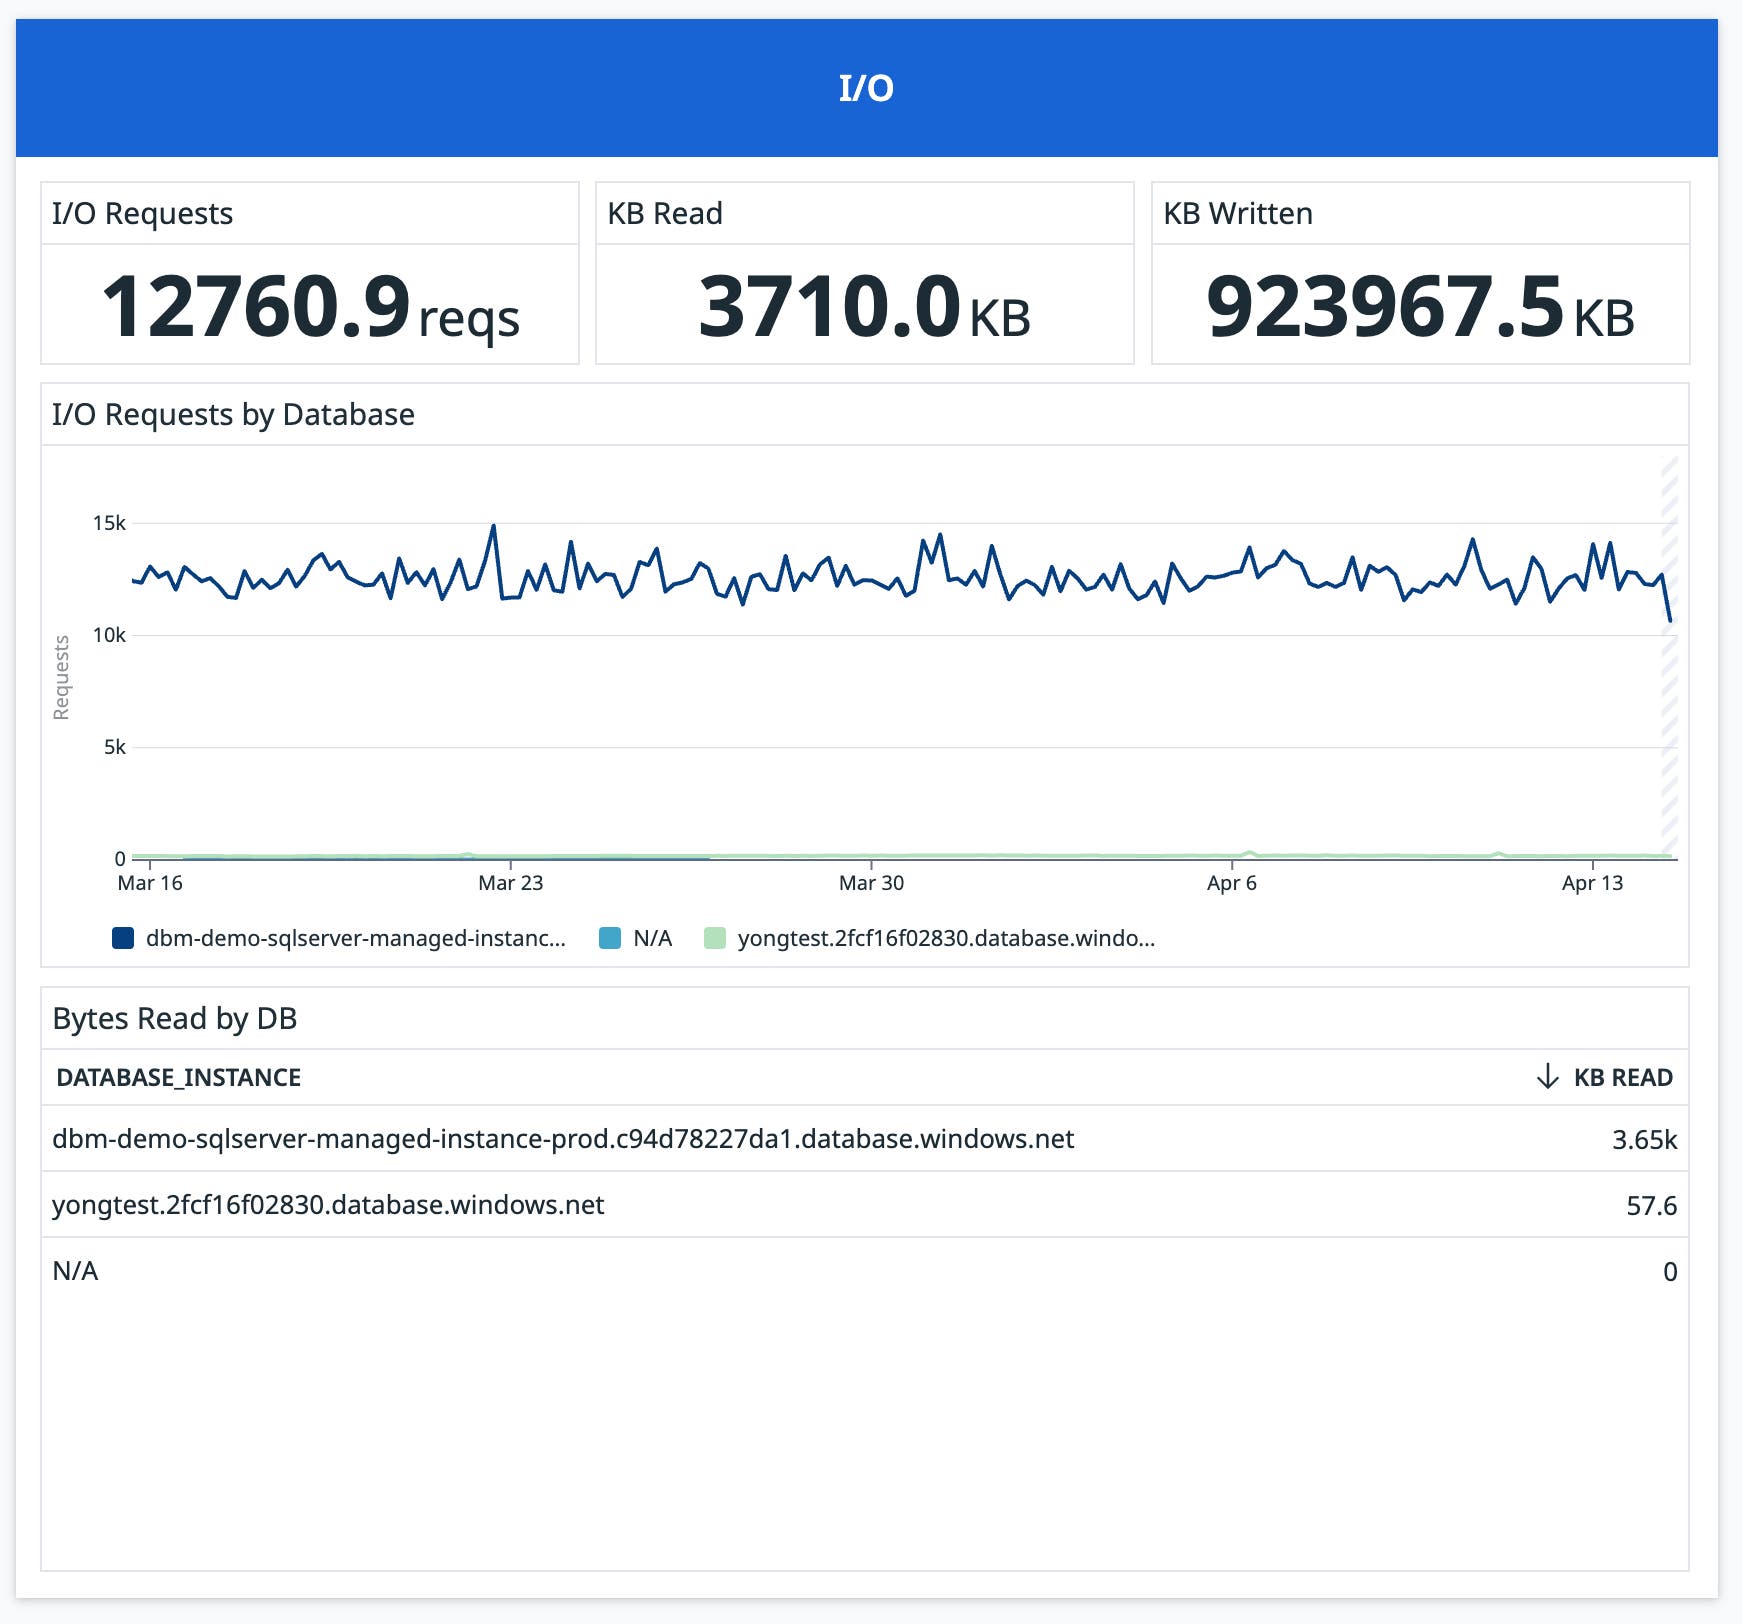
These metrics can help you understand the scope of activity in your SQL Managed Instances and what’s driving it. Correlating them with each other can also yield important performance insights. For example, a spike in either I/O requests or KBs read or written may indicate heavy workloads bogged down by inefficient queries. A spike in I/O requests without a corresponding spike in the volume of KBs written could be a sign of chatty I/O, pointing to an opportunity for query optimization. In general, if certain databases tend to lead the pack in I/O requests and read volumes, you may want to target them for optimization.
The dashboard’s Storage panel visualizes a range of metrics that can help you understand your SQL Managed Instance usage and plan database capacity accordingly, including the average storage used and average reserved storage across your instances, percent reserved storage used by database, and total reserved storage by database.
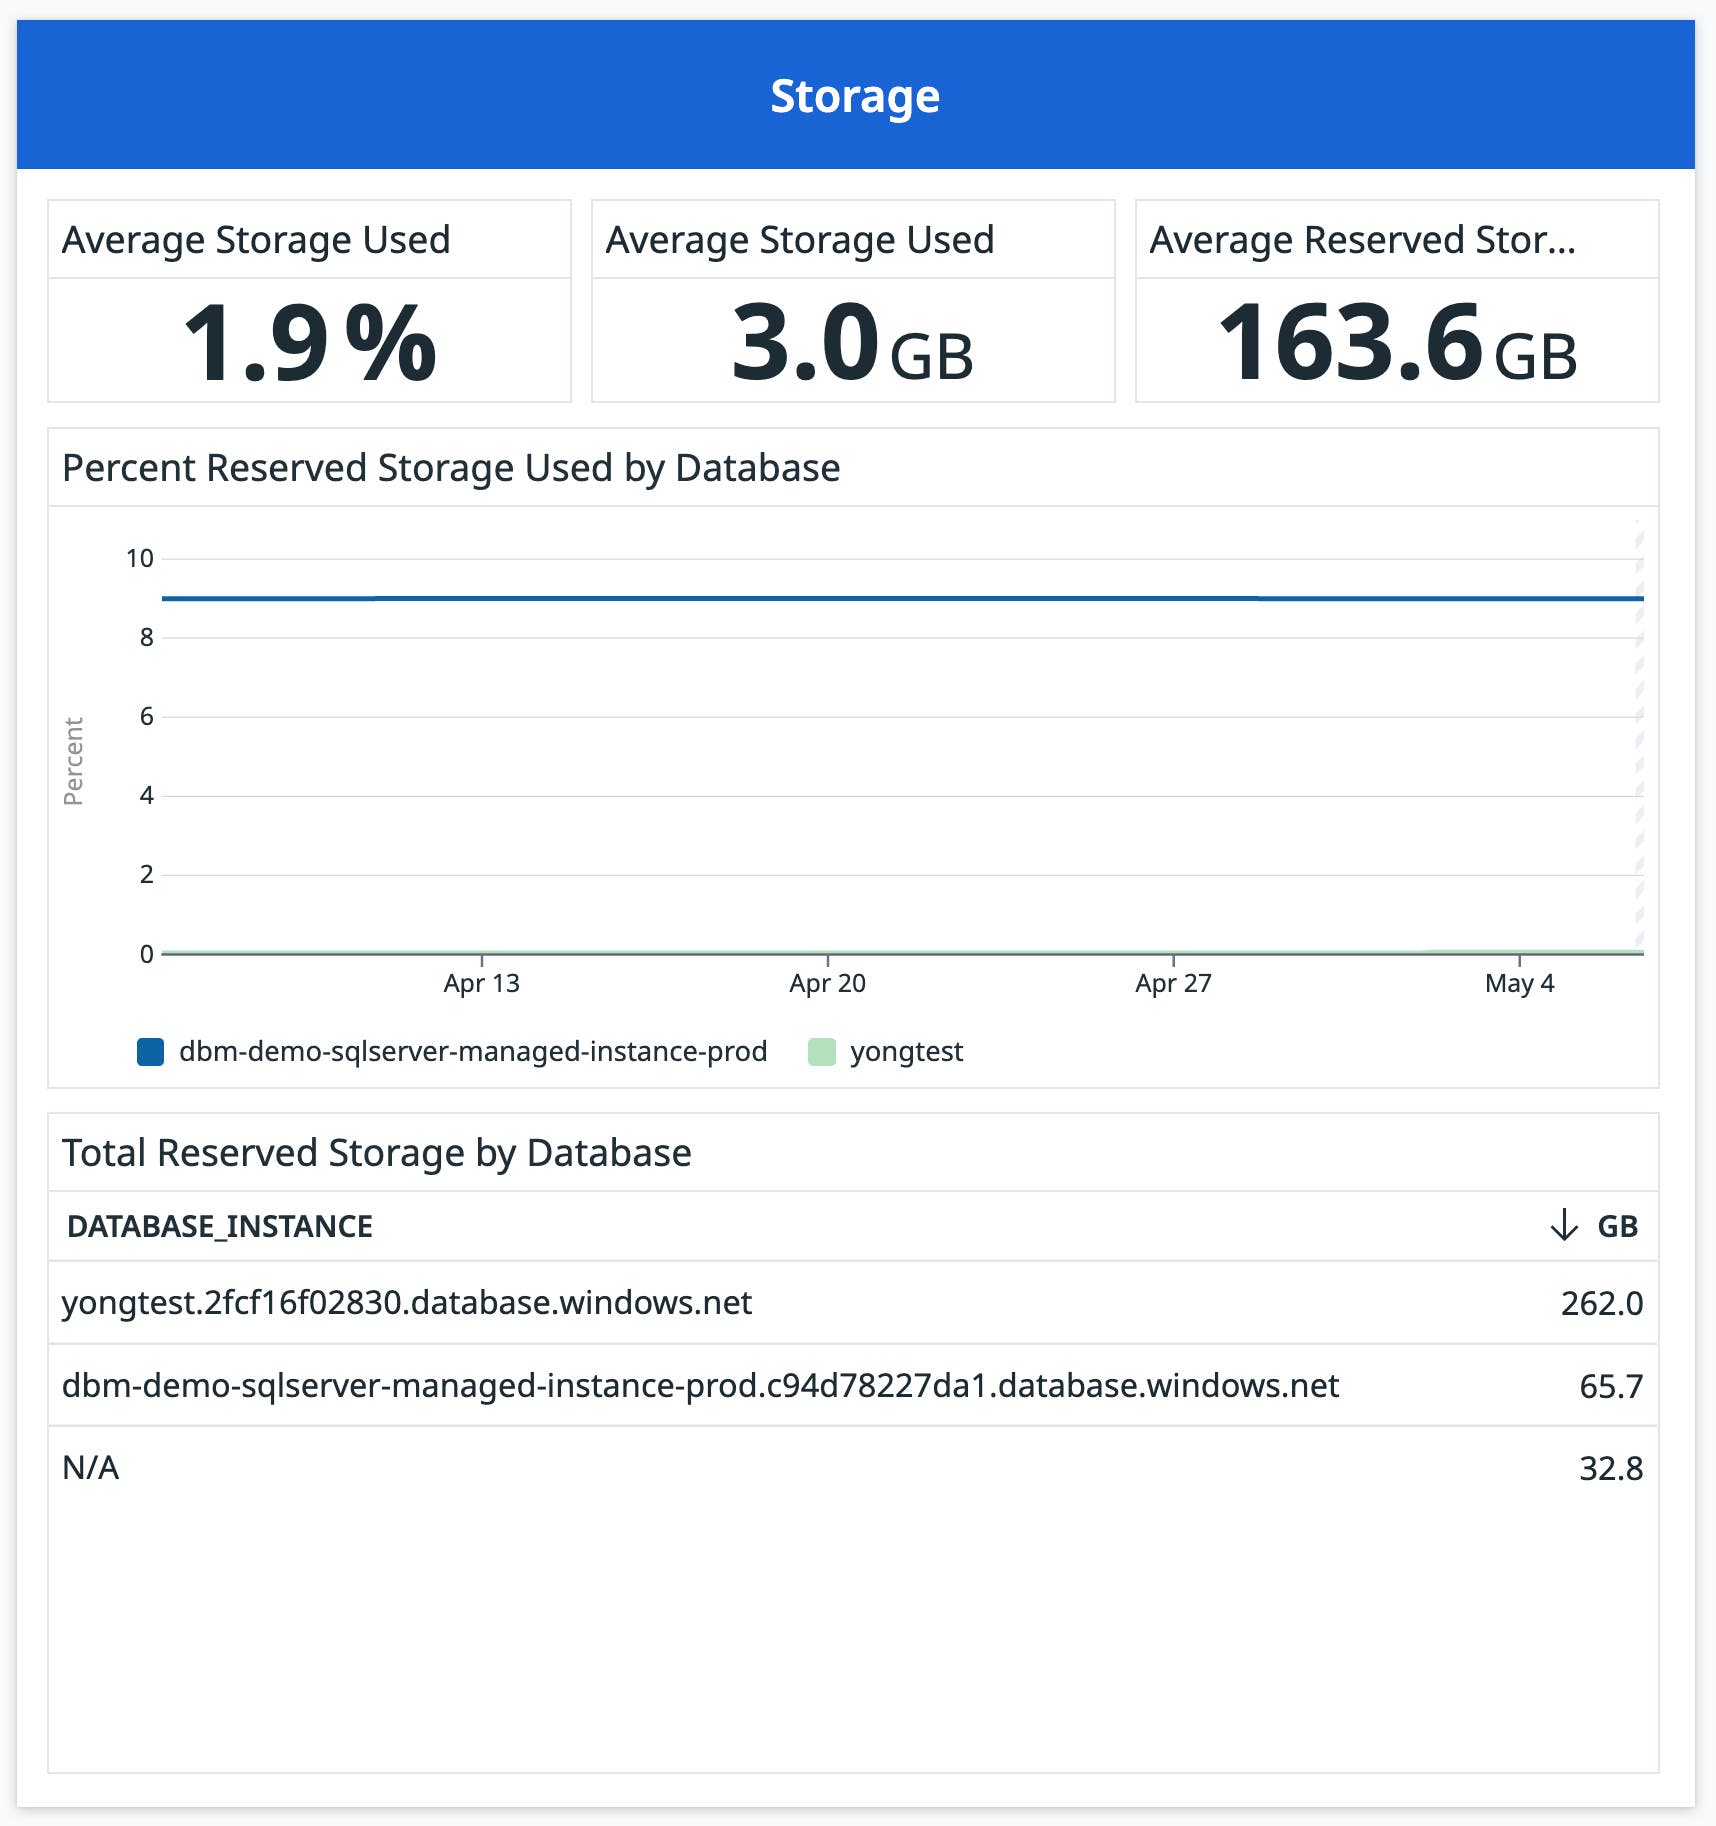
This visibility can help you assess and plan your storage capacity at scale, making it easy to spot outliers and prioritize optimizations, gauge the overall efficiency of your storage usage, and preempt capacity-related slowdowns.
Get started with comprehensive monitoring of your Azure SQL fleet
Datadog provides integrations for all key Azure services, including Azure DevOps, Application Gateway, and Azure Kubernetes Service (AKS). Now, with our integration for Azure SQL Managed Instance, you can gain deep visibility into your Managed Instance fleet in order to proactively optimize your database performance, capacity planning, and more.
You can learn more about monitoring Azure and Azure SQL databases throughout our blog. If you’re interested in learning more about monitoring database performance in general, you may also want to read about Datadog Database Monitoring, which provides a wide range of resources for analyzing and optimizing database performance, including historical query performance metrics, explain plans, host-level metrics, monitoring recommendations, and more. And if you’re new to Datadog, you can sign up for a 14-day free trial.


