Steve Harrington
Azure App Service is a cloud-based platform-as-a-service (PaaS) for deploying functions, web apps, mobile apps, and other resources. It allows developers to deploy code—using common languages and frameworks—in minutes without worrying about provisioning or managing infrastructure. Developers can then use Azure App Service to scale their services dynamically to meet demand.
The benefits to this are clear, but having Azure manage so much behind the scenes can also present a challenge with observability compared to running applications on self-managed VMs. Azure provides basic health and performance metrics for your applications or functions, but this doesn’t always provide the visibility you need. For example, you may be able to see that latency has increased, or that your application is returning errors, but not necessarily what’s causing it. Drilling down into the root cause can be difficult in the context of a PaaS, where you cannot install or deploy the Datadog Agent using traditional methods.
That’s why we are excited to release the Datadog extension for Azure App Service. With a simple install process, you can now collect distributed traces and custom metrics and correlate them with cloud metrics and application logs to gain deep visibility into your .NET applications.
Distributed request tracing
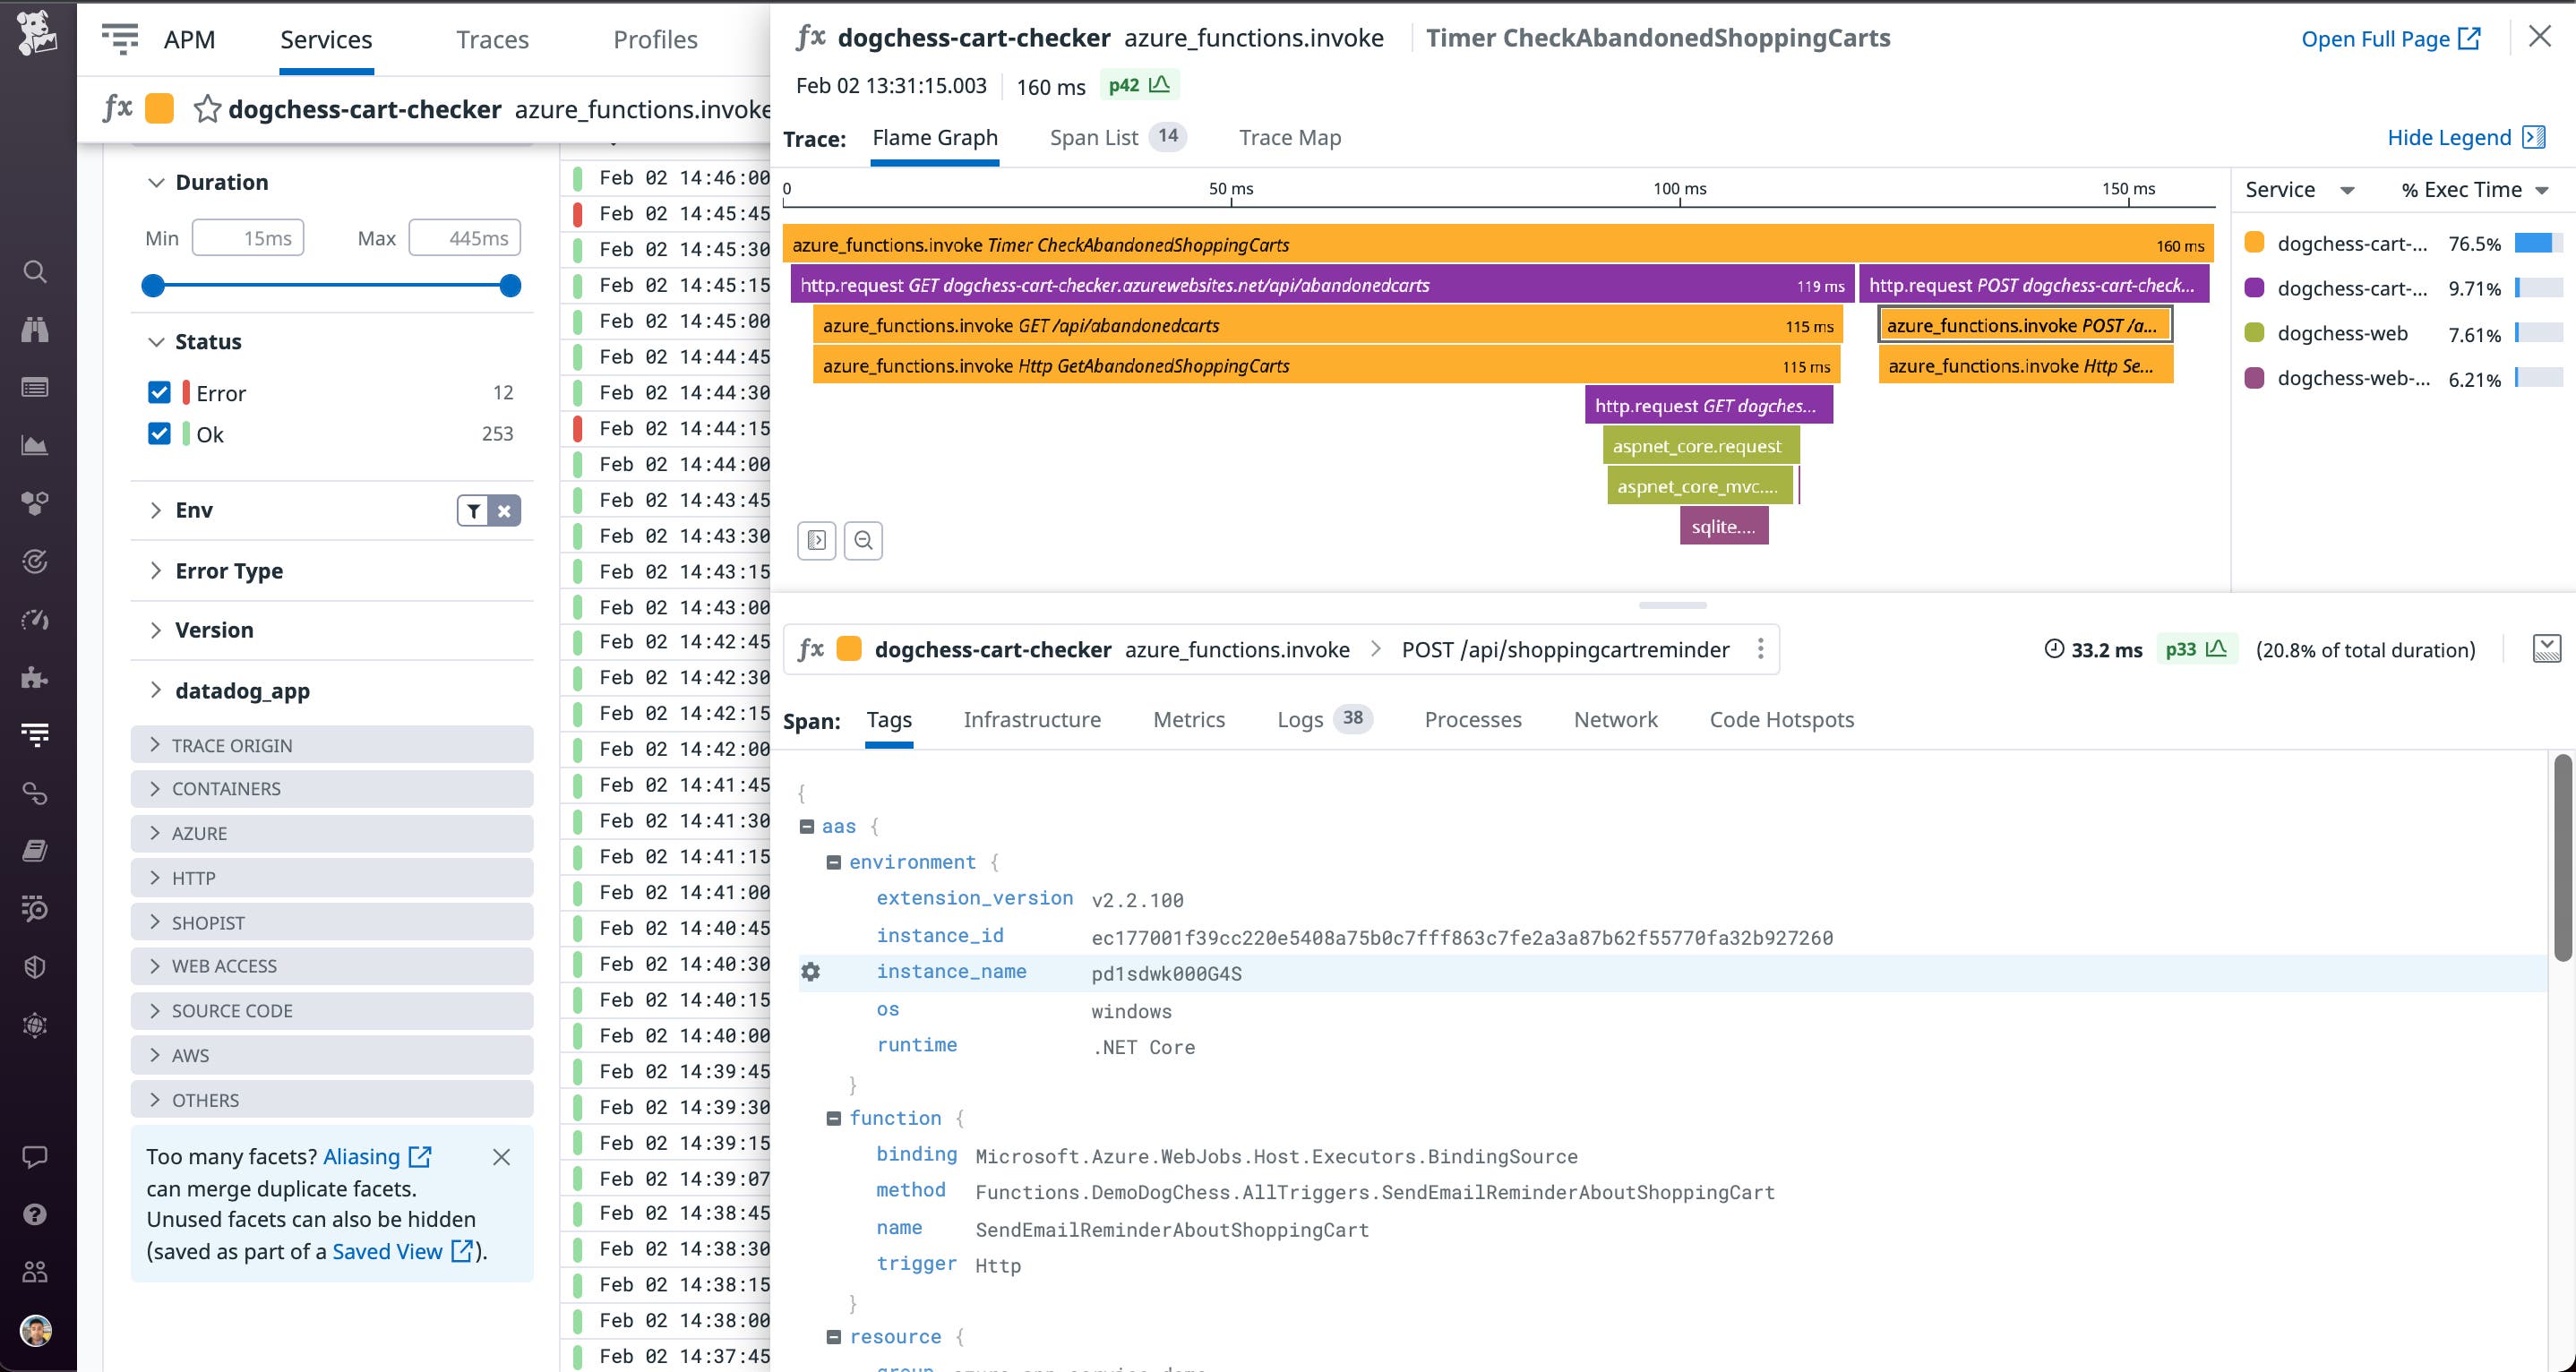
Datadog APM is a powerful tool for optimizing and troubleshooting applications. With this extension, Datadog now enables you to capture request traces from your .NET Azure web apps or function apps automatically. You can then use flame graphs to visualize the full lifespan of requests as they propagate across your entire stack, including components such as managed Azure services like SQL Database and Azure Functions.
Flame graphs are broken down into spans that show how long each step takes. Together, this provides a complete picture of what was happening in your environment so you can easily identify bottlenecks, timeouts, or errors that may have occurred anywhere in the process.

Once you’ve installed the extension on your app, just add your API key as an application setting in the Azure portal to begin receiving traces in Datadog.
Collect application logs and custom metrics
Logs and custom metrics can provide critical insights into the health and performance of your applications as well as into key business data.
Application logs allow you to instrument your applications so you can understand exactly what is happening and where things may be going wrong. Along with collecting Azure resource logs, application logs can be invaluable for troubleshooting errors or understanding performance issues. Using Serilog, you can write logs from your App Service application and submit them directly to Datadog.
Custom metrics help you track key performance indicators that are specific to whatever your application is doing. This could be the number of visitors, the average customer shopping cart size, an internal request latency, or performance distribution for a custom algorithm. The extension includes support for DogStatsD, significantly enhancing your ability to submit custom metrics from your Azure web apps or function apps by implementing compression and batching automatically. Now you can write and submit custom metrics for Azure App Service using the same approach as applications running on standard hosts.
Automatic log, trace, and metric correlation
Datadog makes it easy to quickly pivot between metrics, logs, traces, and other observability data to drill down into the exact information you need. Our extension extends this flexibility for .NET applications running in Azure App Service.
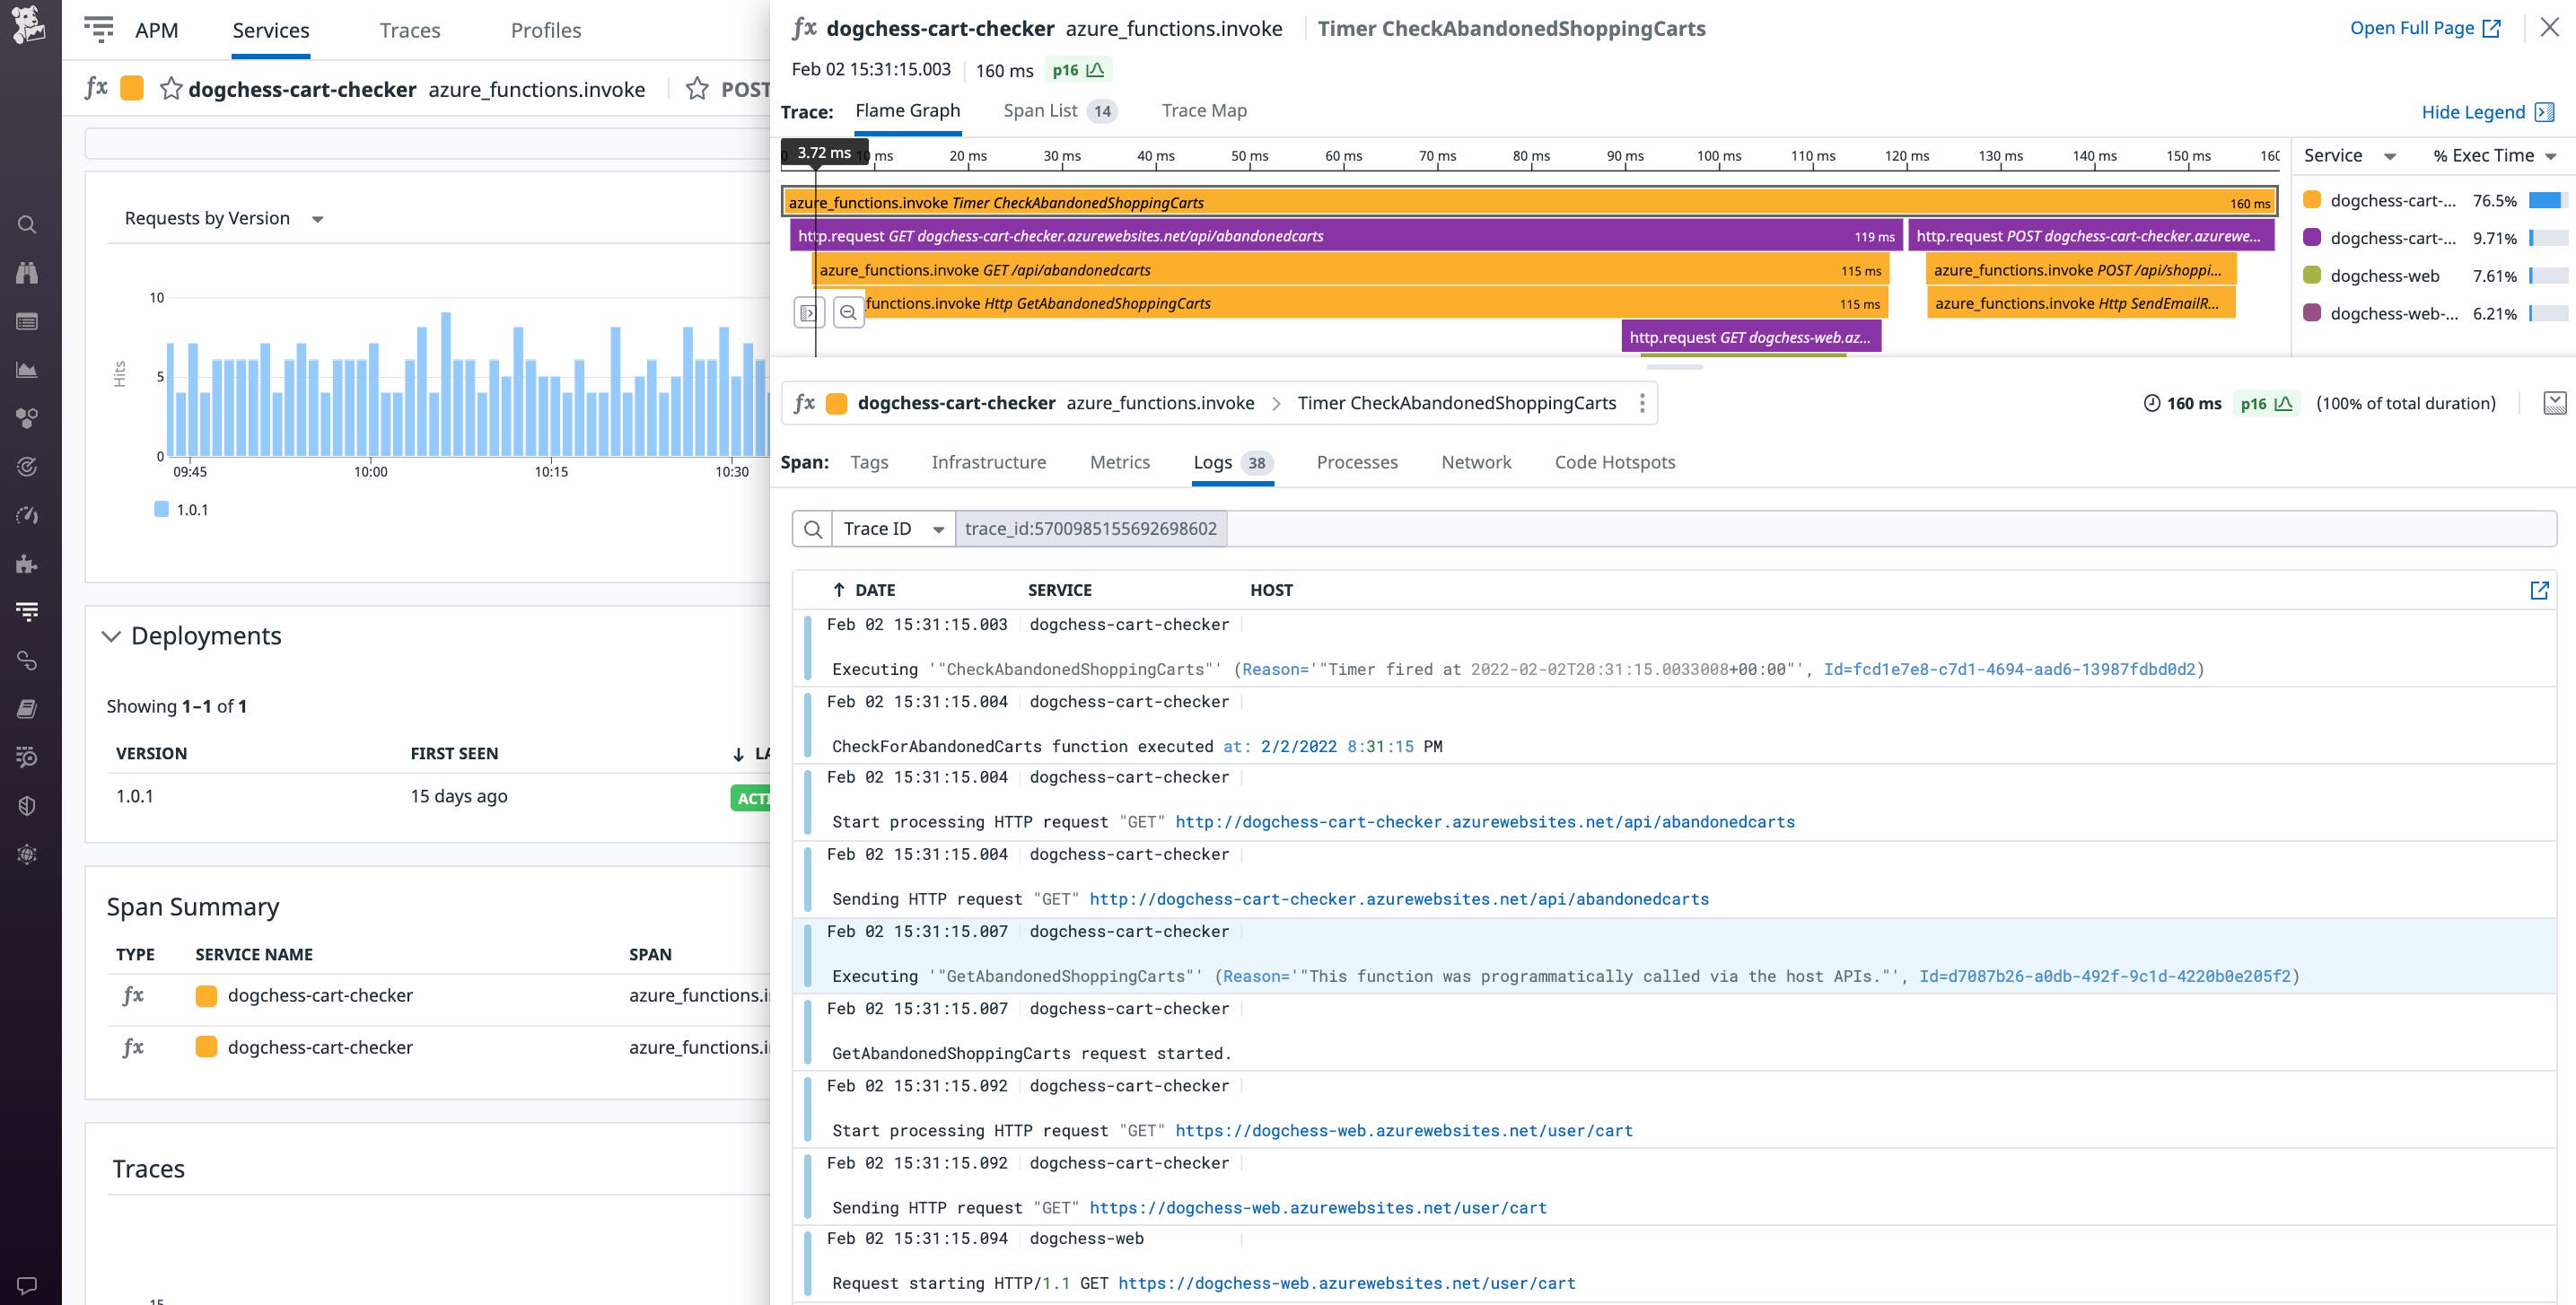
The extension supports trace ID injection on application logs submitted from Serilog, which means that application logs your code generates automatically include a trace ID. Datadog then uses the ID to tie together request traces with the specific logs that were generated as part of that request. This can be a critical aspect of troubleshooting errors or understanding performance bottlenecks in Azure App Service. With trace ID injection, you can easily correlate APM data with logs using a single platform.

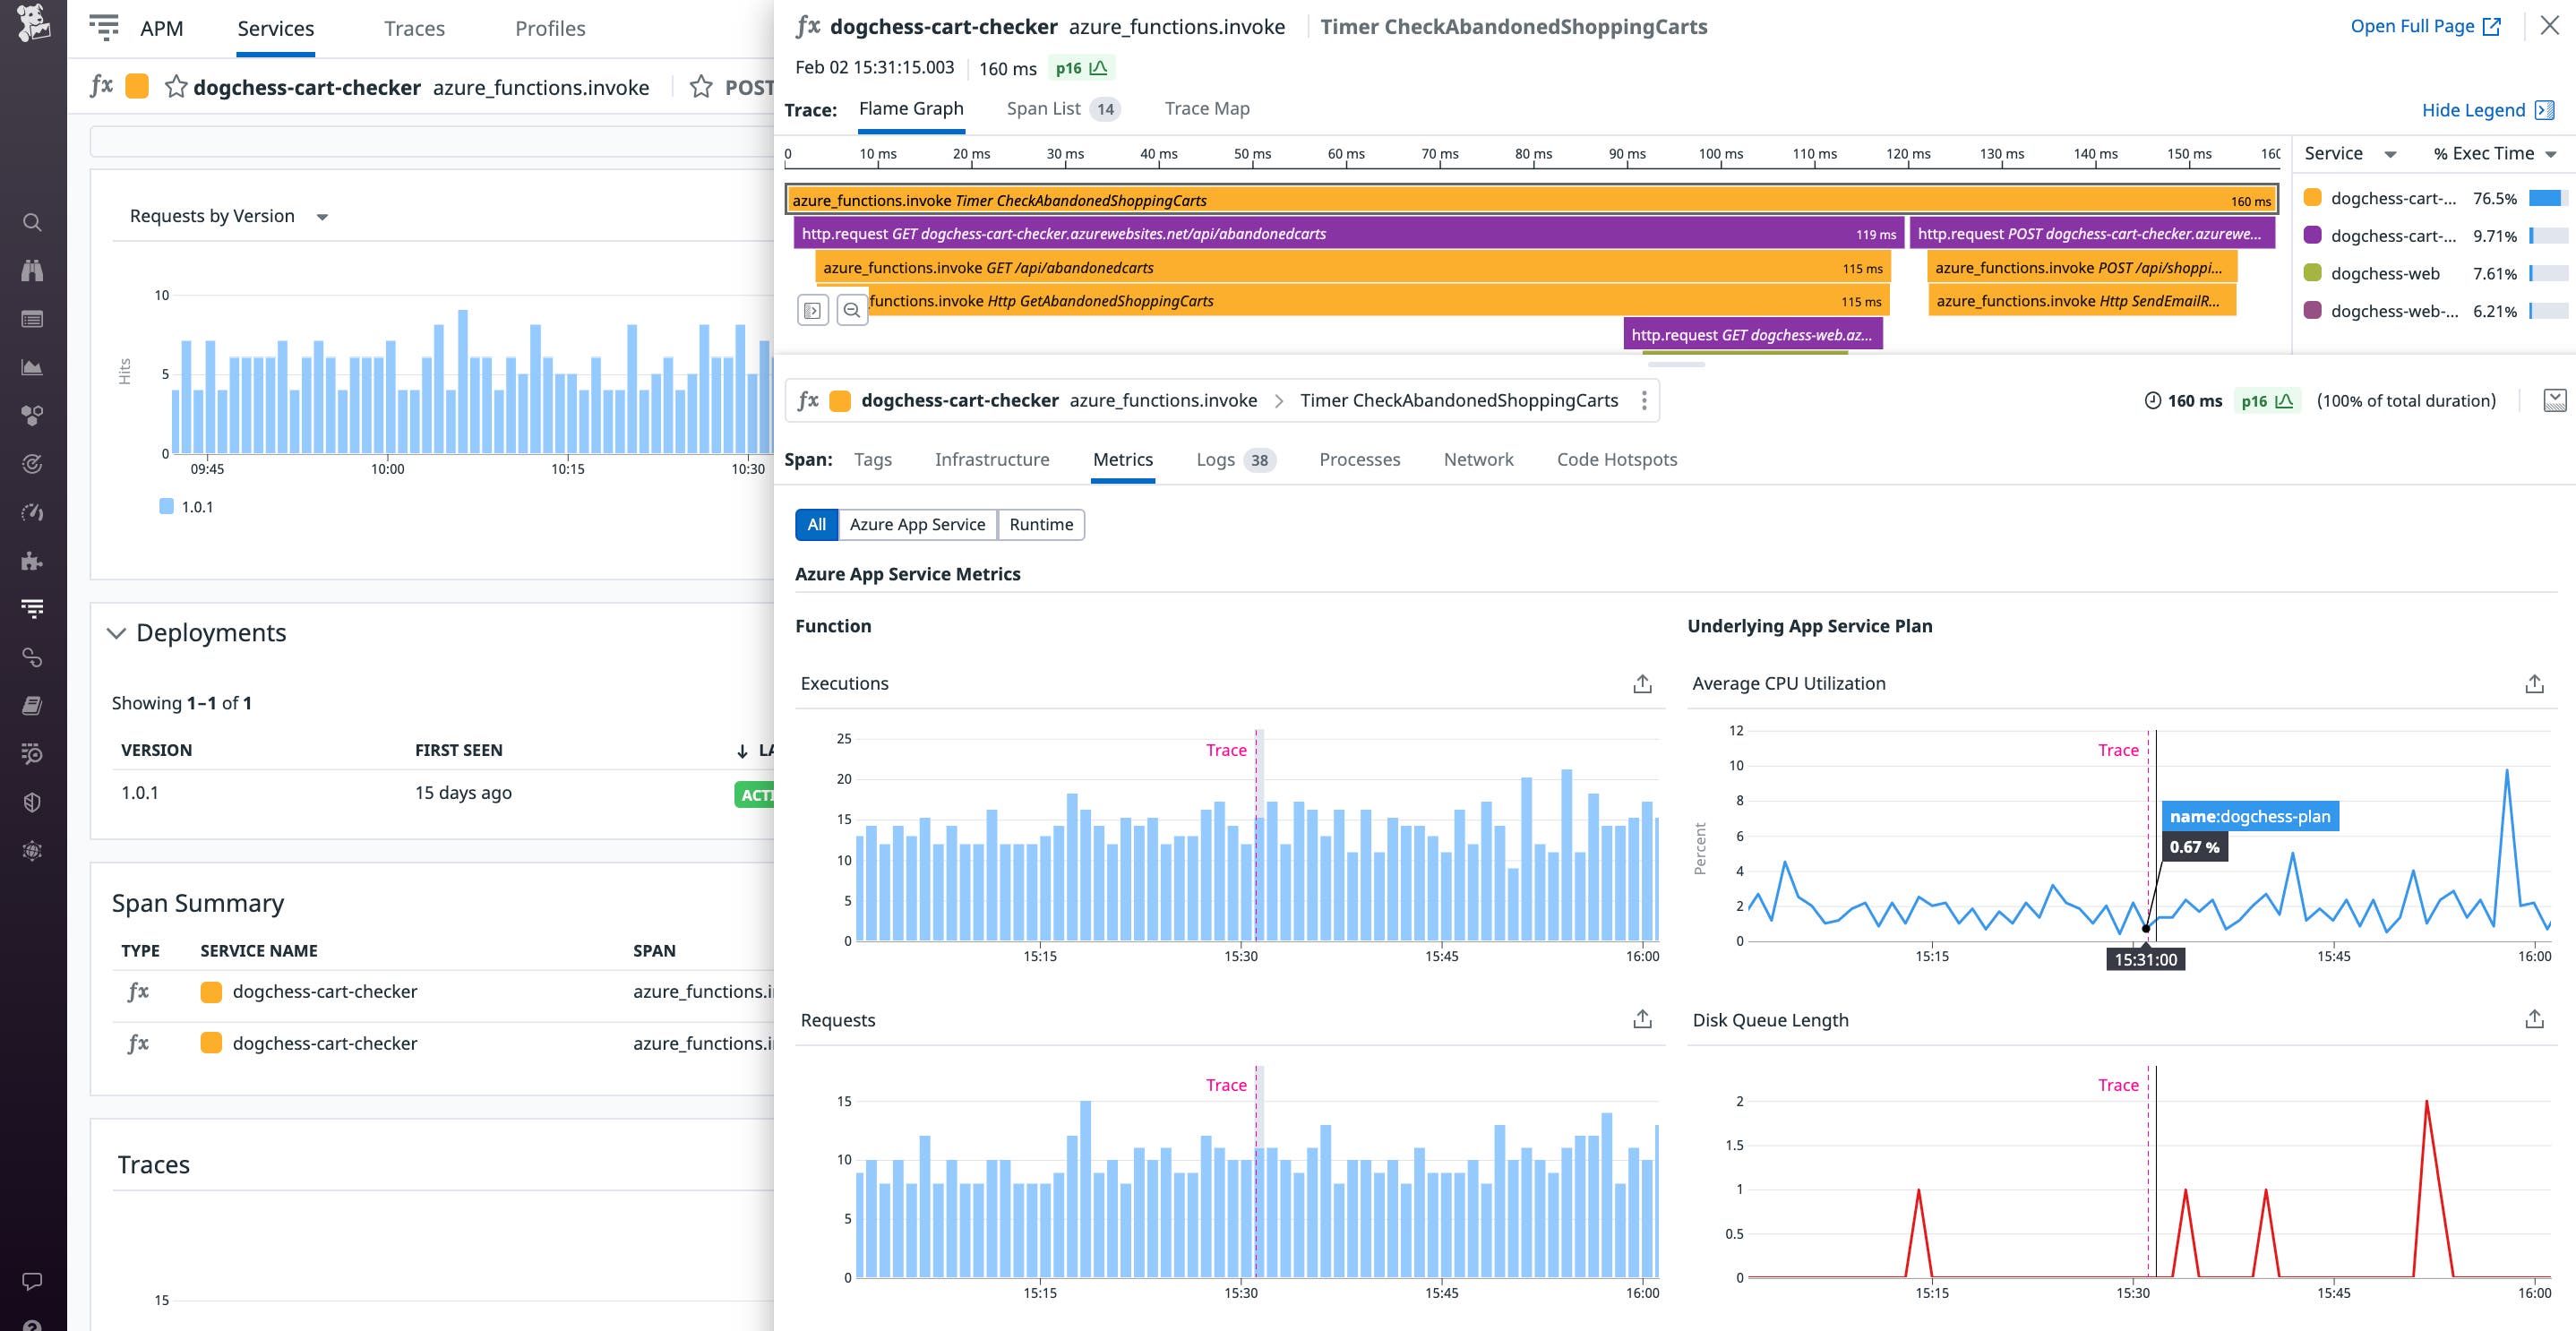
We have also updated our trace visualization to show the relevant cloud metrics from the web app or function app, as well as the underlying App Service plan at the time of the trace. This makes it simple to correlate problems you might be seeing in your application with possible related issues in the performance or capacity of your PaaS hosting environment.

Get started today
The Datadog extension for Azure App Service is available now, so Datadog customers can get started immediately. See our docs for more information. If you’re not yet using Datadog, start a free 14-day trial to get comprehensive insights into the performance and health of your Azure applications and infrastructure.


