Candace Shamieh

Michael Cronk
AWS Parallel Computing Service (AWS PCS) is a managed service that helps users run and scale their high performance computing (HPC) workloads. AWS PCS uses Slurm, an open source workload manager, for scheduling and orchestrating simulations, which enables users to build their scientific and engineering models in a familiar HPC environment. Because AWS PCS automatically provisions and scales compute nodes in response to job queue demand, users can focus on fine-tuning models instead of managing the underlying infrastructure.
While using AWS PCS removes the complexity that comes with building and operating an HPC environment, teams still need visibility into their cluster activity, job performance, and cost drivers. That’s why we’re proud to announce our new AWS PCS integration. By monitoring AWS PCS with Datadog, you can optimize your HPC workloads, control costs, and review how these workloads interact with your broader environment.
In this post, we’ll discuss how our AWS PCS integration enables you to track cluster capacity in real time and helps you optimize your entire HPC stack.
Track cluster capacity and utilization in real time
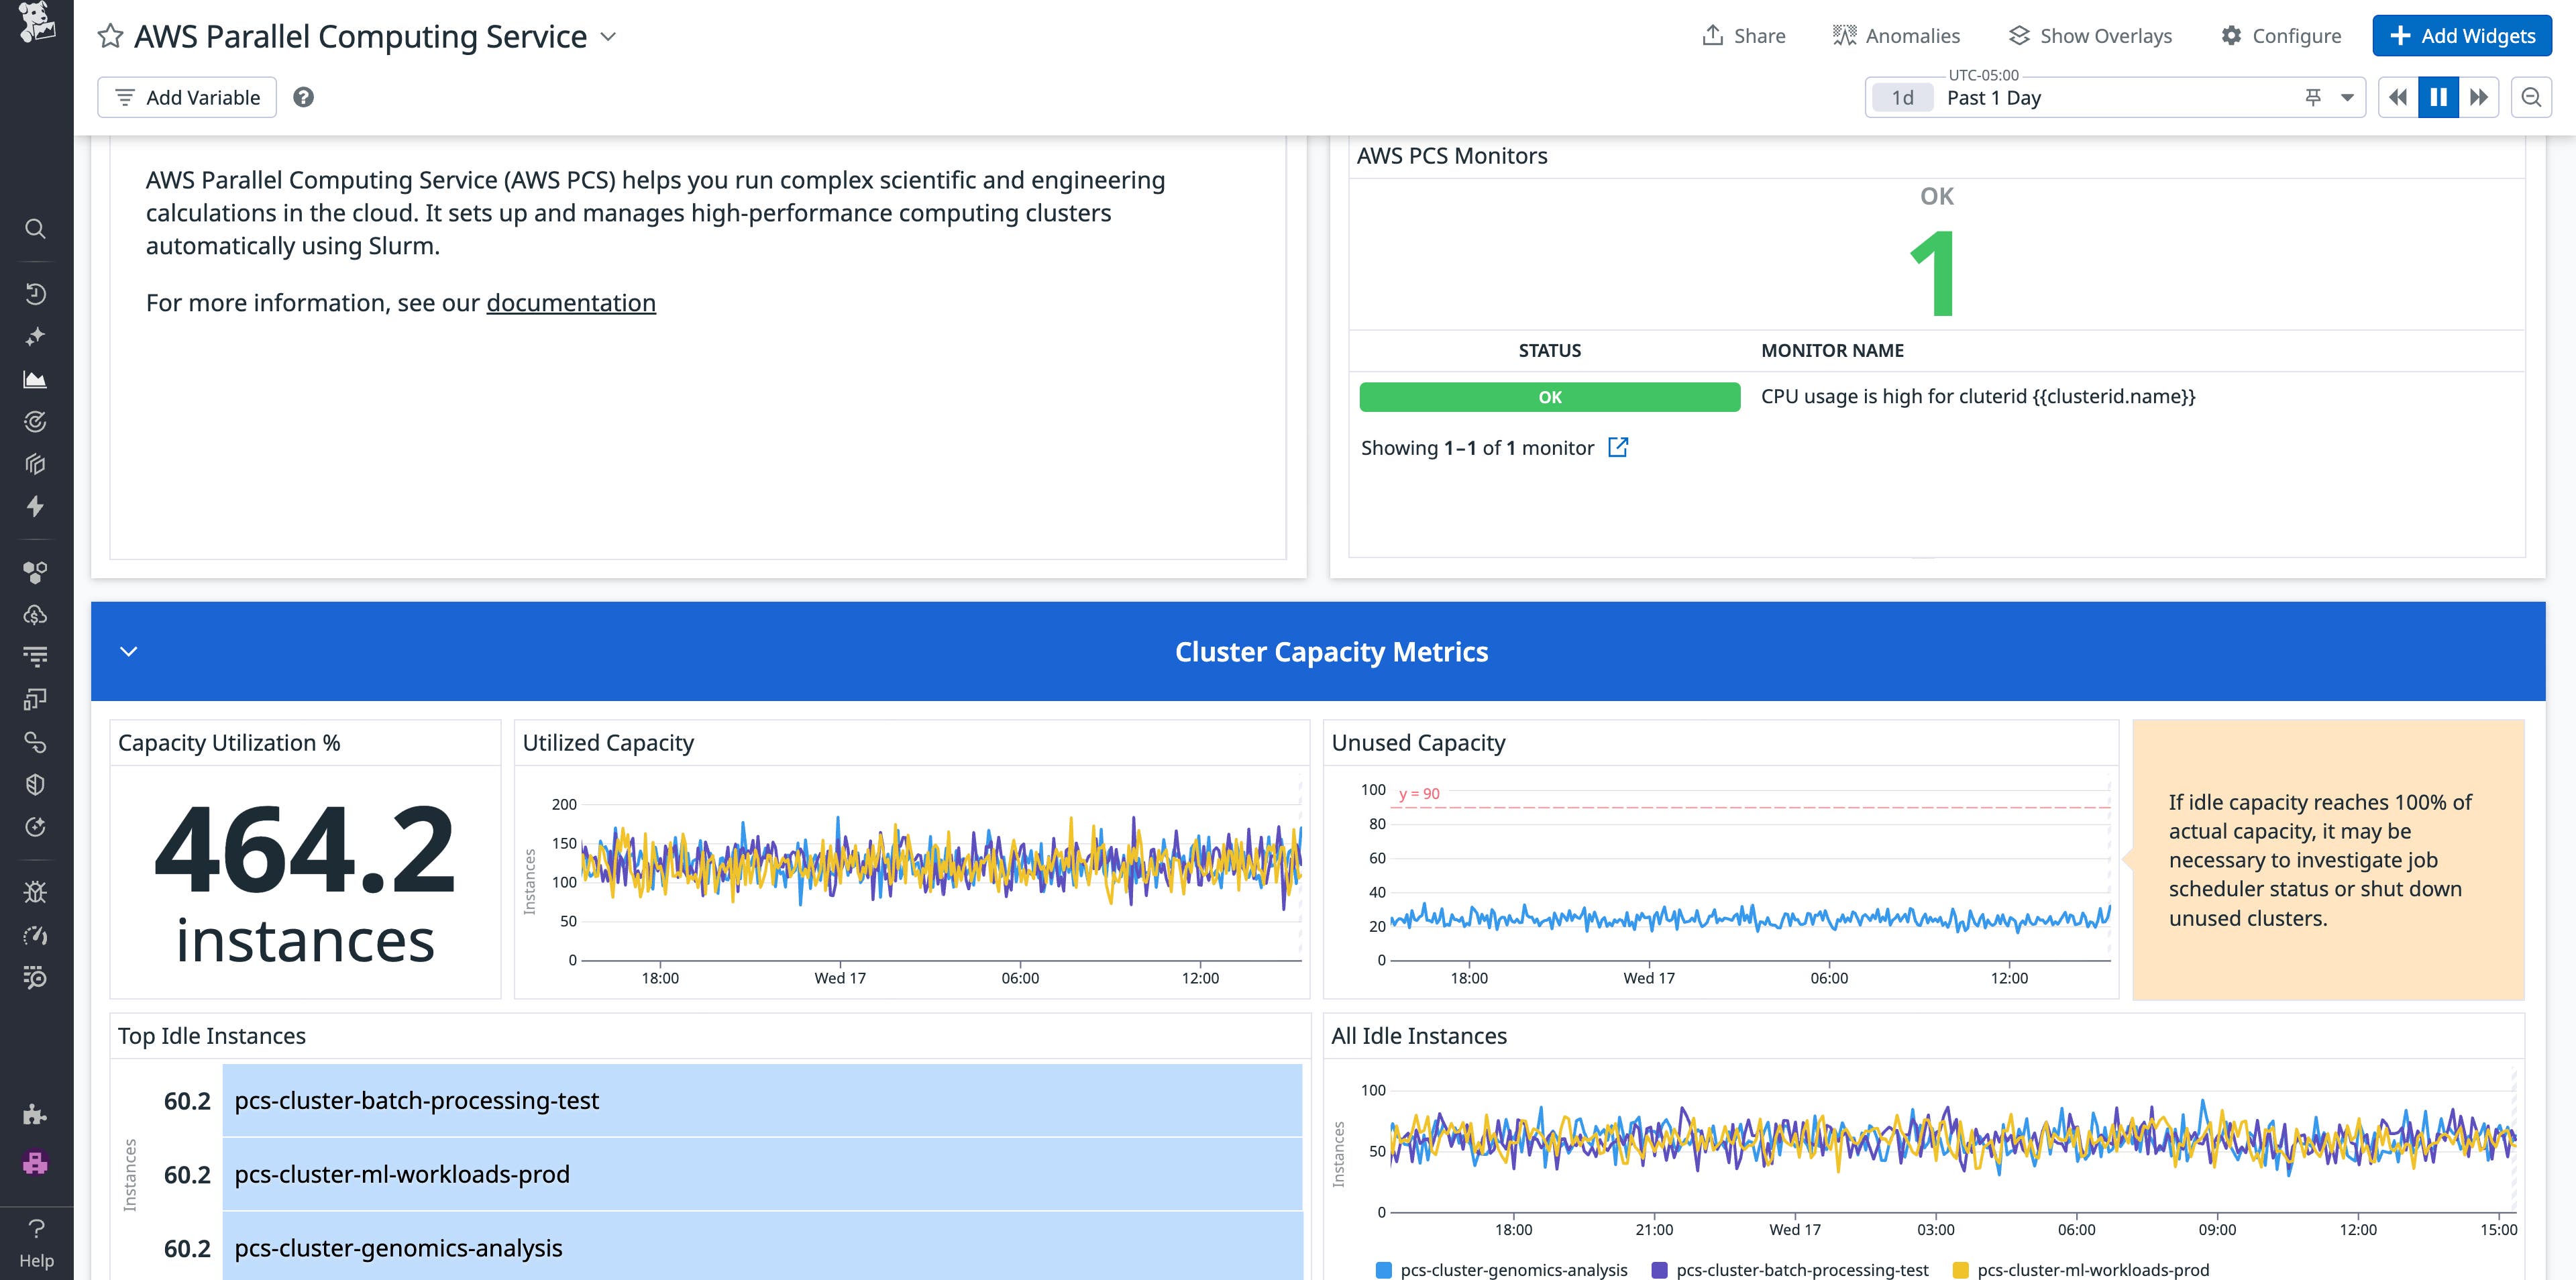
Once you install the AWS PCS integration, Datadog will begin collecting metrics from your clusters and compute nodes. Metrics will populate in the out-of-the-box AWS Parallel Computing Service dashboard, where you can review information such as utilized and idle instances, unused and actual capacity, and the status of any AWS PCS-related monitors.

By using the AWS Parallel Computing Service dashboard, you can use real-time and historical data to help you optimize your HPC workloads. Since AWS PCS bills hourly at both the cluster and compute node level, having visibility into cluster capacity and the number of compute nodes that your HPC workloads actually require is key to minimizing costs.
For example, let’s say you’re an HPC systems administrator for a university. The university’s HPC workloads tend to be spiky because a diverse set of users—students, staff, and researchers—request resources for a diverse set of applications. To ensure that you have enough resources to meet demand, you’ve deployed a large AWS PCS cluster. After the cluster runs 24/7 for a month without any performance issues, you decide to conduct an in-depth historical analysis. Opening the Datadog app, you navigate to the AWS Parallel Computing Service dashboard and see that only 14% of instances were utilized over the past month. During peak times, the workloads required a maximum of 400 instances in order to run, but on average, only needed 200. To reduce costs and prevent the cluster from running more instances than jobs require, you delete the large cluster and deploy a medium cluster instead.
With the metrics provided by the AWS PCS integration, your teams can determine the amount of cluster capacity being used versus sitting idle, whether you’ve provisioned the ideal number of compute nodes necessary for your workloads, and if you’re running an excess of Amazon EC2 instances. This helps HPC engineers, architects, and system administrators identify inefficiencies, eliminate wasted resources, and ensure that workloads have the processing power they need without overprovisioning.
Combine AWS PCS insights with Slurm metrics to optimize your entire HPC stack
HPC workloads rarely exist in isolation. Because HPC jobs scheduled on AWS often rely on specialized compute nodes, parallel file systems, and GPUs, you need visibility into your entire HPC stack to make informed decisions about resource allocation and pinpoint bottlenecks.
When you install our Agent-based Slurm integration, HPC job information will start to populate in Datadog. Together with the cluster and compute node metrics collected with the AWS PCS integration, you’ll gain granular visibility into your HPC environment and have the information you need to accelerate investigations.
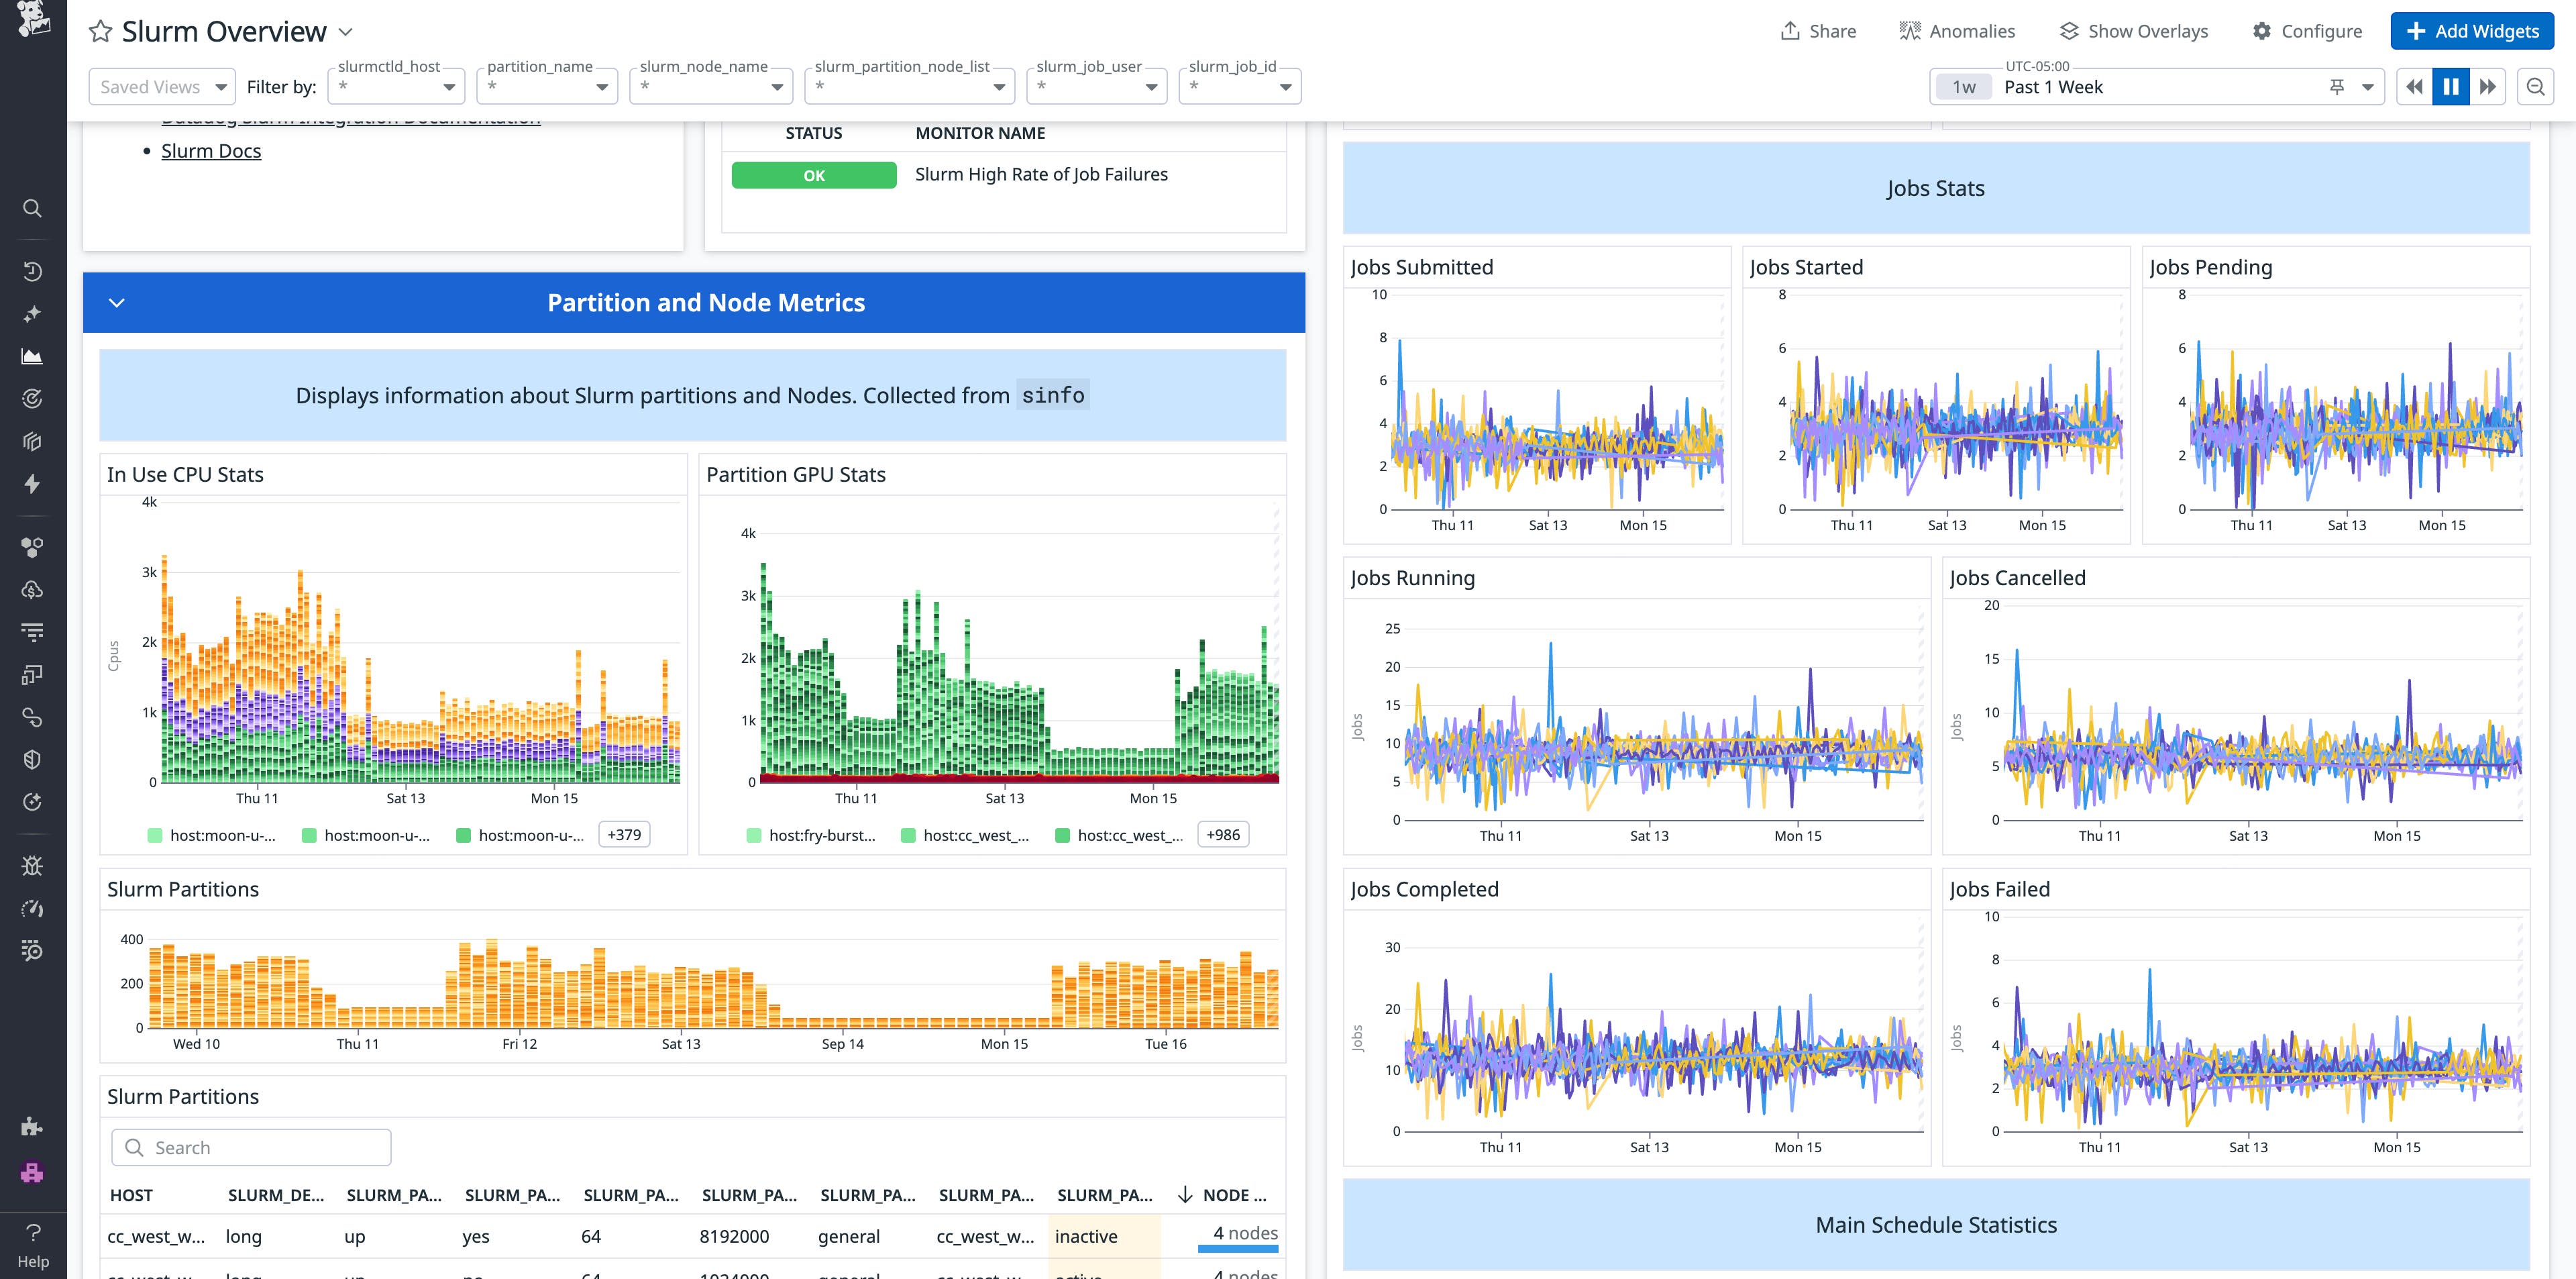
The Slurm integration provides an out-of-the-box dashboard that enables you to review and analyze the details of any HPC job activity that uses the Slurm scheduler, including jobs running in AWS PCS.

For example, let’s say you’re an HPC engineer and receive an alert stating that jobs are remaining stuck in the queue for too long. Navigating to the Datadog app, you open the Slurm Overview dashboard to review the number of jobs pending and their respective lengths. Because these jobs only require a short wall time, you know that the Slurm scheduler will prioritize them over jobs that request a longer wall time. You also open the AWS Parallel Computing Service dashboard so you can compare the number of Amazon EC2 instances being used to run jobs in your cluster with the total number of instances available in the compute node. You discover that all available instances are being used, which explains why AWS PCS is unable to schedule the jobs efficiently. You pivot to the AWS PCS console to update the maximum instance count for scaling from 6 to 8, which rectifies the issue and results in jobs processing efficiently once again.
If you also want the ability to correlate HPC workload performance with related infrastructure components, you can install the following Datadog integrations:
- Amazon EC2 integration, which provides visibility into your specialized HPC instances
- Storage system integrations, including Amazon FSx for Lustre, Amazon S3, and Amazon Elastic File System (EFS)
- NVIDIA GPU integrations, including the NVIDIA DCGM Exporter, NVIDIA Jetson, NVIDIA NIM, NVIDIA Triton, and NVIDIA NVML
Unifying this telemetry in Datadog helps you determine the root cause of a performance issue quickly, like whether slow job completion times are tied to storage throughput, GPU saturation, or scheduling delays.
Start monitoring AWS PCS with Datadog today
Monitoring AWS PCS with Datadog enables you to measure cluster and compute node performance in real time and perform historical analysis. Using it in conjunction with the Slurm and other Datadog integrations helps you ensure that all HPC workloads are consistently, cost-effectively delivering results, whether they’re running in AWS, a hybrid, or a burst environment.
To learn more, visit the AWS PCS documentation. New to Datadog and don’t already have an account? Sign up for a 14-day free trial today.


