Alex Cuoci

Jordan Obey
Serverless applications streamline development by allowing you to focus on writing and deploying code rather than managing and provisioning infrastructure. To help you monitor the performance of your serverless applications, last year we released distributed tracing for AWS Lambda to provide comprehensive visibility across your serverless applications. Now, in addition to Python and Node.js, real-time distributed tracing is available for Lambda functions written in Go and Java using the Datadog Tracer. Whether you’ve integrated serverless functions into your existing Java or Go applications or are running a fully serverless application, Datadog APM and Distributed Tracing enable you to easily trace requests as they propagate across your containers, hosts, and functions. This means you can get key insights into the health and performance of your serverless Go and Java resources alongside the rest of your environment.
Trace Go and Java requests across any type of infrastructure
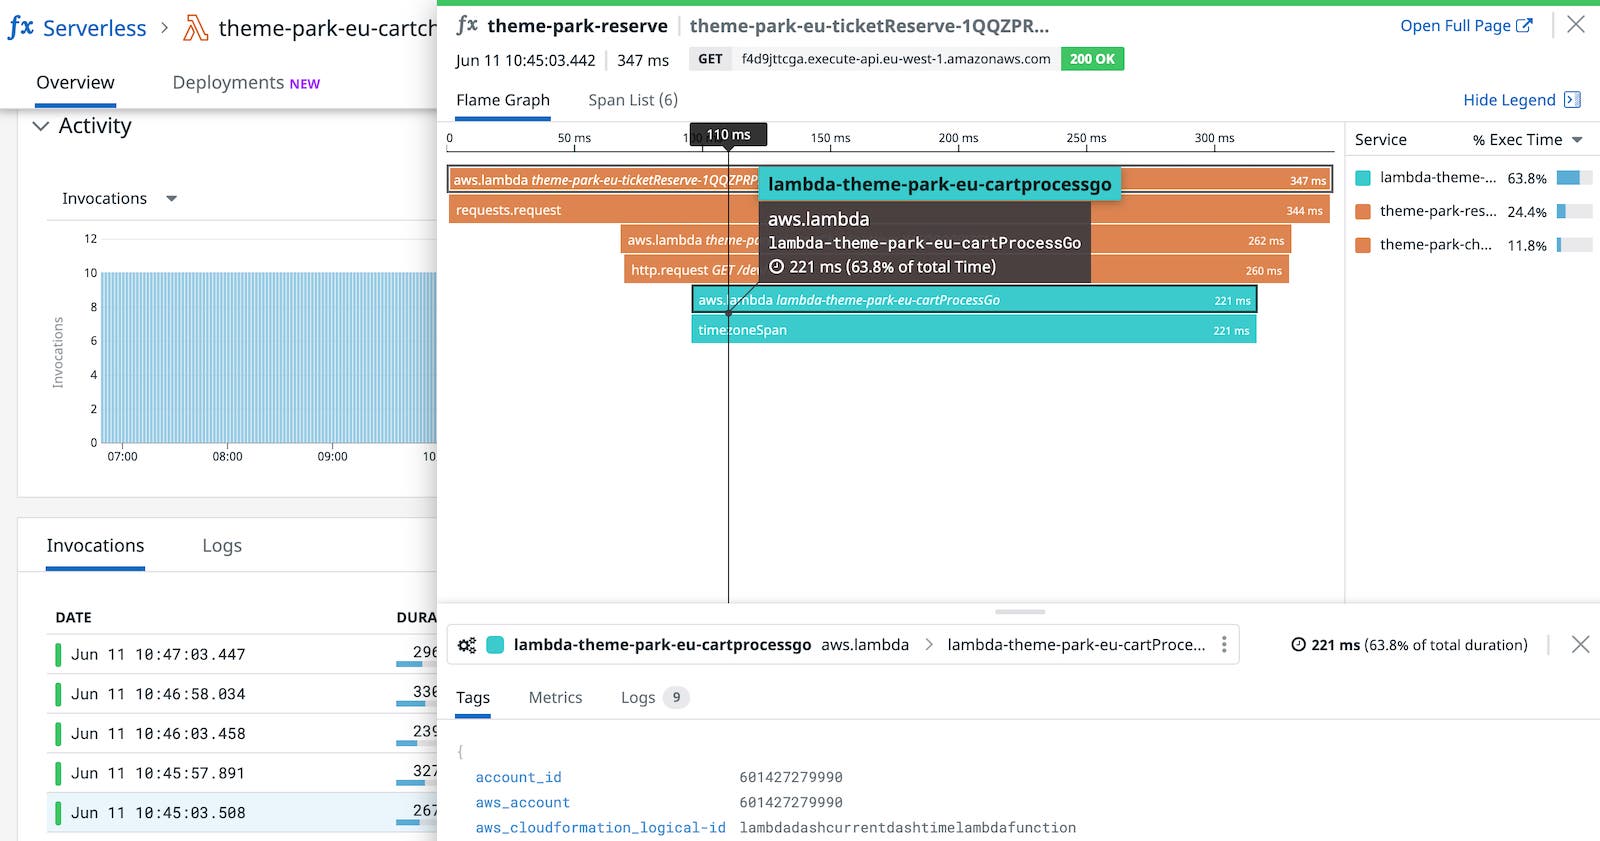
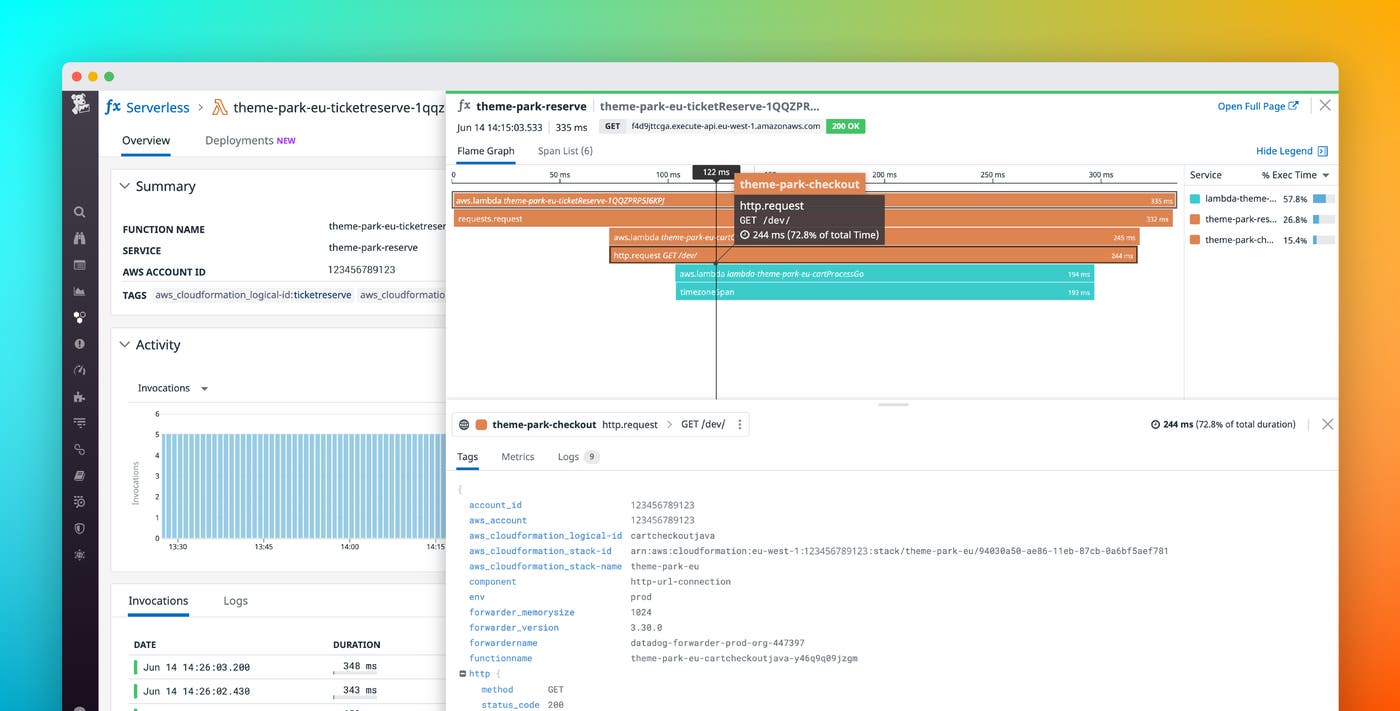
Datadog APM automatically captures requests across all of your environment’s components and displays them as a single trace. This provides you with an end-to-end view of your applications’ performance, whether they run on AWS Lambda functions, containers, on-prem hosts, or a combination. For example, if your Go or Java Lambda functions are invoked by a service running on an EC2 instance, you can trace those requests as they traverse across both services to spot pain points without any code or configuration changes.
Spot code-level problems in your functions
Tracing your Go and Java Lambda functions enables you to easily find code-level issues that are causing problems with your serverless applications. This can include things like poorly performing goroutines or syntax problems in your Java functions.
Inspect goroutine executions
Go is optimized for concurrency by design; it can run up to hundreds of thousands of lightweight goroutines concurrently with minimal overhead. If, however, goroutines aren’t executing as you expect (e.g., looping inefficiently) they can experience increased latency and overconsume resources like memory, which can lead to problems down the line depending on the AWS Lambda memory limits you have in place.
Once you’ve installed and set up the Datadog Go tracer, you can visualize your Go-based Lambda functions to look out for problems like unexpected pauses in goroutine executions and unusually slow garbage collection, each of which can degrade application performance.

Uncover performance issues in your Java Lambda functions
If you’re running a Java application on serverless, traces enable you to quickly tell whether your Java-based Lambda functions have performance issues. For example, after you install the Datadog Java tracer, you can look for errors on spans that point to code-level issues that need resolving such as uninitialized variables and missing return statements.
Detect cold starts automatically
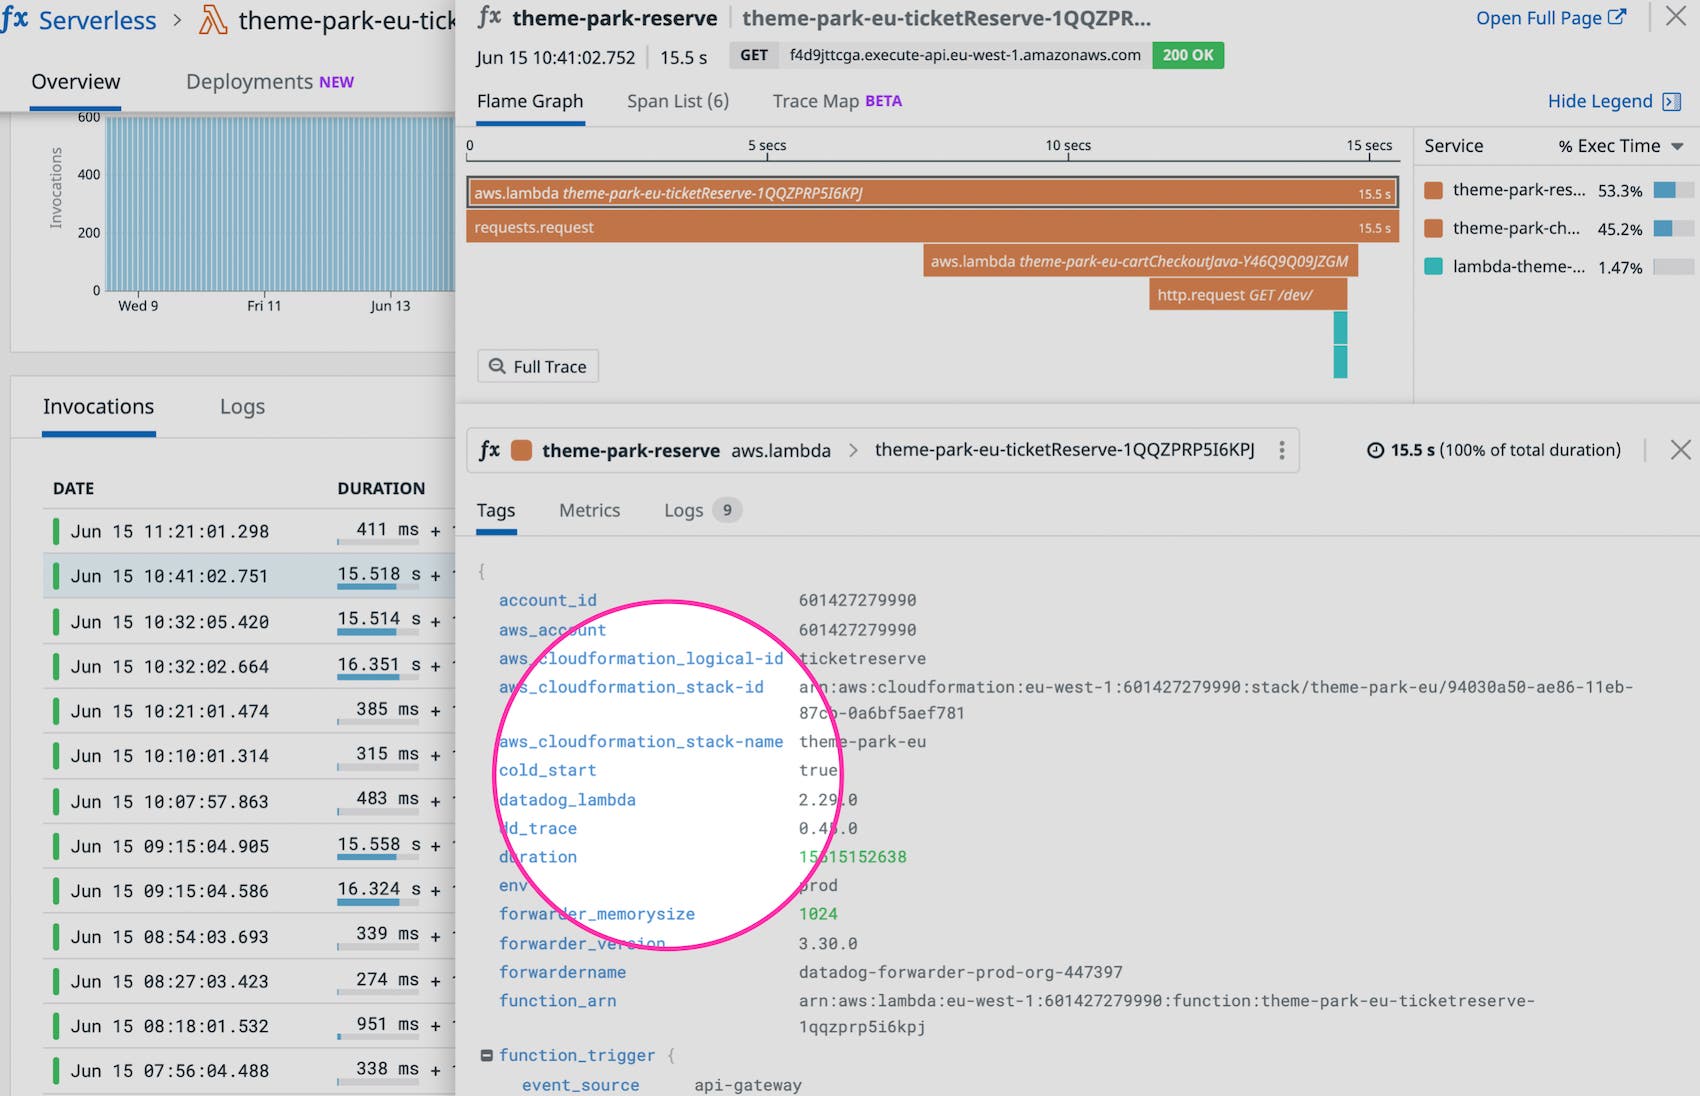
Lambda functions written in statically typed languages like Java and Go are commonly prone to cold starts. Datadog automatically tags slow request traces with a cold_start attribute, so you can easily search for traces with cold starts in the Serverless view and determine if you should take mitigating actions like enabling Provisioned Concurrency.

Start tracing your Go and Java Lambda functions today
With support for Go and Java Lambda functions, Datadog APM helps you gain real-time visibility into the performance of your serverless applications. Datadog’s Java and Go tracers have dozens of out-of-the-box integrations, which will automatically instrument calls made using supported libraries without any required code changes. You can find a full list of supported tracer integrations for Go here, and for Java here.
If you are not already using Datadog to monitor application performance, get started today with a 14-day free trial.


