Thomas Sobolik
Technical Content Writer

John Kendall
AWS Fargate is a serverless compute engine that allows you to deploy containerized applications on services like Amazon ECS without needing to provision or manage compute resources. Now, Datadog is proud to be a launch partner with Amazon for their support of AWS Fargate workloads running on Graviton2, Amazon’s proprietary ARM64 processor. In this post, we'll look at how you can use the Datadog Agent and our AWS integration to monitor the health and performance of your Graviton2-powered serverless workloads alongside the rest of your environment.
Ingest metrics into Datadog
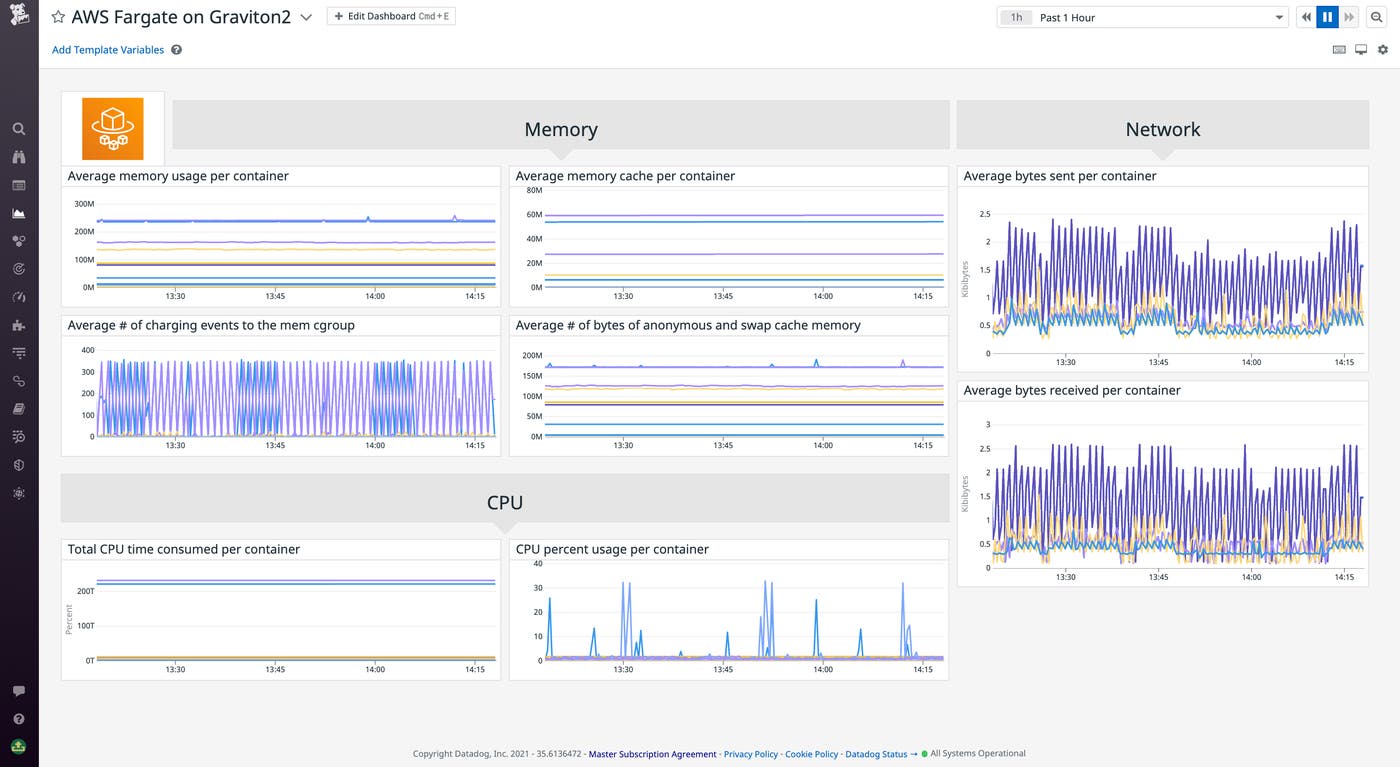
Once enabled, Datadog’s AWS integration automatically ingests Fargate metrics from your Graviton2-powered deployments via Amazon CloudWatch. For a quick birds-eye view of your deployment’s health, you can use our out-of-the-box AWS Fargate dashboard. The dashboard shows key resource and network metrics from your serverless containers, including CPU and memory usage, disk I/O, network traffic volume and errors, and more. This enables you to observe how your workloads are performing at a high level.

Additionally, the Datadog Agent natively supports ARM-based architectures, including AWS Graviton2 processors, so you can deploy the containerized Agent image in your ECS tasks to get more granular metrics. For more information on configuring the Agent image and adding it to your ECS tasks, see our documentation.
Once you've deployed the Datadog Agent to your tasks, you can use the Container Map and Live Containers view to get a closer look at how your containers are performing.
Map your Graviton2-powered Fargate tasks
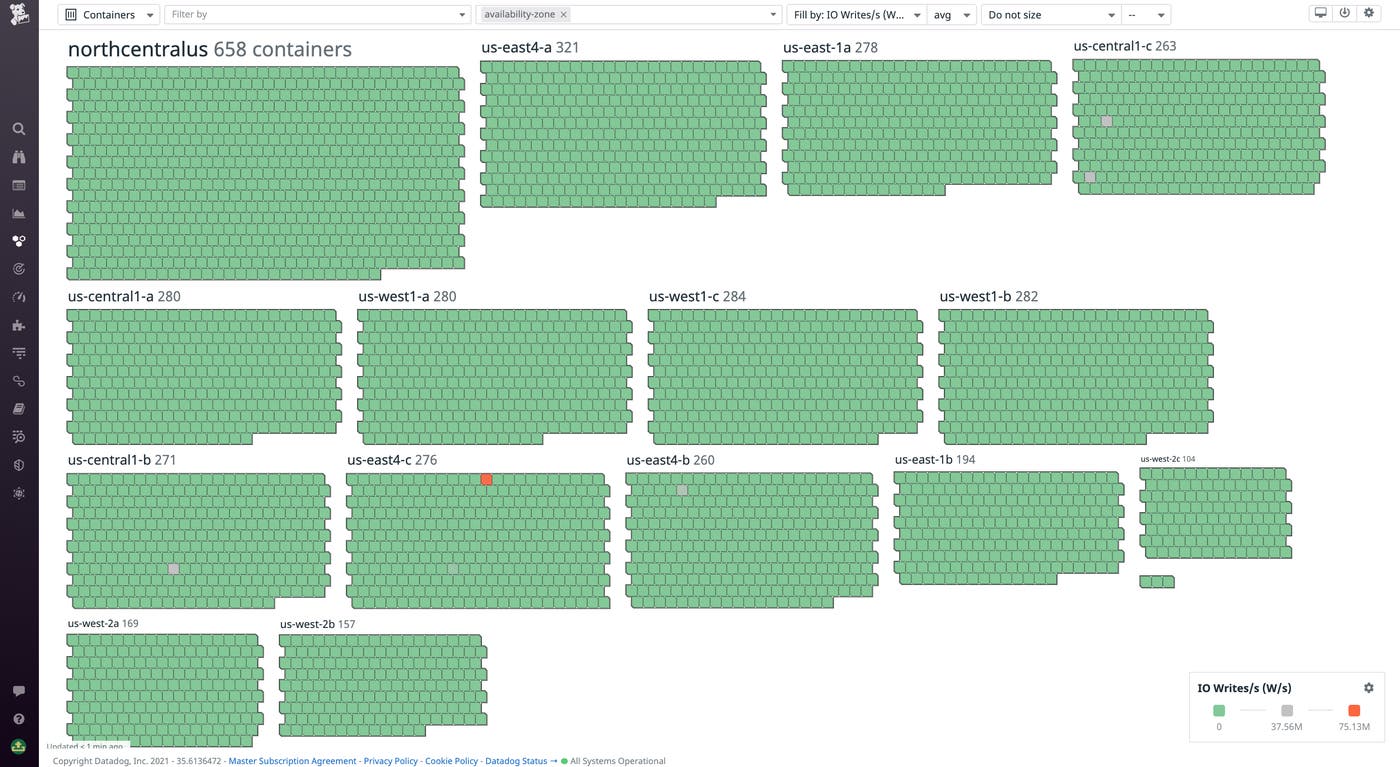
The Container Map automatically detects and visualizes your containers on the fly and enables you to group, filter, and inspect your containers using tags—such as service, availability zone, task, or task family. For example, you could filter to a service you’re migrating to Graviton2, and then group by task to compare container resource metrics for your x86 and Graviton2 deployments. This can help you determine if Graviton2 is more optimal for your workloads. If you identify a container you want to investigate further, you can jump directly to its host dashboard for metrics—or pivot to the Live Containers view.

Get real-time visibility into your containers
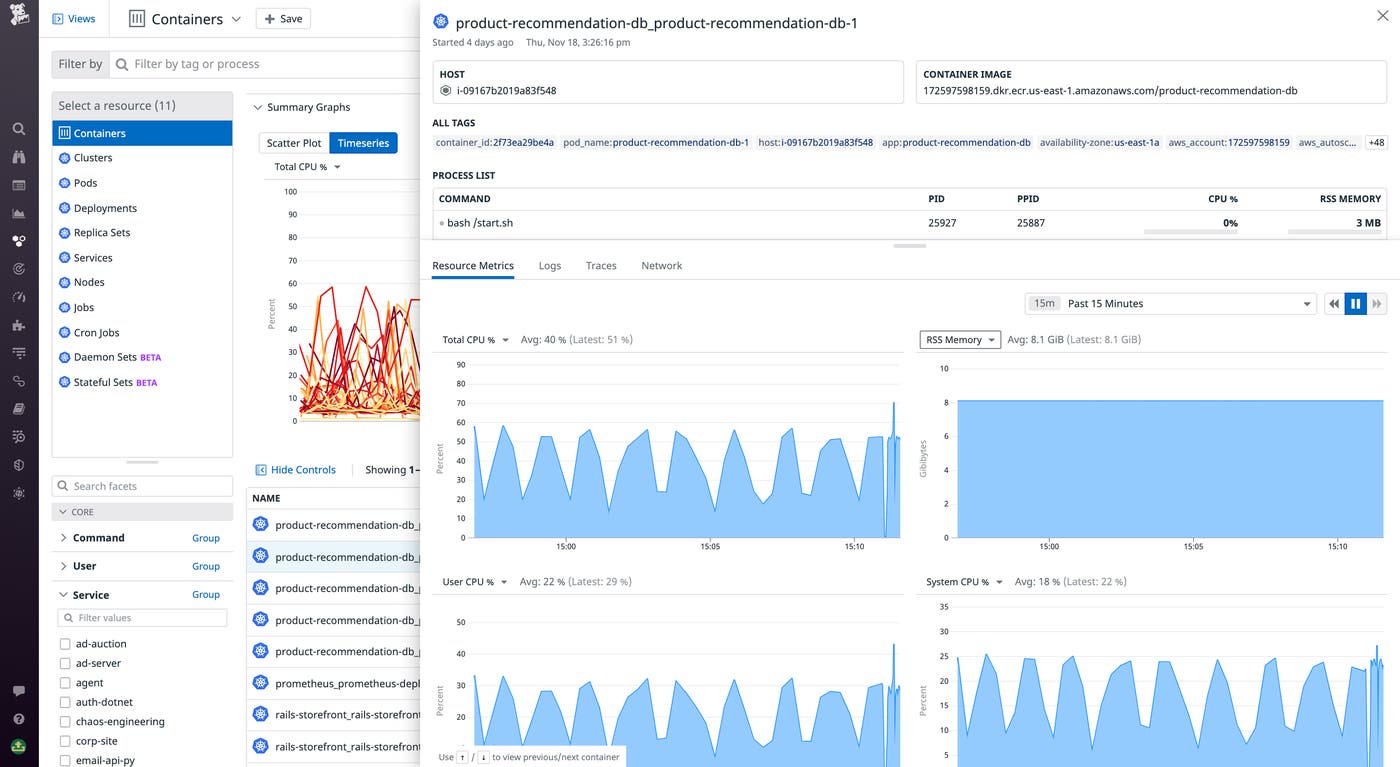
The Live Containers view presents granular container metrics—including CPU, memory usage, and sent and received bytes—updated every three seconds. Just like in the Container Map, you can filter your containers by tagged metadata, so you can home in on the containers you care about. You can also sort your containers using metadata, for example to easily see workloads running close to their CPU limits or containers that have gone offline.
Clicking on a container reveals the sidepanel, where you can view a list of active processes running on the container alongside relevant logs, traces, and network metrics. With this additional context for each of your containers, you can begin to identify and investigate issues, such as CPU or memory overconsumption, code errors, or network latency.

Start monitoring Fargate on Graviton2
With Datadog’s native support for Fargate on Graviton2, you can now easily leverage Datadog visualizations, alerts, and more to monitor the health and performance of all of your containerized applications, no matter how you deploy them. For more information on collecting Fargate and ECS monitoring data in Datadog, see our documentation. Or, if you’re brand new to Datadog, get started with a 14-day free trial.

