Alexis Lê-Quôc
CPU steal is a fundamental property of virtual environments. Virtualization offers the ability to over-subscribe compute between multiple instances because not all instances need CPU at the same time. This results in lower compute costs for AWS but may lead to inconsistent performance for the user.
Since the price per instance type is generally the same in a given region, through the use of hypervisors, AWS ensures that all virtual machines get a fair share of access to the underlying hardware. When a hypervisor has to juggle among a large number of virtual machines, the overhead of virtualization becomes higher and scheduling fairness (how often the hypervisor will run a particular instance) can get in the way of optimally sharing resources. This is what’s known as “CPU Steal” or “Stolen CPU”. In the step-by-step explanation below, we will show you how to detect when CPU Steal is occurring in your AWS instances using Datadog.
How to detect AWS CPU steal With Datadog
To detect CPU steal you need to track the system metric “system.cpu.stolen.” To see CPU steal in AWS with Datadog, sign up for a free trial account, enable the AWS integration and install the Datadog Agent on your instance.
The system.cpu.stolen metric measures the percentage of cycles that were reclaimed by the hypervisor because the instance has reached the capacity of some underlying quota or hardware limitation. By analyzing system.cpu.stolen over time and comparing it to the CPU idle metric (system.cpu.idle), you can determine if stolen CPU is a result of the hypervisor enforcing a quota or because other tenants on the same hardware are requesting more cycles than are available. More information on how this occurs is available in our Understanding AWS stolen CPU and how it affects your apps blog post
To see system.cpu.stolen and system.cpu.idle in Datadog, go to the metrics explorer by hovering over the “Metrics” tab and selecting “Explorer” from the dropdown menu.

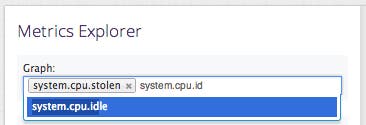
On the left of the Metrics Explorer screen, begin typing “system.cpu.stolen” in the “Graph:” text box and select it from the dropdown options. Do the same for “system.cpu.idle”.

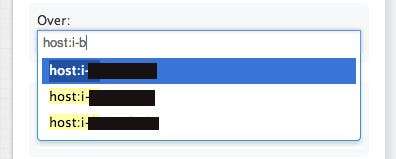
By default the Metrics Explorer will track all the hosts you’re monitoring with Datadog. To track a specific host, enter the hostname in the “Over:” text box.

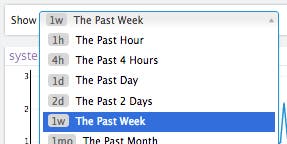
Finally, select the time period to analyze. For this example, we will look at the past week.

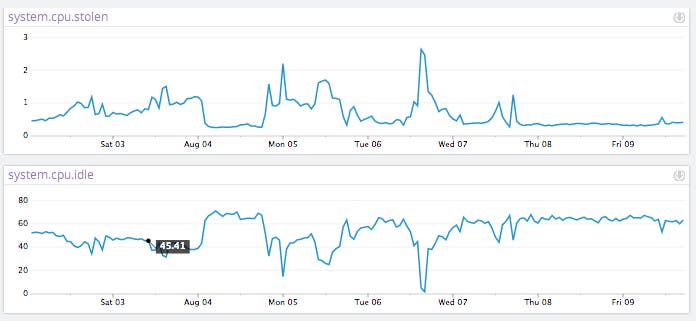
CPU Steal typically increases as CPU Idle approaches zero. High variations in the amount of CPU steal you see for different occurrences of CPU idle going to zero can be an indication that your application’s performance is being adversely affected by other tenants on the same hardware who are also requesting cycles at the same time.

Getting this visibility into your AWS CPU utilization should take just a few minutes after signing up for Datadog.


