Patrick Krieger

David Pointeau

Bo Huang
Managing the cost of foundation models is a critical challenge as AI adoption surges, particularly for teams using powerful models like Anthropic’s Claude Opus and Claude Sonnet. Growing teams generate larger prompt volumes and escalating model complexity, making it difficult to have clear visibility, accountability, and control of cloud AI spending. Cost data typically lives in financial tooling that’s disconnected from application and infrastructure workflows, which acts as a further barrier for engineers to correlate spend allocation, investigations, and real-time optimizations.
Our native integration with Anthropic and LLM Observability lets you monitor, troubleshoot, and secure your Anthropic LLM applications. Now, Datadog Cloud Cost Management (CCM) integrates with the Anthropic Usage and Cost Admin API, which is releasing in tandem with our integration, enabling you to ingest Claude usage and cost data directly into your existing dashboards, reports, and monitors. With CCM, organizations can understand the total cost of their services—including cloud, SaaS, and now Claude—so they can allocate every dollar, empower engineers to manage spend, and optimize usage with confidence.
In this post, we’ll show you how to:
- Break down usage and cost by model, workspace, and team
- Allocate Claude spend with tags and service ownership
- Monitor and alert on cost anomalies
- Understand Claude usage alongside total service cost
Break down Claude usage and cost by model, workspace, and team
Tracking usage becomes difficult when teams increasingly integrate LLMs into their systems, as raw data is often inconsistent, complex, and lacks a unified schema. This fragmented data limits analysis, inhibits cost governance, and weakens automated monitors or reports.
In Datadog, Claude usage and cost data is normalized using the FinOps Foundation’s FOCUS format and becomes immediately available in CCM dashboards, reports, and monitors. This lets you answer key questions: Which models or workspaces are generating the most cost? Are workloads using the right service tier (Standard, Batch, or Priority)? Are teams effectively using caching or ephemeral sessions? What’s the cost breakdown between Claude Opus and Claude Sonnet?
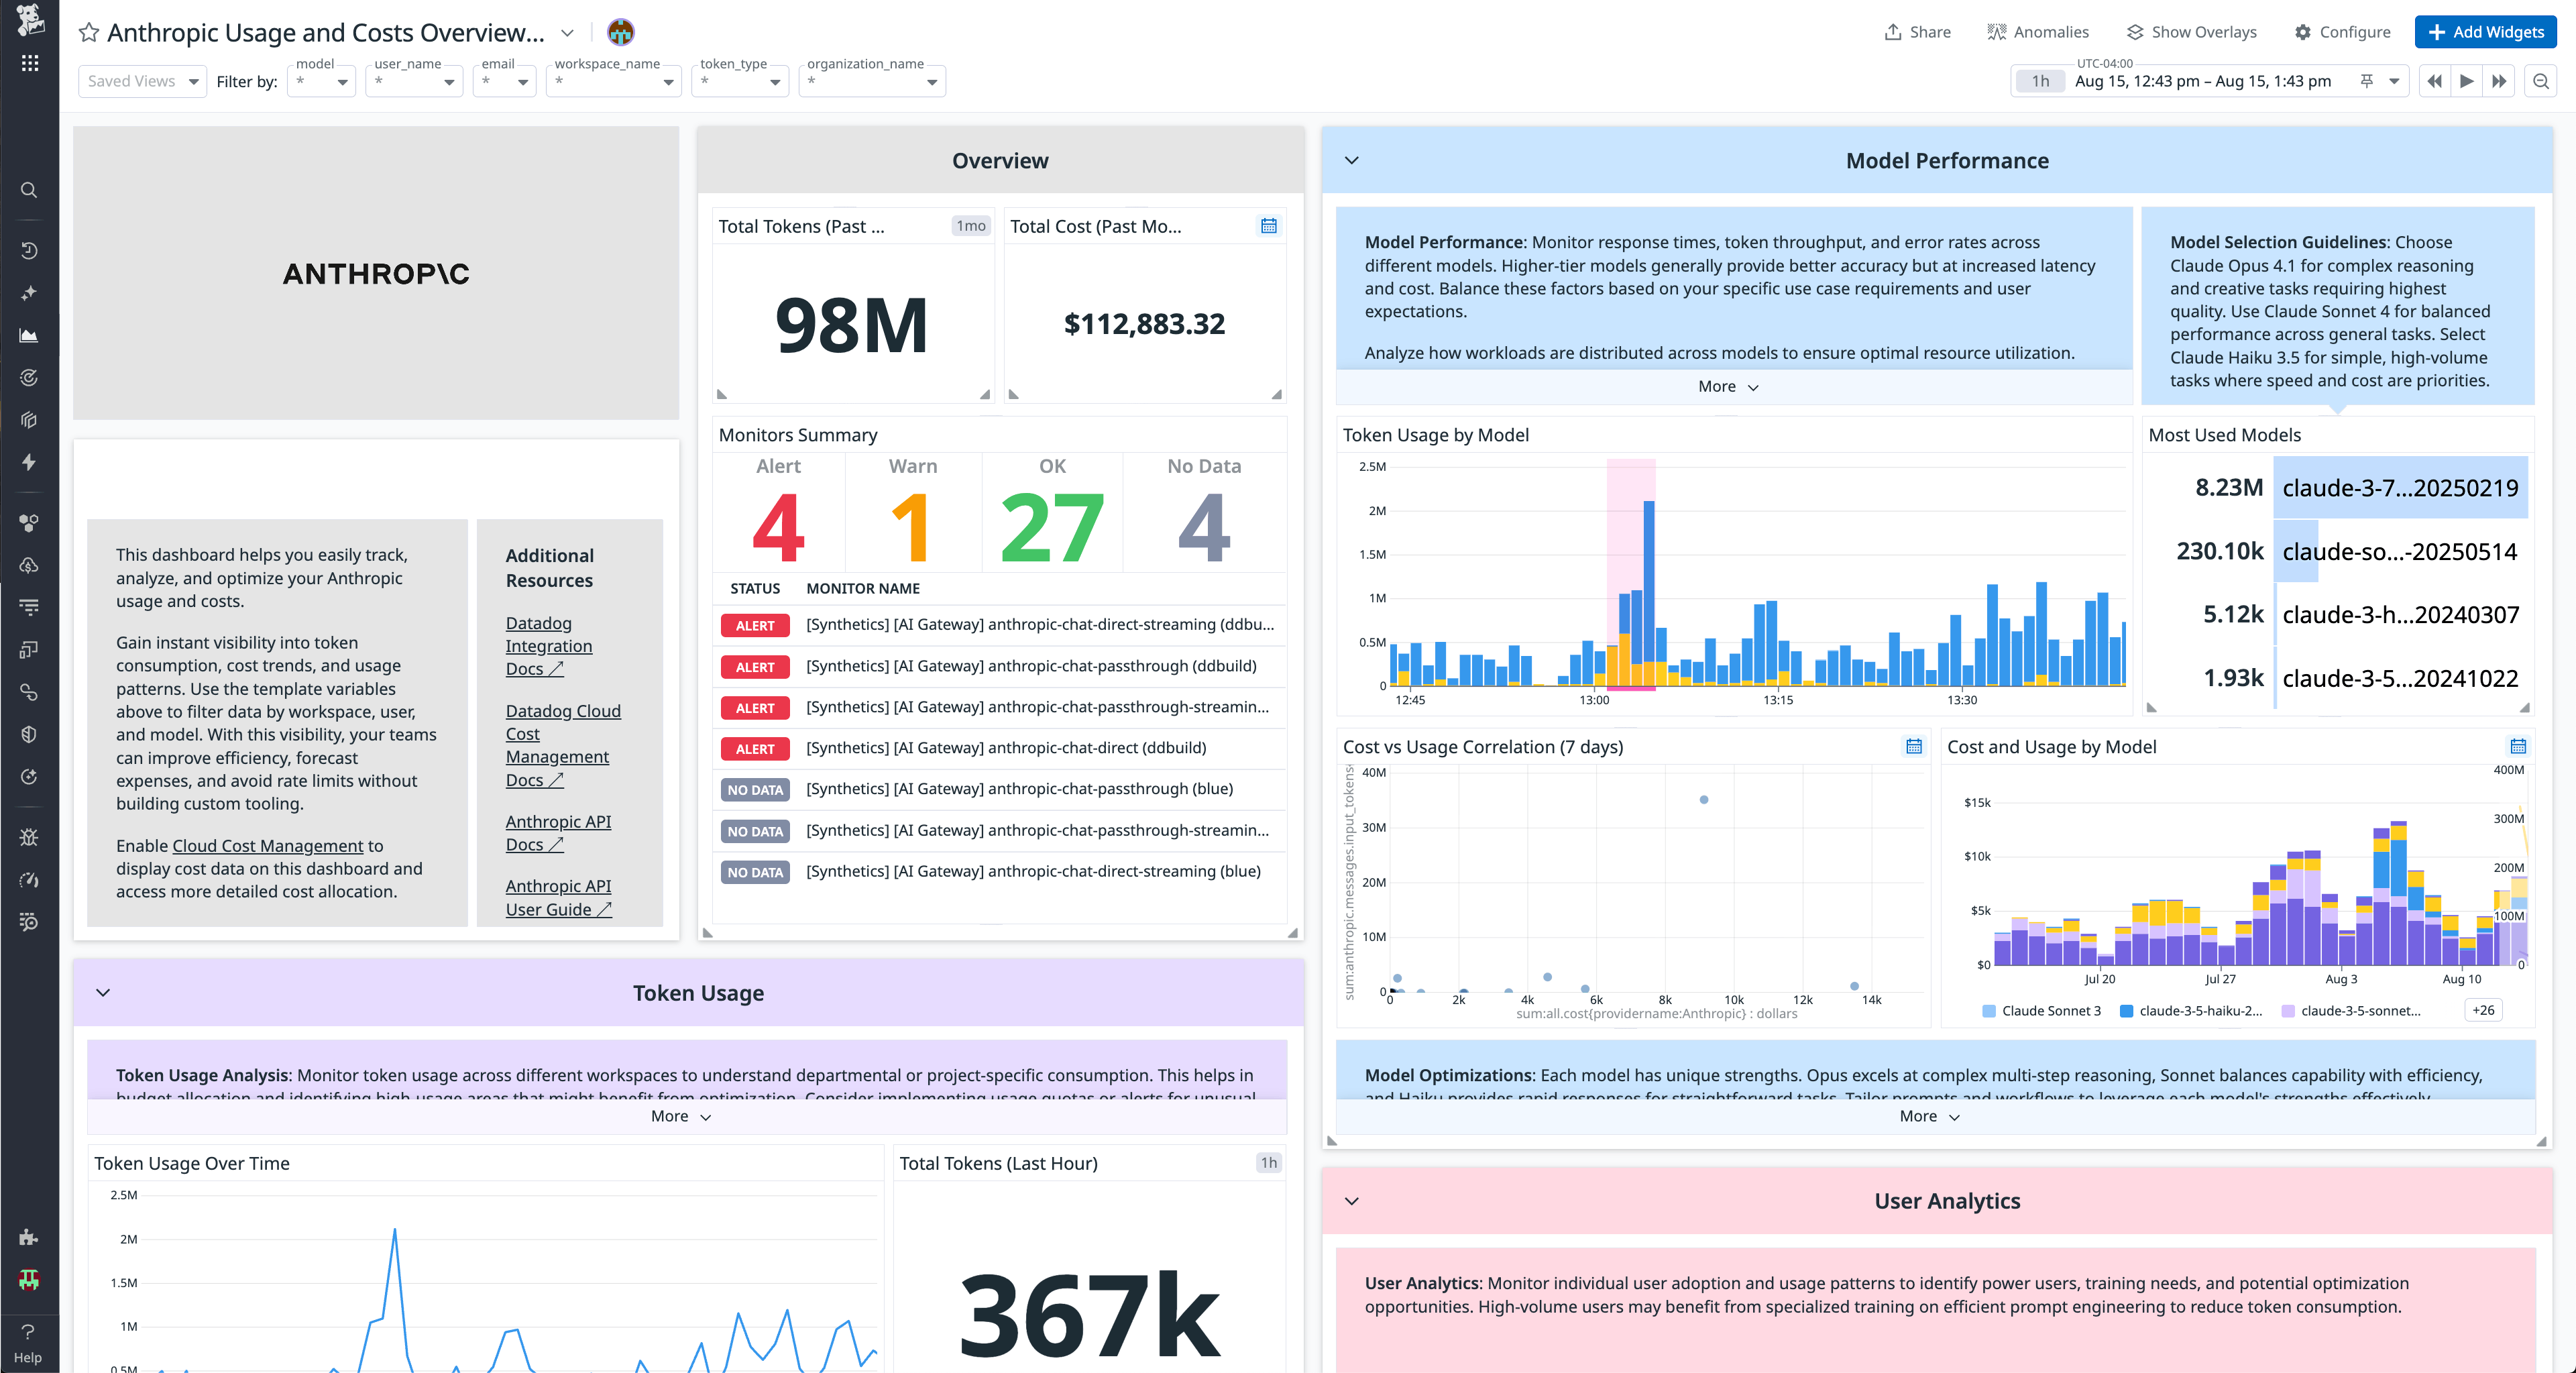
The integration surfaces granular usage data grouped by model, workspace, API key, and service tier. This includes:
- Input and output token counts per model (e.g., Claude Opus 4, Claude Sonnet 3.5)
- Service tier usage (Standard, Priority, Batch)
- Cache hit rates (ephemeral tokens, cache reads)
- Code execution and web search activity
This data is available out of the box in a prebuilt Anthropic dashboard, providing a daily view into usage and cost across your organization.
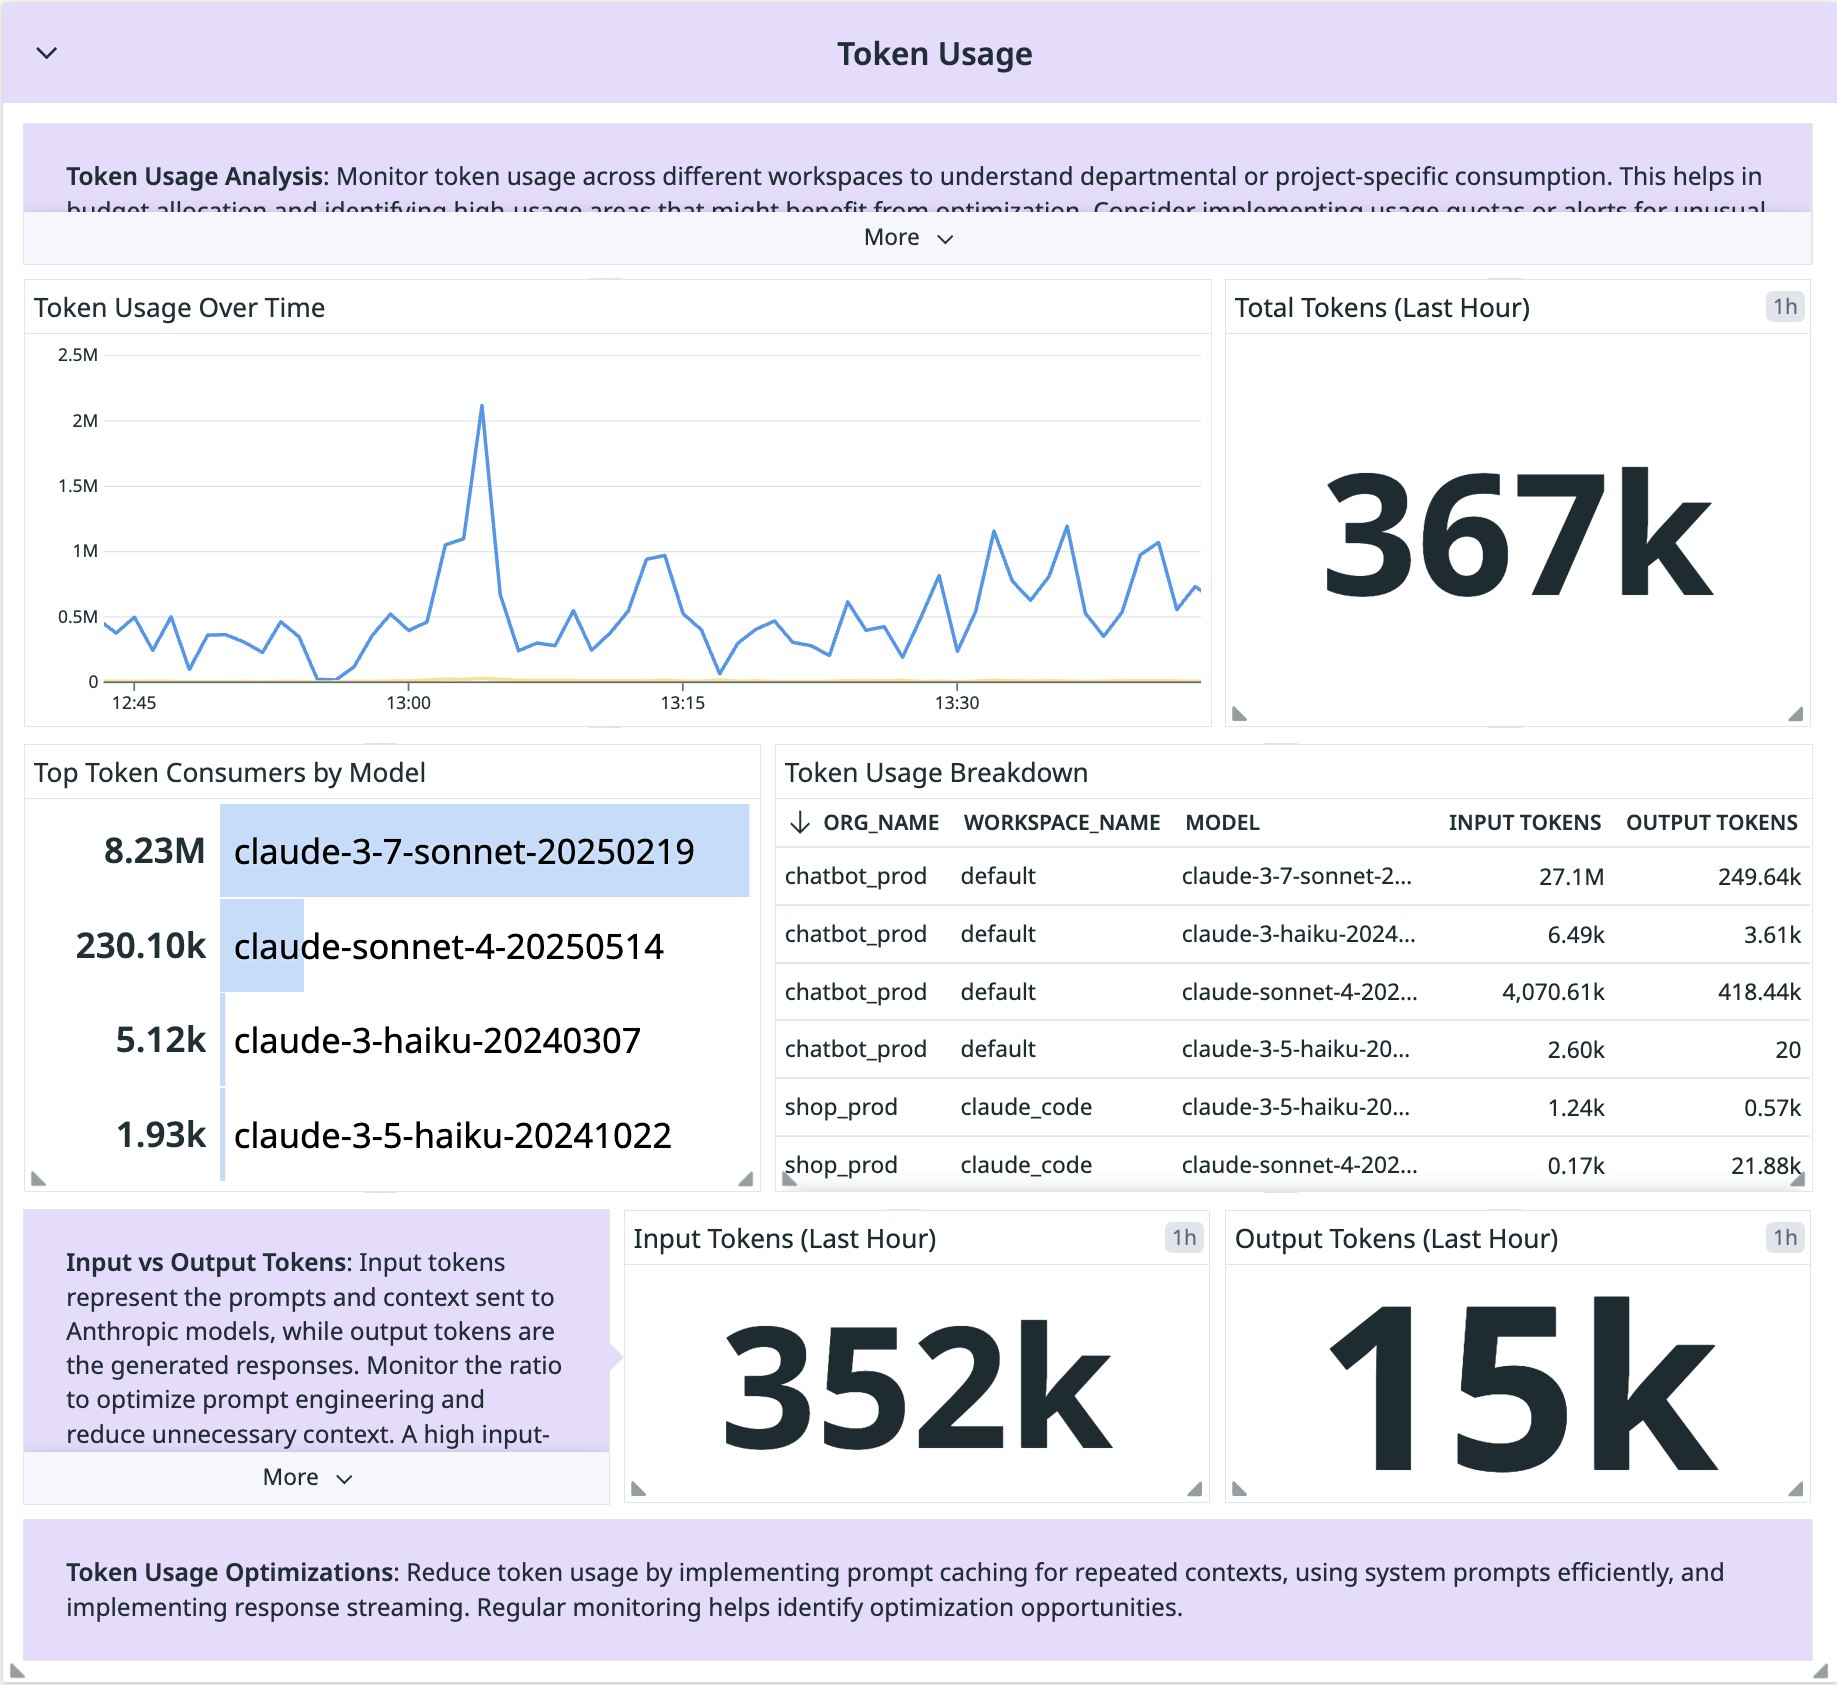
For instance, let’s say you’re interested in the token usage of a workspace so you can find ways to cut down on unnecessary spend. The Anthropic Usage and Costs dashboard highlights token usage over time, top token consumers by model, and specific token usage metrics to help you pinpoint the model, workspace, or service that could be optimized. By identifying peak usage periods and patterns, you can potentially implement request queuing during high-demand times, helping you to cut down on unnecessary costs. Going a step further, you can also set alerts on specific workspaces or models that you know experience increased usage during different hours.
Allocate Claude spend with tags and service ownership
With built-in support for FOCUS, CCM also automatically maps Claude costs to your organization’s tagging structure and service ownership. This allows you to group spend by workspace, API key, or team and allocate cost across multiple LLMs and service tiers. Further, you can attribute usage to specific services or products and incorporate AI usage into your unit economics.
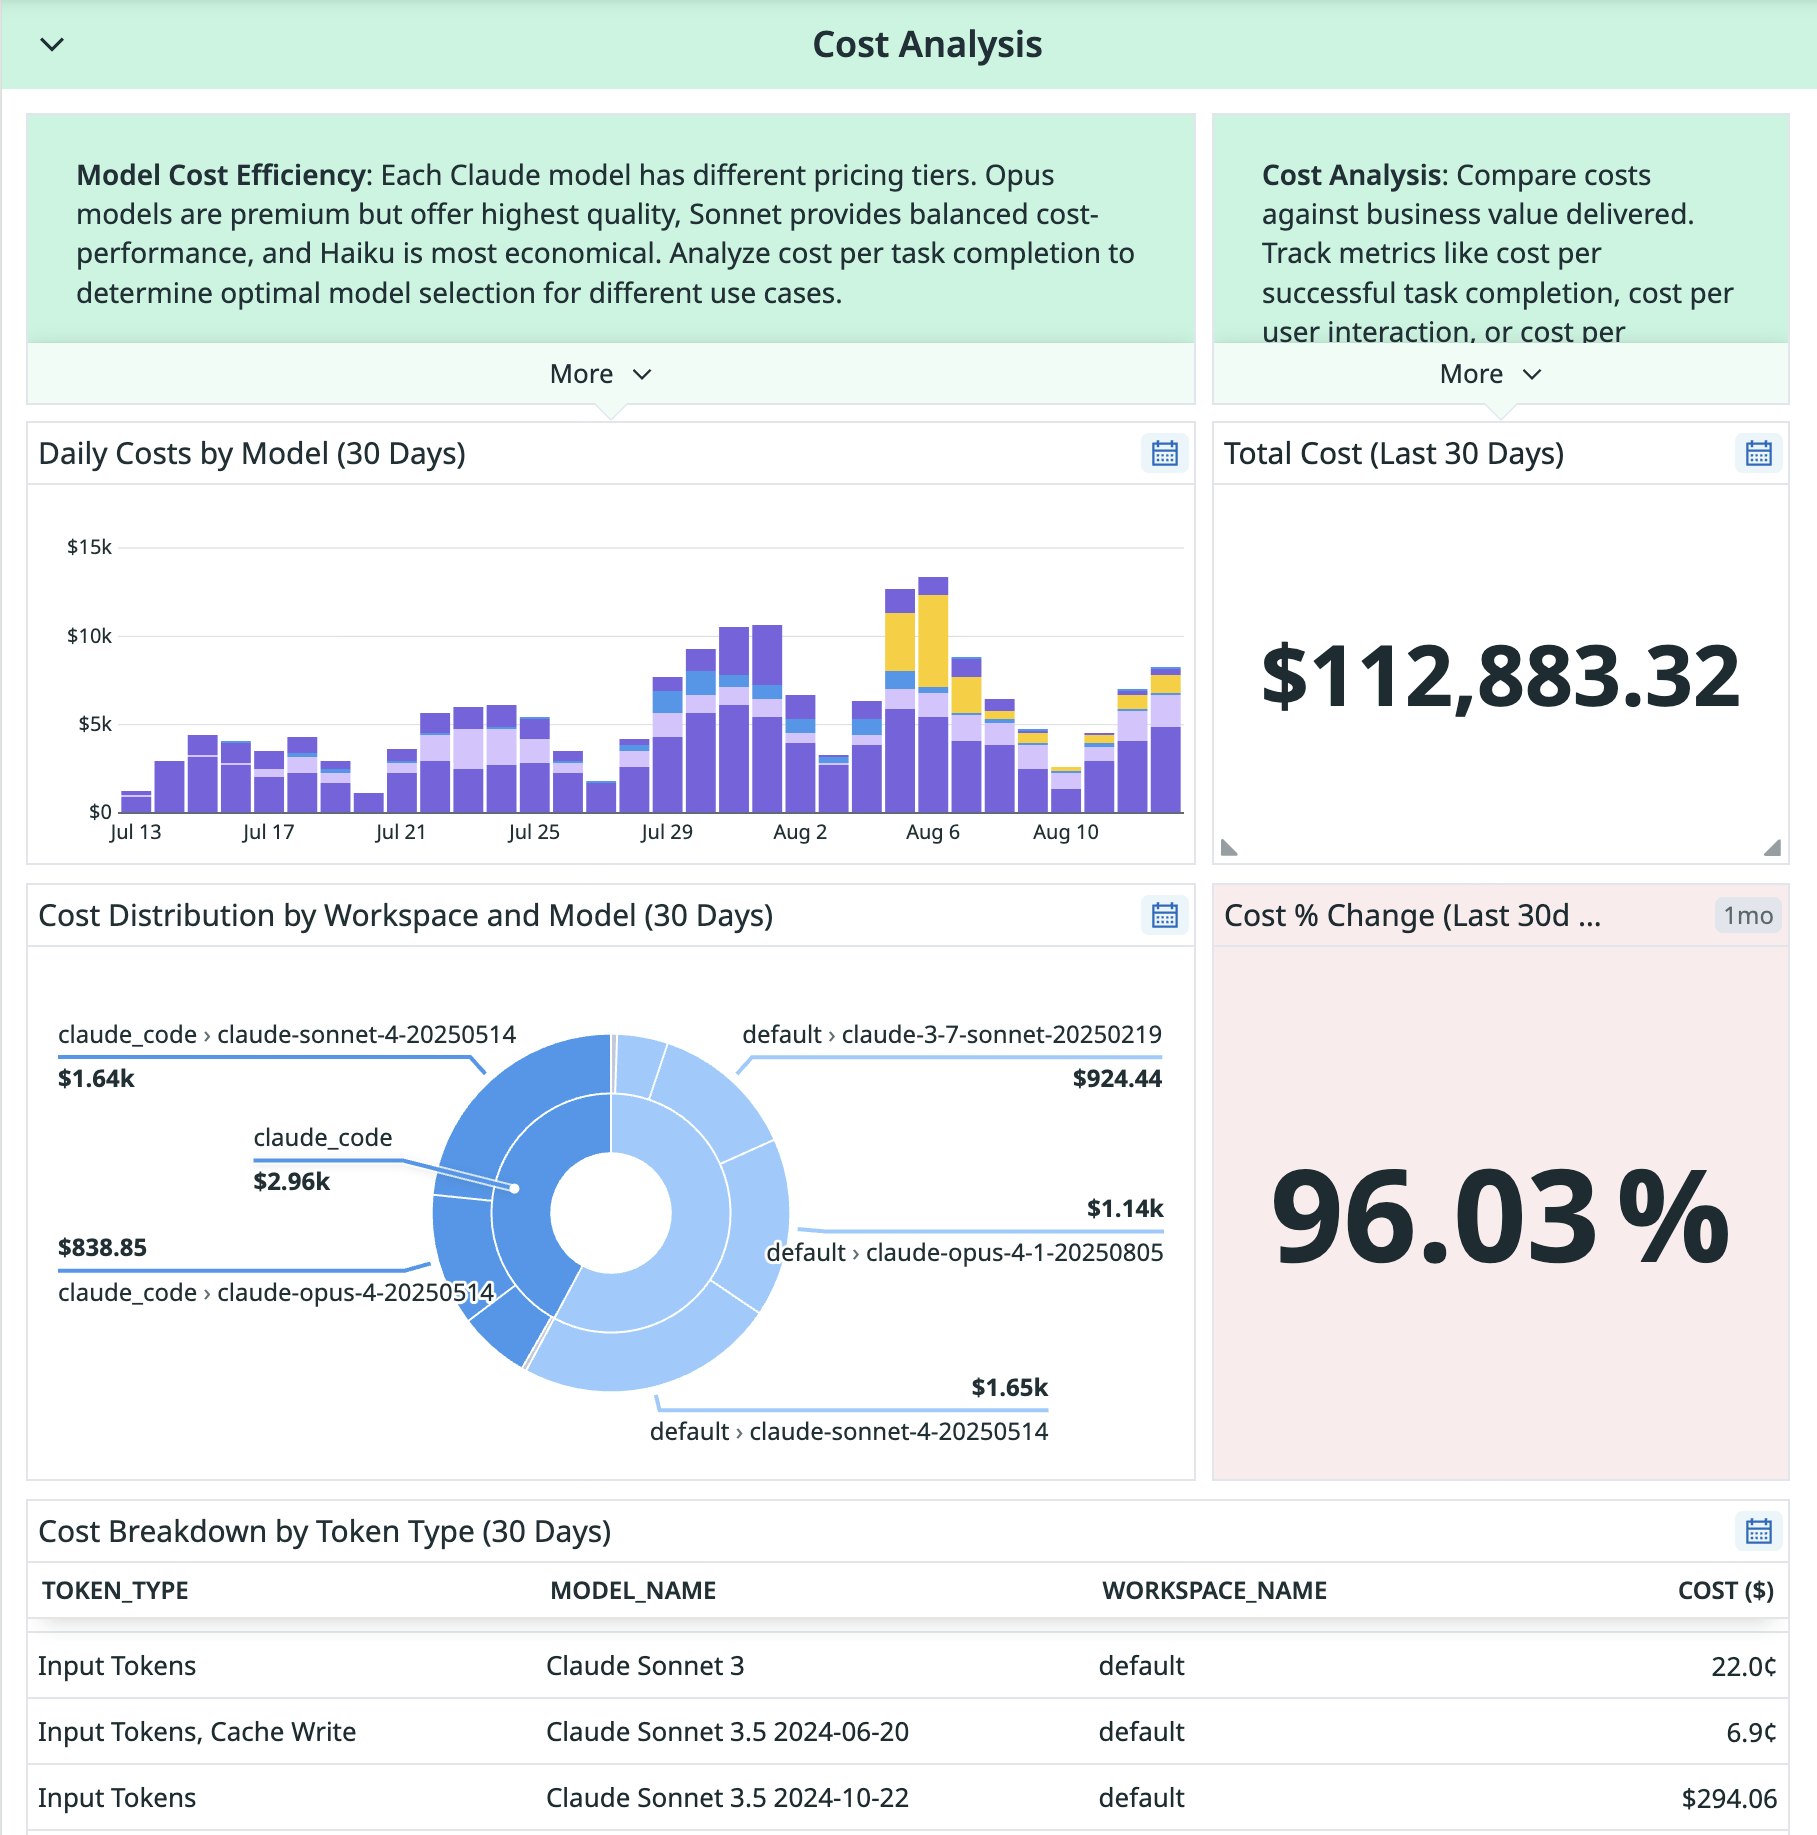
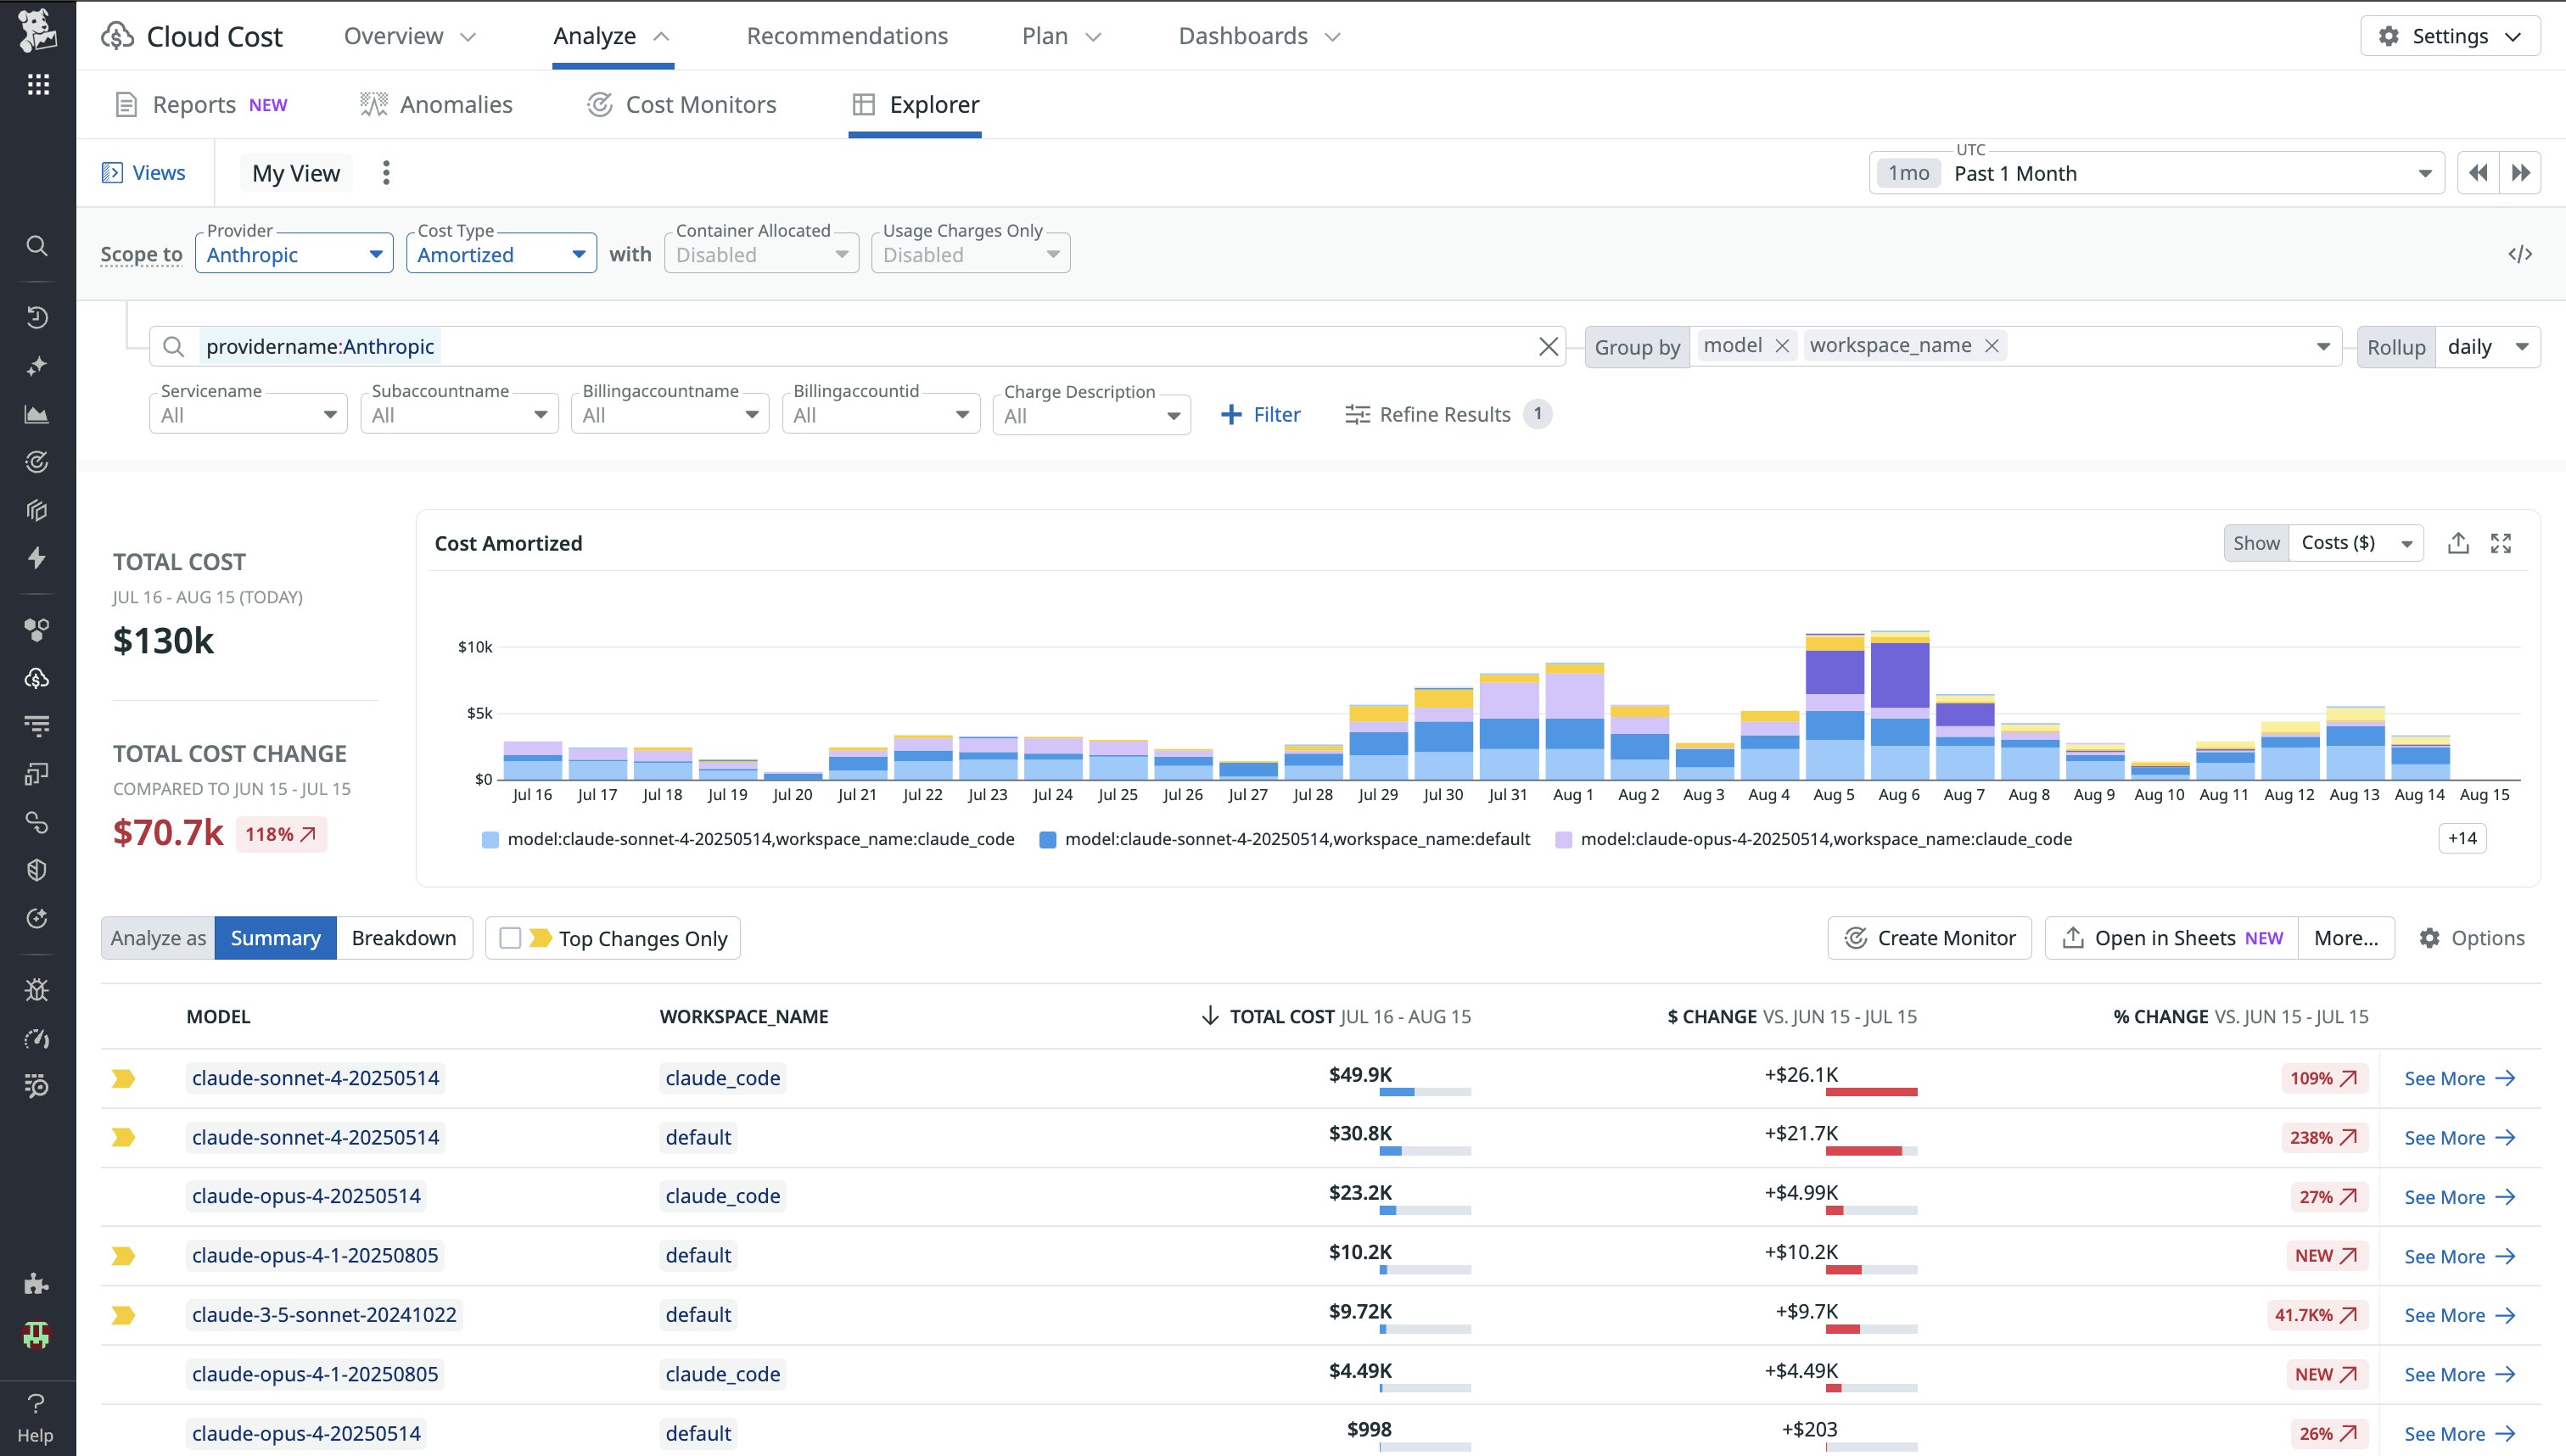
The CCM Explorer gives teams a summary of Claude costs by model, workspace, service, and other important tags. This view also includes the change in costs—both monetary and by percentage—over a period of time, helping you quickly scan the models or workspaces that have the largest recent cost changes.
Clicking into a specific summary, you get a more detailed look into the top cost changes of a particular model over time. You can also see the associated teams and tags of the model or workspace, letting you know who owns the service if you have any questions or concerns. From here, you can pivot to a notebook to investigate any anomalous cost changes further or set up a monitor to proactively alert on similar changes for the future.
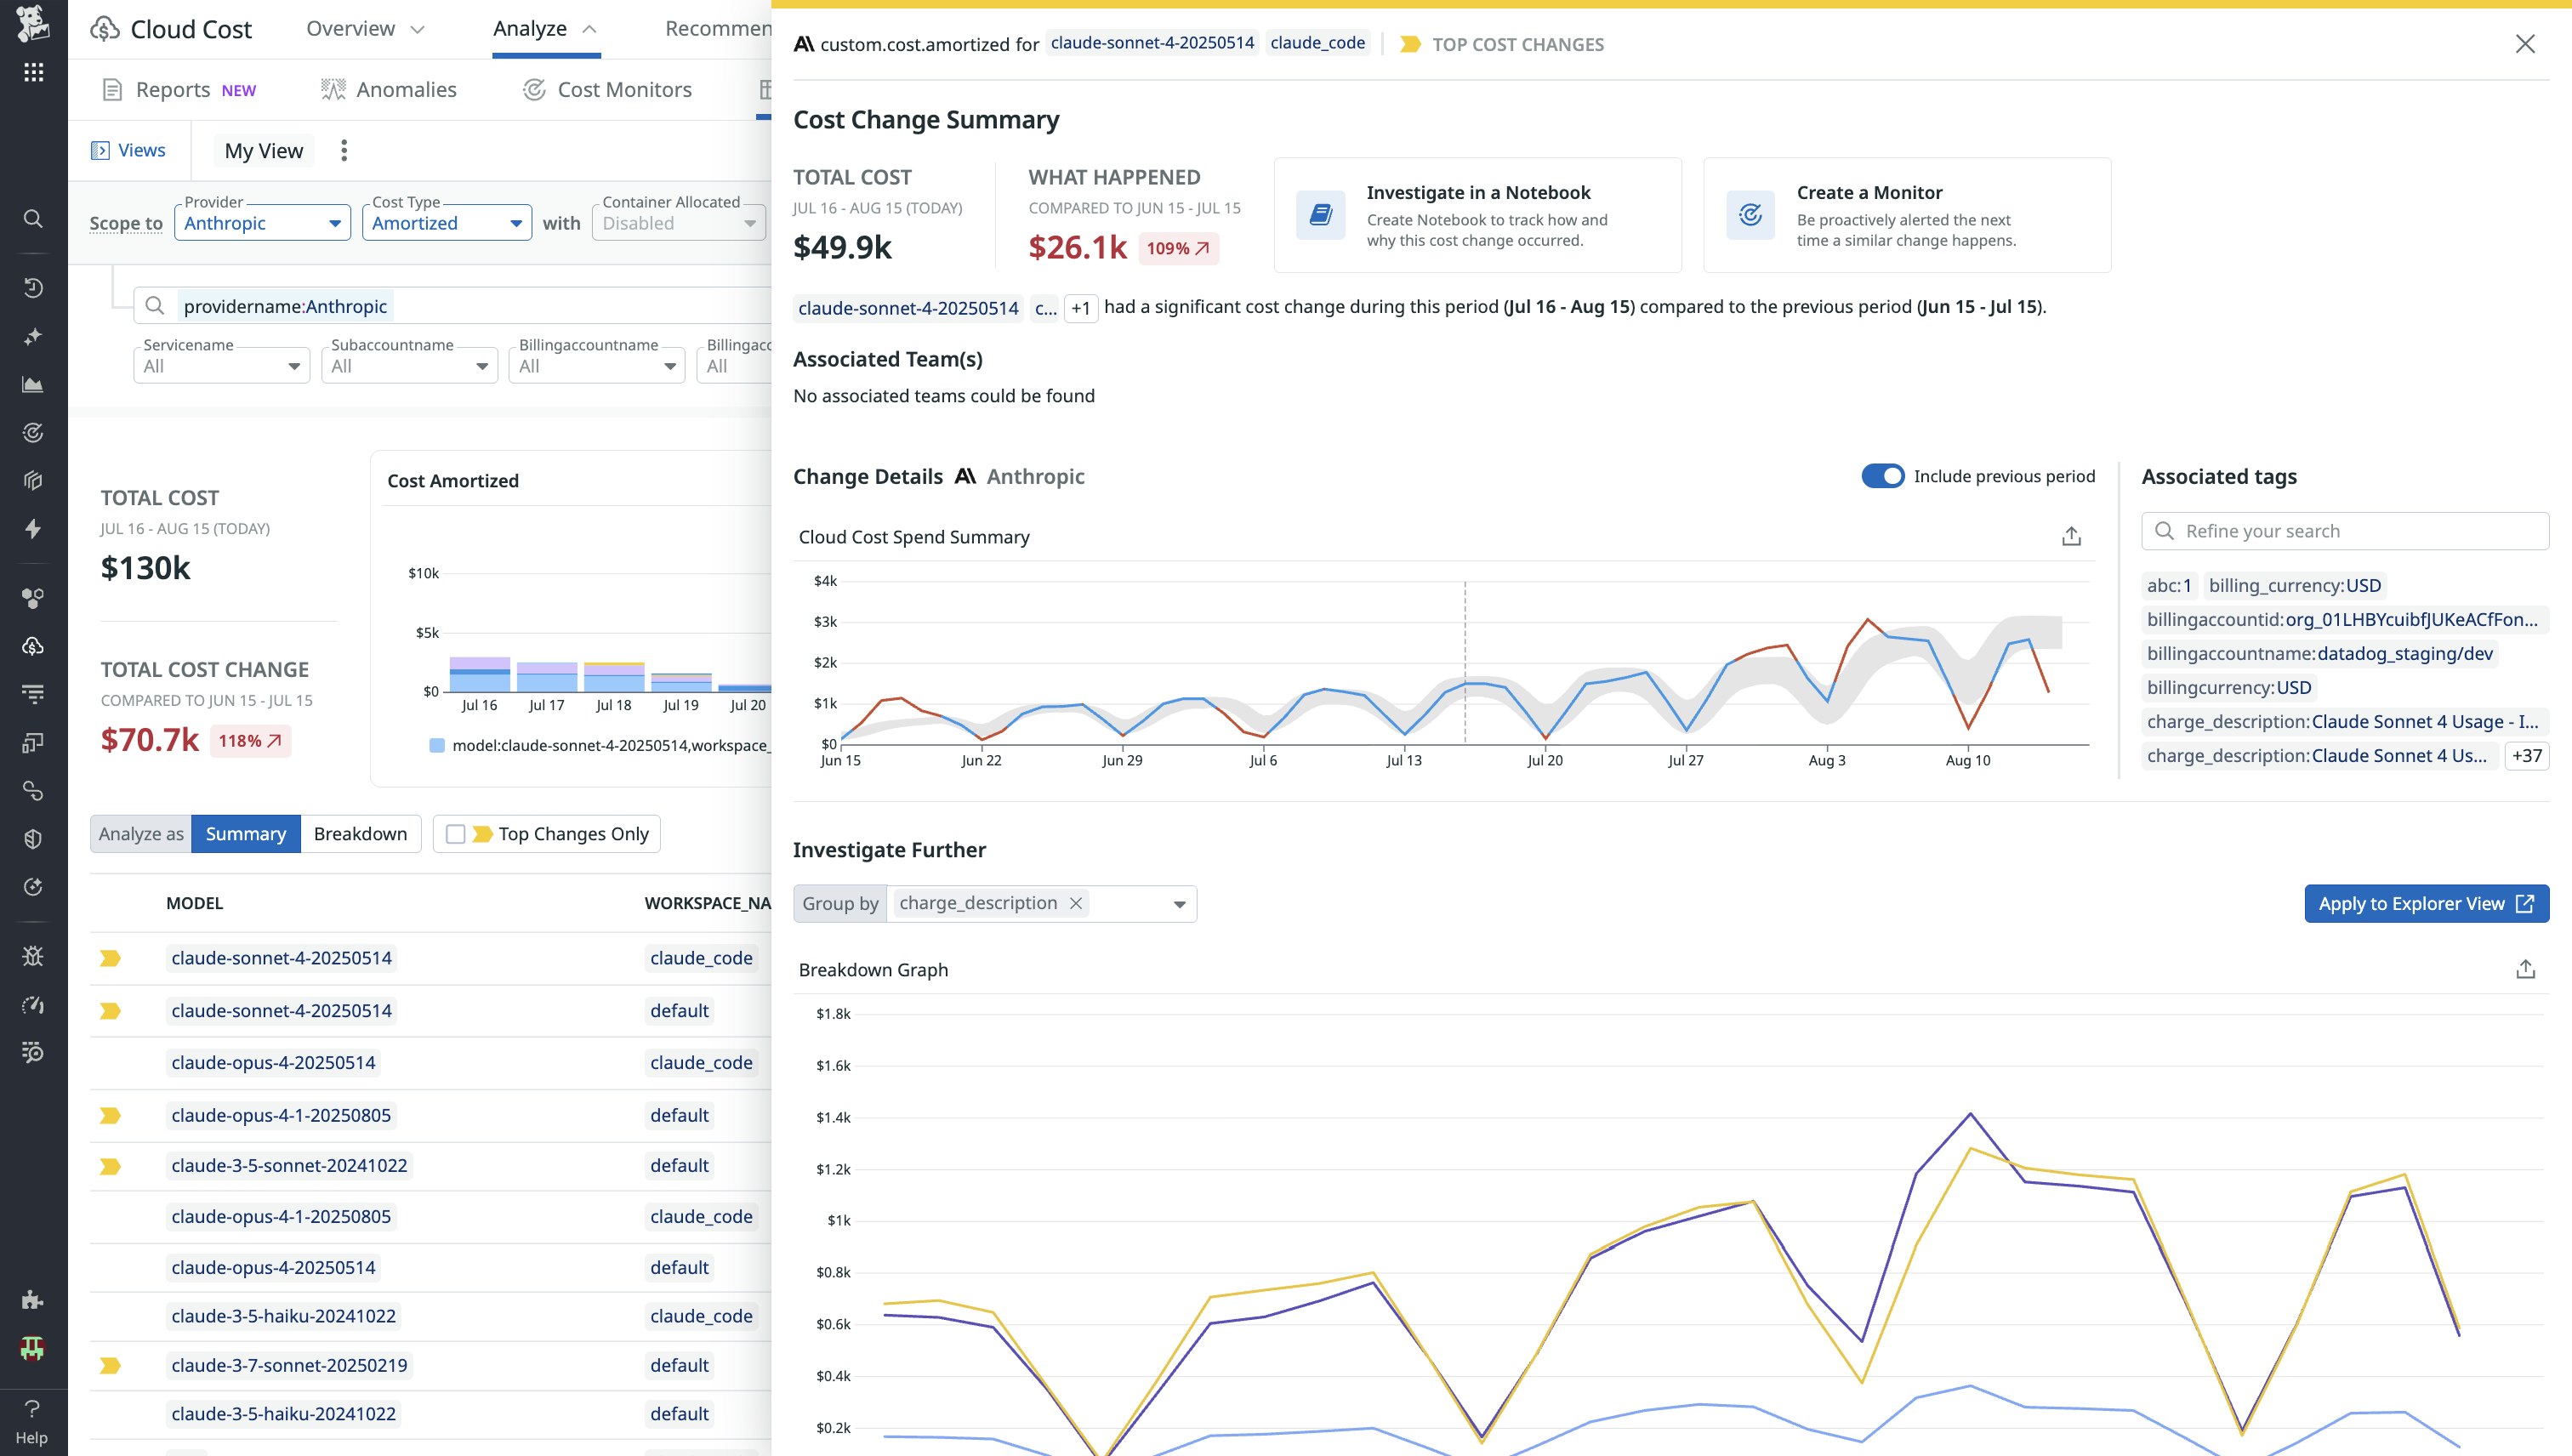
By aligning usage with ownership, you can establish accountability across engineering, FinOps, and finance teams.
Monitor and alert on cost anomalies
Once Claude data is flowing into Datadog, you can immediately set alerts for cost and usage data with prebuilt monitor templates. These include alerting on abnormally low cache hit ratio, abnormally high token usage, and when token usage is approaching the rate limit. You can also create custom monitors and alerts to track usage patterns and detect anomalies. This can include sudden increases in token volume, unexpected spend spikes from specific workspaces, and decreases in cache efficiency, along with changes in service tier usage (e.g., a shift to the Priority tier).

You can also define unit economics like cost per end user, per token, or per inference and use these to forecast, budget, and govern AI spend more effectively.
Understand Claude usage alongside total service cost
Claude usage is just one part of the cost equation for your broader systems. With Datadog CCM, you can correlate dashboards and monitors for Claude spend with infrastructure metrics, application telemetry data, and other cloud service costs, all from the same platform.
This makes it easier to investigate cost anomalies alongside performance issues, identify inefficient deployments or misrouted workloads, and understand how LLM usage contributes to overall service cost. By bringing Claude data into the same observability workflows you already use, you can make informed decisions faster and optimize your AI investments with confidence.
For example, let’s say an APM monitor triggers an alert for increased latency for a particular model, and traces show a delay from a Claude SDK call. You also notice on your Claude Usage and Costs dashboard that spend has spiked within the same time period along with logs showing increased prompt sizes. By correlating your APM traces and Claude cost data, you can roll back recent changes that caused the spike in latency and cost.
Monitor Claude usage with Datadog CCM
With Claude cost and usage data available in Datadog, teams can track AI spend as part of their everyday workflows without switching tools or waiting on monthly reports. You can investigate spikes, allocate spend accurately, and make informed decisions about how to optimize LLM usage across your organization.
To get started, navigate to the Anthropic integration tile in the Datadog app, add your account name, and create an API token. Once configured, Datadog will automatically ingest detailed Claude usage and cost data via the Anthropic Usage and Cost Admin API. For more information, visit the Anthropic integration tile in the Datadog app or check out the CCM documentation. If you’re new to Datadog, you can start a 14-day free trial.


