
Nicholas Thomson

Mahashree Rajendran

Fionce Siow
Amazon CloudWatch Network Monitor, available as part of Amazon CloudWatch, is a network monitoring service that enables you to create customizable monitors for your network connectivity from AWS to on-premises infrastructure via AWS Direct Connect (DX). These monitors alert you to issues in the connectivity and collect metrics (e.g., packet loss and round-trip latency metrics) so you can observe traffic patterns, diagnose problems across your AWS networks, and resolve issues quickly by routing traffic to a redundant healthy path.
We’re excited to announce Datadog’s Amazon Cloudwatch Network Monitor integration, which will allow you to send network monitoring metrics for Direct Connect paths to Datadog, offering you deep visibility into your network performance alongside monitors and telemetry from across your hybrid system.
In this post, we’ll show you how to:
- Create a network monitor in AWS so you can start sending metrics to Datadog
- Alert on network monitors in Datadog to stay ahead of issues
Create a network monitor so you can start sending metrics to Datadog
Datadog’s integration with AWS Network Manager enables you to alert on metrics you are collecting in AWS. To get started, create a monitor within AWS by navigating to Network Monitoring from the Amazon CloudWatch page. Provide the monitor a name and an aggregation period, then choose an AWS network source (the probe’s originating AWS source, which will be a subnet in any of your VPCs) and a Destination (the target address in your on-premises network). Using either TCP or ICMP for the protocol and optionally a port, the monitor will run pings between these two points every second and test for latency, packet loss, reachability, and other key data points.
Once you have created the monitor, three Network Monitor metrics will start streaming into AWS. These metrics are:
PacketLoss, which measures packets not received by the source before a static timeout is reached.RTT(Round-Trip Latency), which measures the time (in milliseconds) that it takes for a network request to go from a starting point to a destination.AWS Network Health Indicator, a companion to the above metrics, which signals network performance degradation and identifies if the source of degradation lies within the customer’s network or the AWS network.
These metrics are published to Amazon CloudWatch, allowing customers to set up custom thresholds on network metrics and send notifications via Amazon Simple Notification Service (SNS).
Alert on AWS Network Monitors in Datadog
Once you’ve enabled Datadog’s AWS CloudWatch Network Monitor integration, you can view the metrics listed above in the Datadog Metrics Explorer.
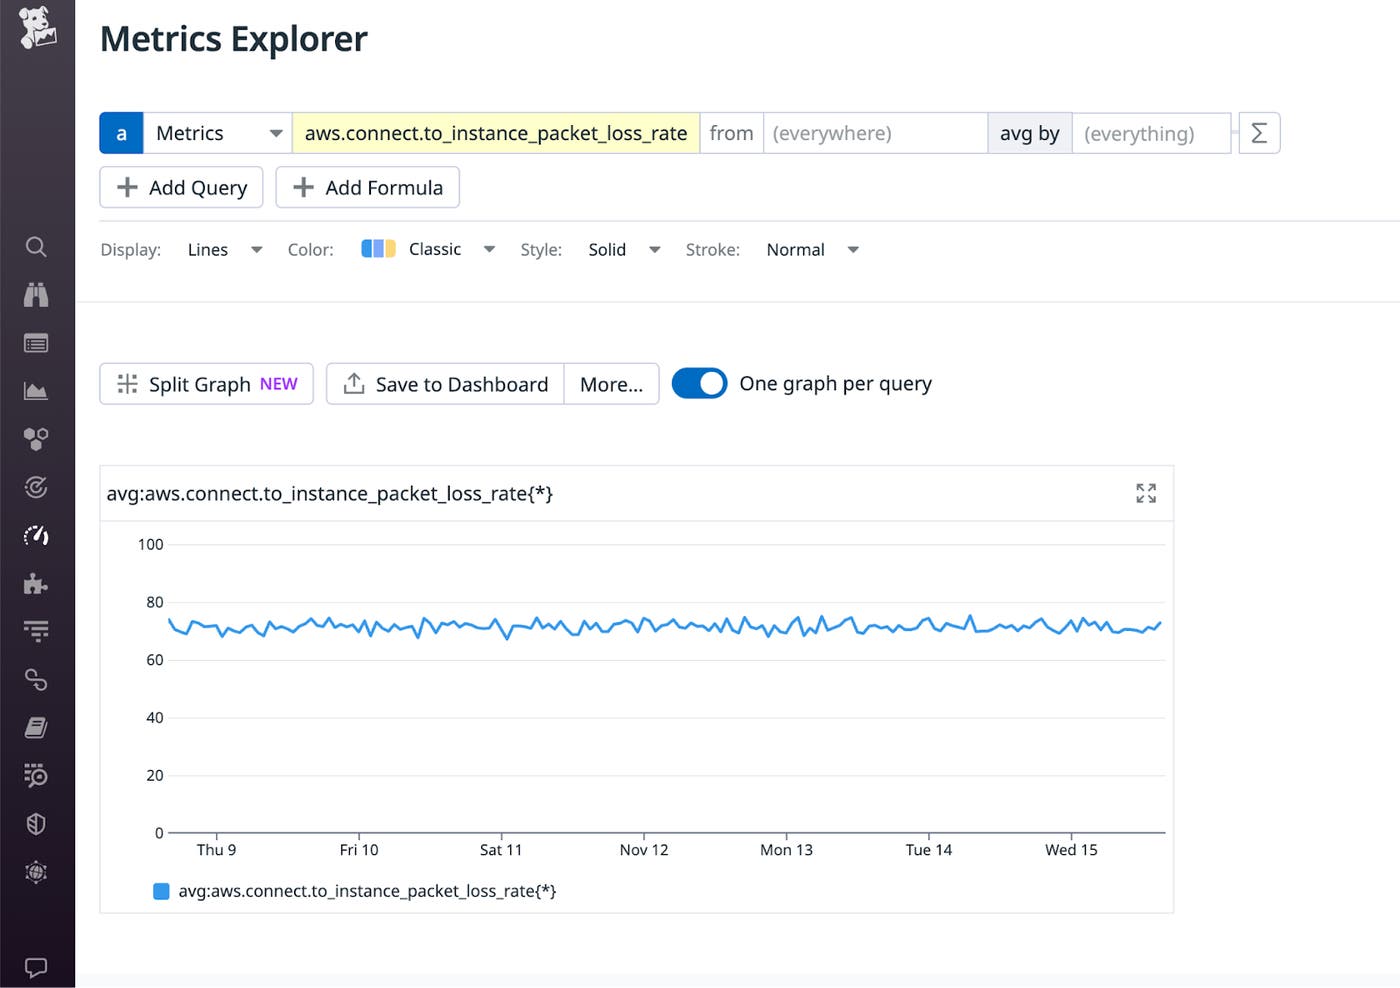
You can also create Datadog monitors on these metrics, take advantage of our recommended monitors, or create custom dashboards to view alerts and metrics in one place. For example, say you’re a network administrator at an e-commerce company hosted on Amazon EC2 and have analytics traffic going to your on-premises data center via AWS Direct Connect. You can use Network Monitoring to collect metrics on the health of your AWS Direct Connect connections.
The custom dashboard you’ve created surfaces an alert from a Datadog monitor you’ve created, indicating that a network connection between an EC2 instance and a customer IP address is down.
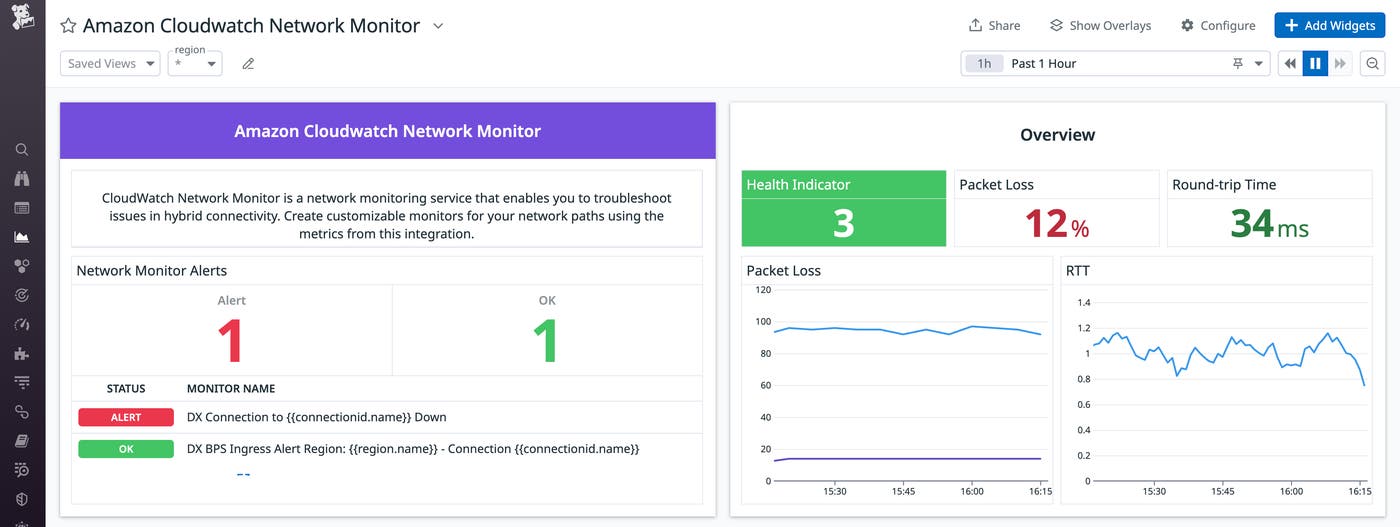
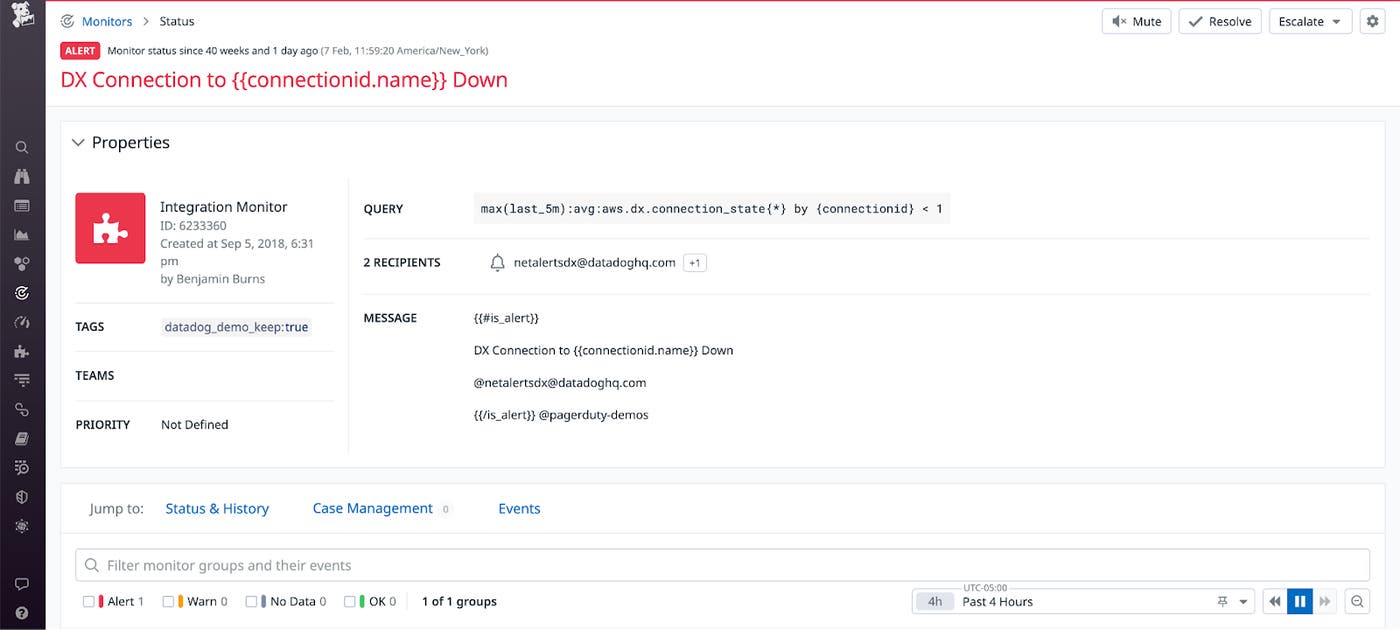
From here, you can click through from that dashboard directly to the alert you received to investigate further.
You can then pivot to Datadog’s Cloud Network Monitoring (CNM), where you notice a spike in SERVFAIL errors, indicating an issue with the server. With this knowledge in hand, you investigate the logs from the EC2 instance running the server generating the SERVFAIL errors and discover an elevated number of OOM kill logs. This lets you know that you need to provision more memory for the instance so that it can resume network communication with the clients.
Use Amazon CloudWatch Network Monitor to gain deep visibility into your traffic
Amazon CloudWatch Network Monitor enables you to create custom monitors on traffic between AWS and your on-premises data centers via AWS Direct Connect. Using Datadog you can monitor these Network Monitors alongside all the rest of your monitoring data from across the stack. The ability to monitor the most critical metrics on the health of your AWS hybrid network connections will help you troubleshoot connectivity issues with the additional context offered by Datadog products such as CNM, APM, and more.
To learn more about the other AWS integrations we released as part of re:Invent 2023, check out our round-up blog.
If you’re new to Datadog, sign up for a 14-day free trial.


