Thomas Sobolik
Having quick access to metrics and health signals from your AWS environment is paramount to identifying issues expediently and monitoring the effects of any deployed fixes. Datadog is proud to partner with AWS for the launch of CloudWatch Metric Streams, a new feature that allows AWS users to forward metrics from key AWS services to different endpoints, including Datadog, via Amazon Data Firehose with low latency.
Using CloudWatch Metric Streams to send your AWS metrics to Datadog offers up to an 80 percent reduction in latency compared to using GetMetricData API calls. Along with Datadog’s support for ingesting log data via Data Firehose, teams using Datadog to monitor their AWS infrastructure can now get low-latency metrics and logs for a comprehensive view of their AWS services’ health and performance.
In this post, we’ll show how you can get started and discuss some of the benefits of sending metrics to Datadog for analysis and troubleshooting of your key AWS services, including ELB, RDS, ElastiCache, and more.
Datadog + CloudWatch Metric Streams via Amazon Data Firehose
If you have already enabled Datadog’s AWS integration in your environment, you can spin up a preset configuration using the included CloudFormation template from the AWS integration tile for a quick start. Deploying the template automatically provisions an Amazon CloudWatch Metric Stream to collect metrics from the services you specify as well as a new Data Firehose that forwards that data to Datadog. We particularly recommend using the template if you have many accounts and regions that don’t need tailored settings.
Alternatively, you can use the following steps to set up a new Data Firehose and provision a CloudWatch Metric Stream for it, repeating for each region within your account.
Set up your Data Firehose
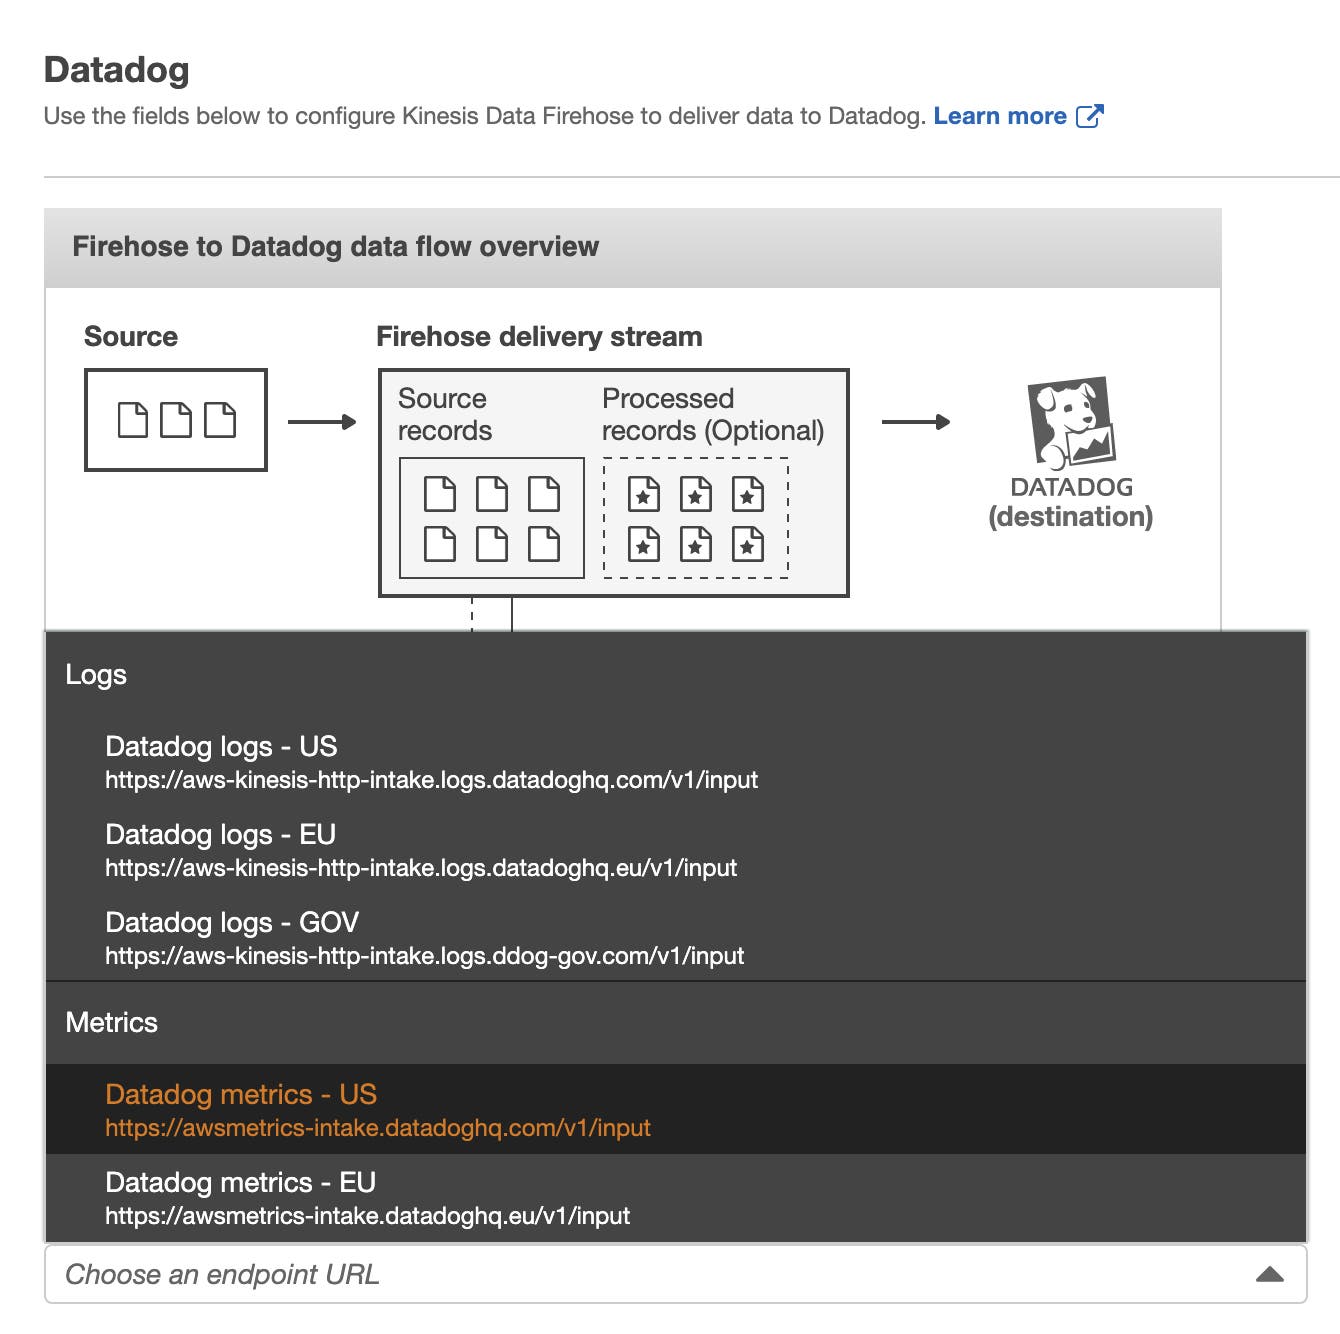
Data Firehose is fully managed by AWS and scales automatically to match your data’s throughput. Creating a Firehose delivery stream requires only a few clicks in the AWS management console. In order to send metrics into Datadog using CloudWatch Metric Streams, first create a new Firehose delivery stream from the AWS console. In the “Name and source” tab, select Direct PUT for the source. This creates a delivery stream that producers write to directly. To configure your Firehose delivery stream to forward metrics to Datadog, in the “Choose a destination” tab select Datadog under “Third-party service provider.” Then, choose the appropriate region’s Datadog AWS metrics HTTP endpoint and plug in your Datadog API key.

We also suggest that you choose the 60-second retry interval, as well as the 60-second buffer interval and 4 MB buffer size for your HTTP endpoint buffer conditions. For more information about configuring your delivery stream, refer to our documentation.
Link a CloudWatch Metric Stream
Once you’ve set up your Firehose and configured it to forward data to Datadog, you can provision a CloudWatch Metric Stream to ingest CloudWatch metrics from the AWS services of your choice and point them to the Firehose.

From the CloudWatch dashboard in the AWS console, select Streams under the “Metrics” group in the navigation menu. Then, click Create metric stream to create a new data stream. In the configuration, you can choose to stream all of your CloudWatch metrics, or to include or exclude specific namespaces. This helps you focus your data collection and reduce costs. You can then select the Data Firehose stream you set up in the previous section as the destination for your metric stream. Create a new service role and select the OpenTelemetry 0.7 output format. After you complete the setup process and the metric stream has been successfully created, metrics will start showing up in Datadog within minutes.

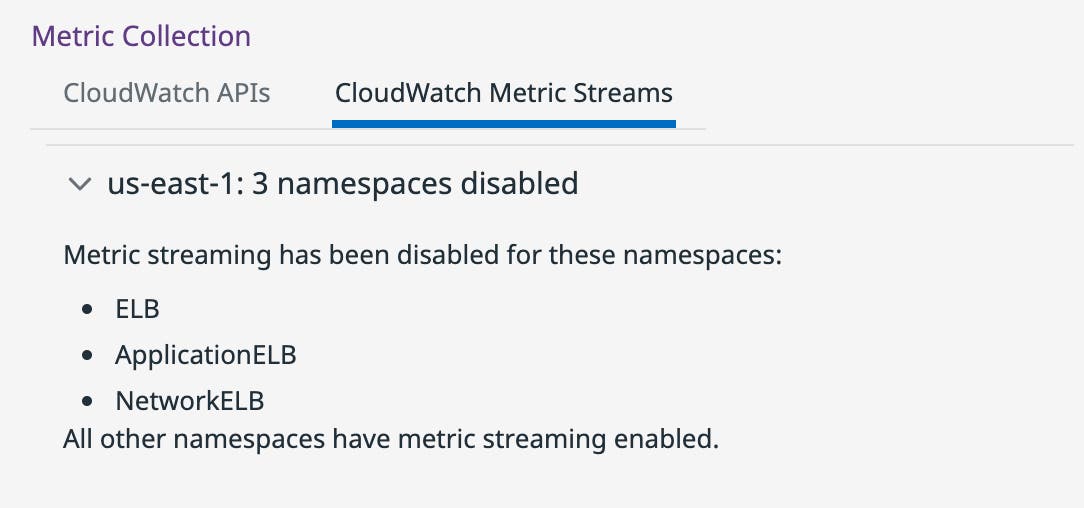
You can verify that your stream has been properly configured from the AWS integration tile inside Datadog, which shows which streams are actively sending data. Datadog automatically detects which metrics are included in the stream and stops collecting them using calls to the CloudWatch API to avoid duplicate data. For more detailed instructions, see the setup guide in our docs.
Get low-latency visibility into key AWS services
Using a CloudWatch Metric Stream to forward metrics to Datadog enables you to monitor your AWS services with significantly lower latency, so you can stay on top of developing problems and receive quick feedback about the efficacy of your team’s solutions.

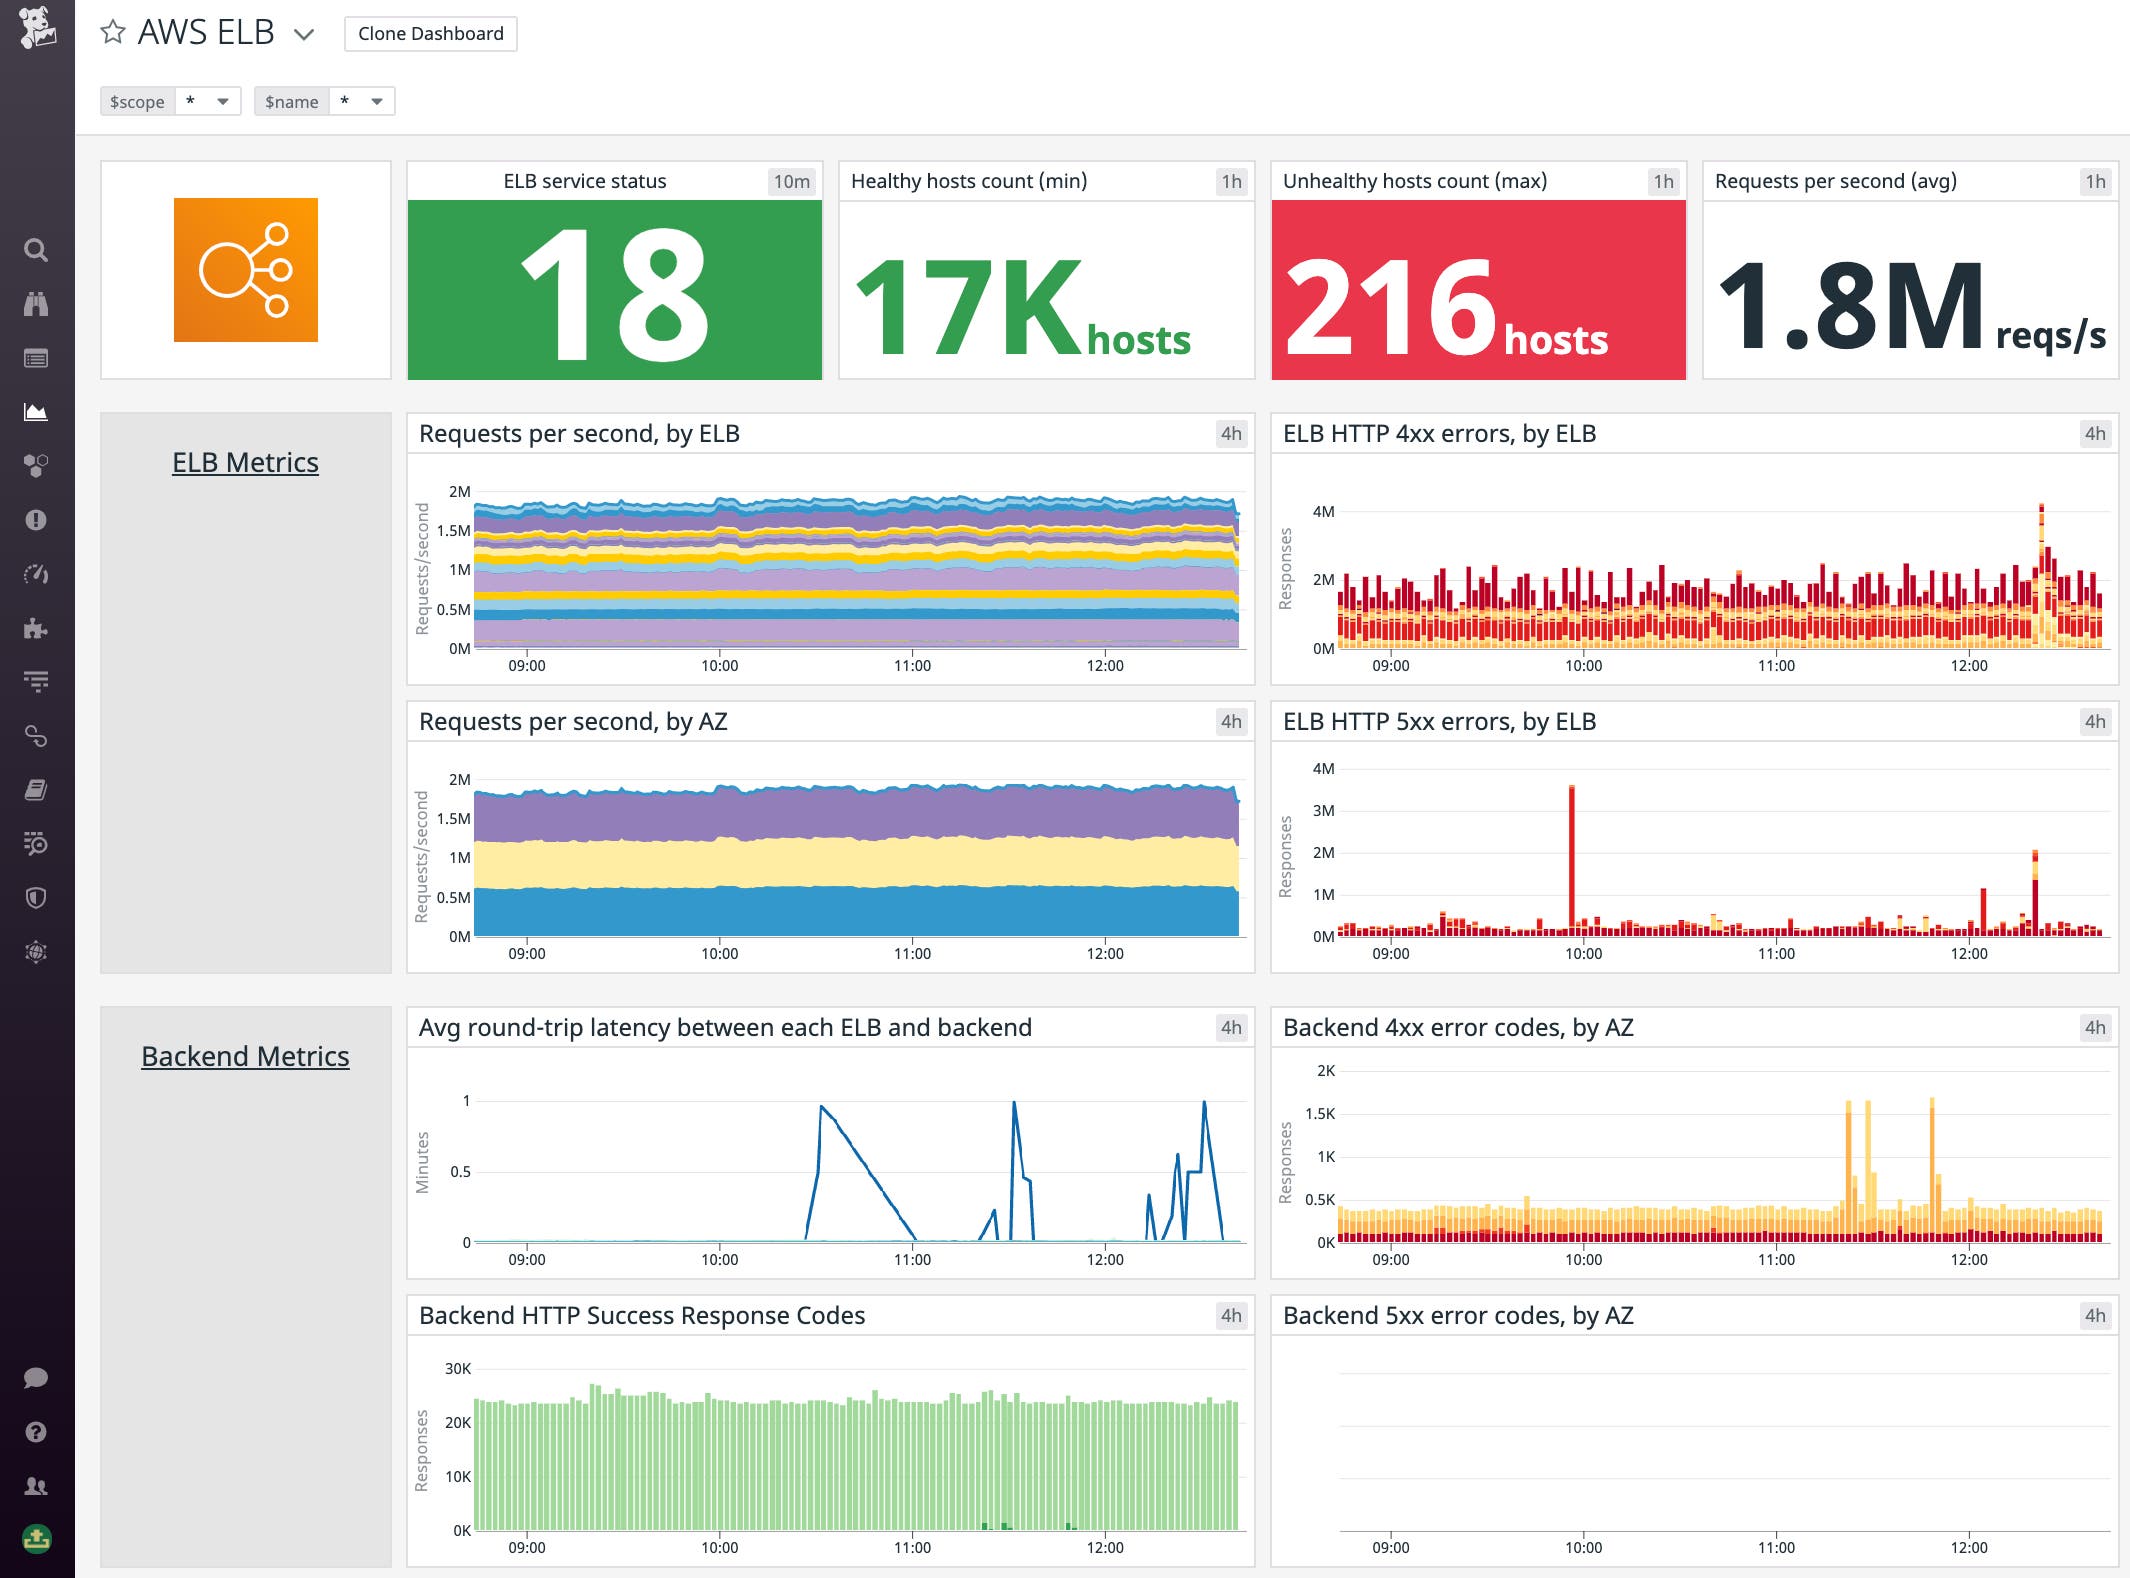
When monitoring ELBs, for example, it’s important to have low-latency visibility into HTTP error rates, request volume, and latency, so that you can alert on spikes as close as possible to when they occur and leave time for your team to mitigate any deterioration of the end-user experience. For instance, by monitoring backend latency and surge queue length, you can identify any severe spikes in latency as they are occurring, and if they are correlated with a high number of queued requests. It’s particularly useful to set an alert on the surge queue length at or near the queue capacity (1,024 requests). Having this alert trigger as soon as possible after the metric crosses the threshold means you can respond right away and so helps avoid dropped requests caused by the overloaded queue which would lead to timeouts on the client’s end. Using CloudWatch Metric Streams to send data to Datadog means that you can see the effects of any fixes you deploy in your dashboards in just a few minutes.
To learn more best practices for monitoring AWS services with Datadog, see our monitoring guide.
Start streaming metrics with Amazon and Datadog
With Amazon CloudWatch Metric Streams, you can monitor key performance and health metrics for your AWS services with lower latency than ever. To learn more about setting up your streams, check our documentation. You can also register for our upcoming webinar with AWS and Instacart, where Instacart will discuss how they use Datadog and Amazon CloudWatch Metric Streams to monitor their grocery delivery service amid unprecedented demand. Or, if you’re new to Datadog, get started with a 14-day free trial.


