John Matson
Akamai is a leading provider of content delivery network solutions around the world, handling many millions of HTTP requests per second. By Akamai's estimates, its CDN platform delivers 15 to 30 percent of global web traffic.
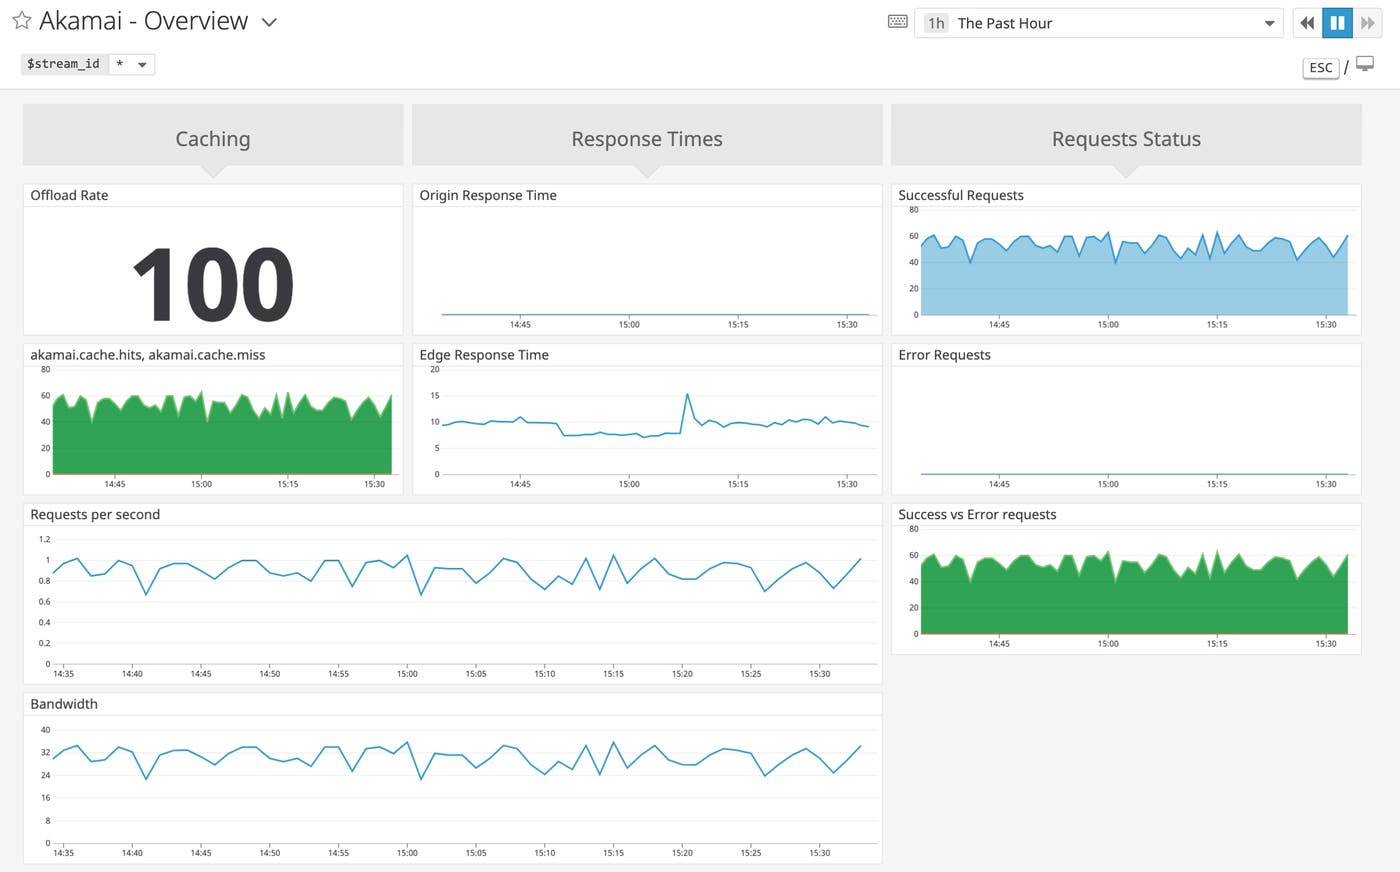
If you're using Akamai to accelerate and protect the delivery of content to your users, we are pleased to announce that you can now use Datadog to monitor the utilization and performance of your CDN. Datadog consumes metrics on request traffic, response times, HTTP response codes, and cache hits and misses via Akamai's DataStream API.
Once you set up the integration, your Akamai data flows into an out-of-the-box dashboard in Datadog and can be used for visualization, alerting, and correlation with data from the rest of your web stack. Datadog integrates with more than 1,000 other technologies and services, including databases, caches, and web servers like NGINX, IIS, and Apache.

Datadog meets DataStream
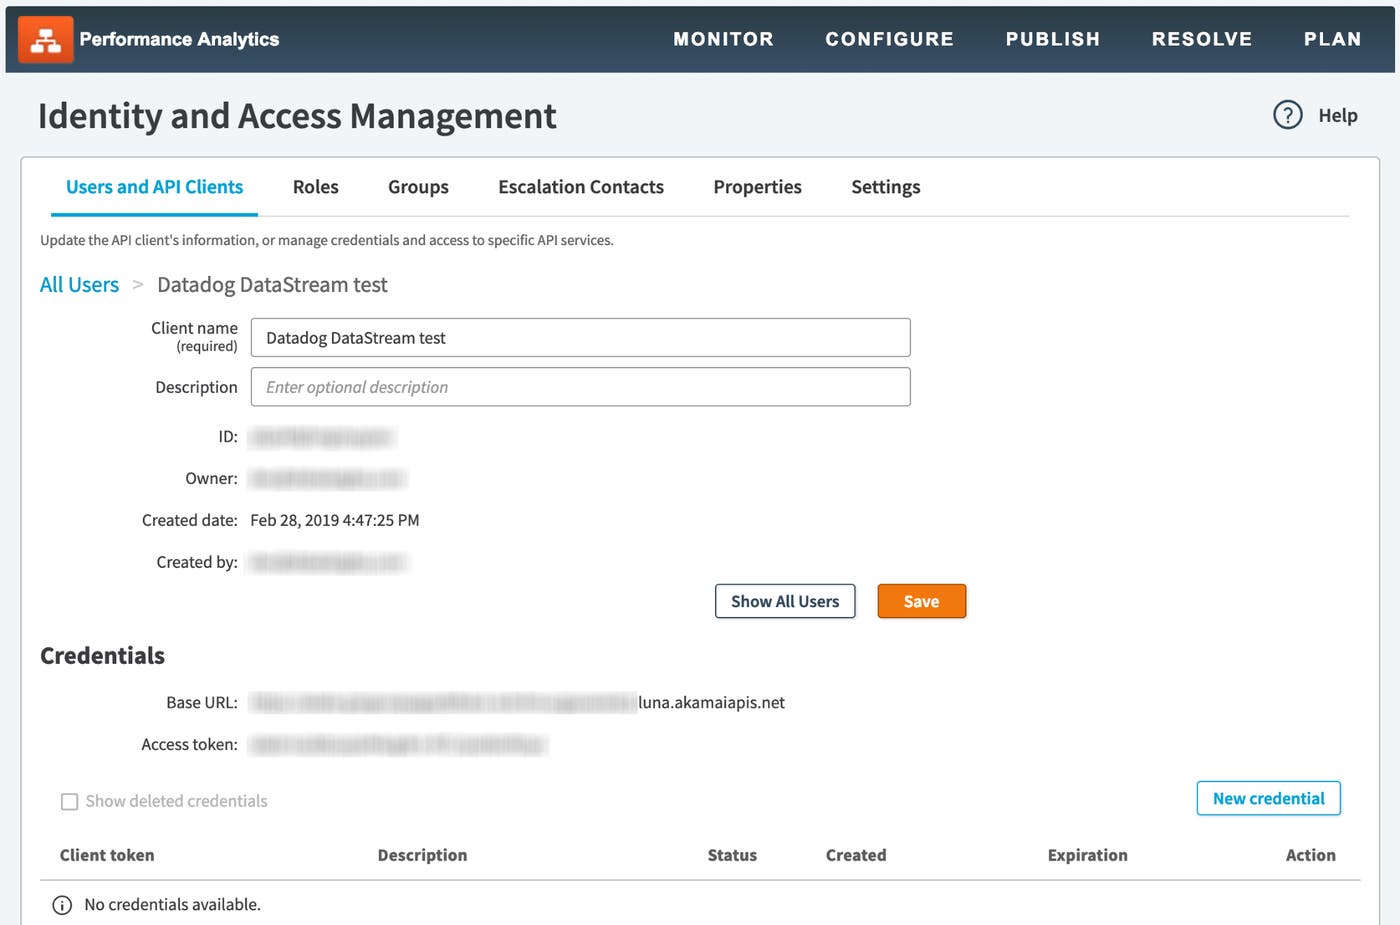
Akamai DataStream is a service that aggregates data on performance, request rates, and errors, and makes them available via API. Akamai users can create a read-only API client for Datadog in the Identity and Access Management section of the Control Center web console. Enabling the Akamai integration in the Datadog app and providing the access credentials for that API client will automatically initiate the collection of metrics from Akamai DataStream. See the accompanying blog post on the Akamai blog for step-by-step details on creating a DataStream client.

Granular CDN metrics

Akamai DataStream allows you to enable several data sets for Datadog to consume, such as response times from the edge, bytes transferred per second, and a breakdown of HTTP status codes (2xx, 3xx, 4xx, 5xx). You can use any of these metrics to build sophisticated visualizations and alerts in Datadog. In the image above, we've applied anomaly detection to reveal when request traffic deviates from normal levels, based on past trends.
You can also monitor the effectiveness of your caching setup with metrics on cache hits, cache misses, and the offload rate (the fraction of total requests that could be served from the cache). The integration also allows you to troubleshoot issues behind the CDN by tracking the origin response time, or the latency in returning objects that Akamai requests from your origin infrastructure. See our documentation for the integration for a full list of available Akamai metrics.
Tap into the stream
We are pleased to partner with Akamai to deliver enhanced visibility into CDN utilization and performance. If you already have a Datadog account, you can enable the Akamai integration by following the steps outlined in our documentation. And if you're not yet using Datadog, you can start monitoring your content delivery network alongside the rest of your infrastructure and applications by signing up for a free 14-day trial.

