Steve Boak
When systems fail and monitors trigger, every second counts. That’s why we first introduced the Triggered Monitors page in Datadog—a precise, real-time view of everything that’s alerting in your environment. Today we’re making the page even better, with faster load times and powerful filters to help you resolve incidents faster.
At a glance
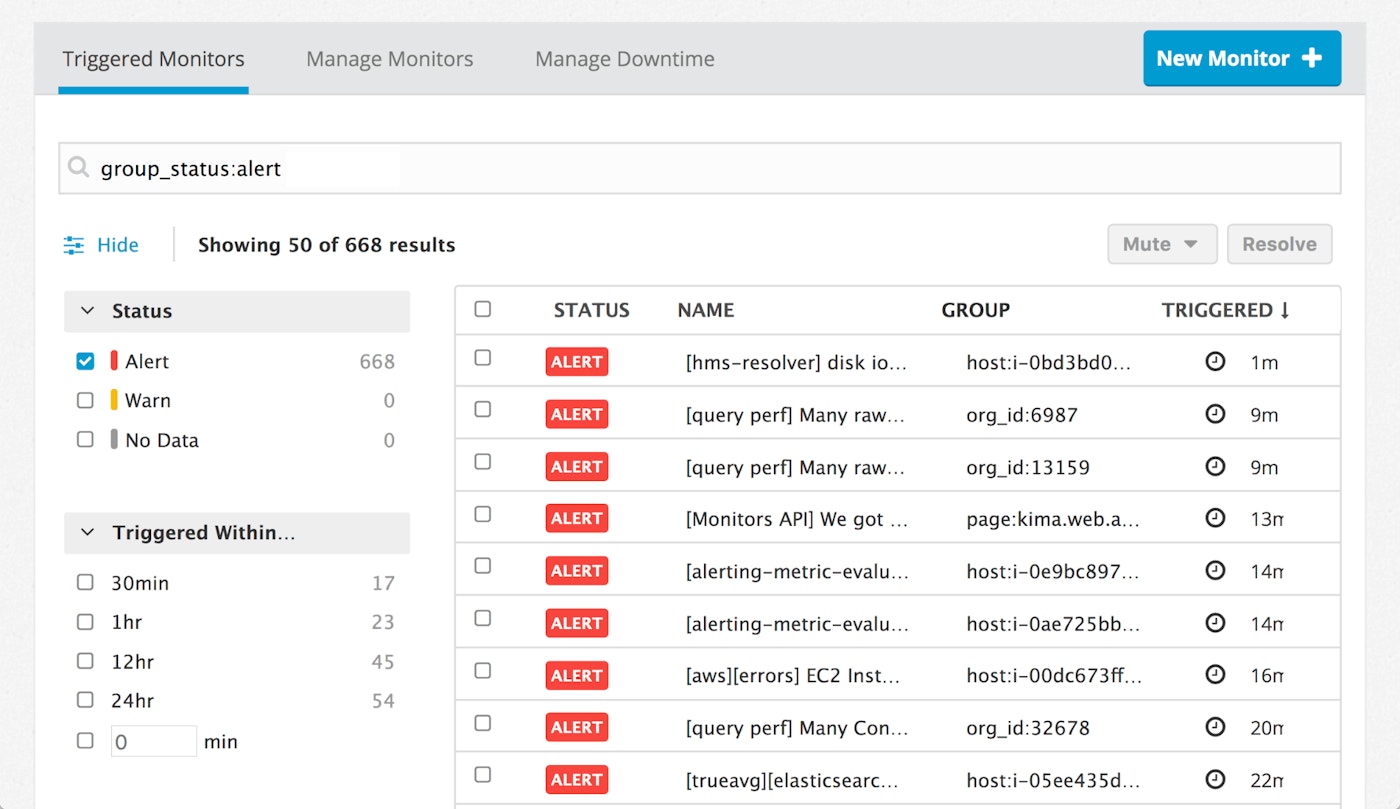
The Triggered Monitors page summarizes your alerts at the top the sidebar, showing a breakdown by status and counts of recently triggered monitors. It’s a quick way to get a feel for what’s happening in your environment.
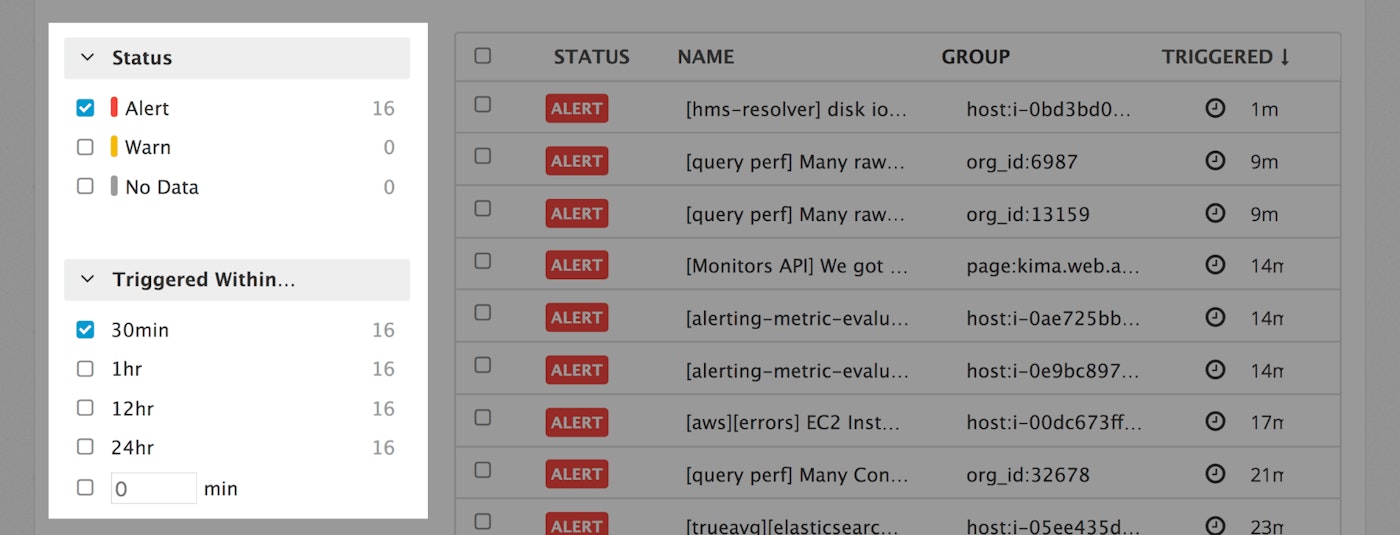
New faceted search options
Like the new Manage Monitors page, the Triggered Monitors page has powerful faceted search and advanced query capabilities. We have also added three new facets to filter groups by:
- How recently the group triggered (in minutes) to help you isolate the most recently triggered groups
- Group name, to show other monitors that might be triggering for this group
- Monitor ID, to find other groups that are triggering the same monitor

Built to scale
The new Triggered Monitors page was built to scale, and teams of all sizes should see significantly faster load times. The new page uses the same query syntax as the new Manage Monitors page—to learn more about advanced queries and facets, check out our documentation.
If you are an existing Datadog customer, the new Triggered Monitors page is already available to you by clicking on “Triggered Monitors” in the Monitors section of the navigation sidebar. Otherwise, you can sign up for a free Datadog trial to see how sophisticated alerting and collaboration can help your teams identify and resolve issues faster.

