Nils Bunge

Emily Chang
C# logs can be an invaluable resource for optimizing application performance and debugging errors. But it's not easy to extract the full potential of your logs if they're not providing enough context around each error, or if they're written in a format that's difficult to parse.
In this post, we'll walk through a few C# logging best practices that can help your applications generate more useful, relevant logs. For instance, you'll see why formatting logs in JSON makes it easier to analyze your logs and identify important information when you're troubleshooting. And while you can use built-in logging providers like TraceSource, you can also get additional benefits by using a specialized C# logging framework like Apache log4net to enrich your logs. We will cover all of these topics in more detail and show you how to:
- Install and configure native and open source logging libraries to collect your C# logs
- Add relevant context and metadata to your C# logs
- Standardize your C# logs by setting up naming conventions
- Log handled and unhandled C# exceptions
- Dive deeper with log analytics
Follow along with the steps in this post to start collecting, customizing, and analyzing your C# logs to get deeper insights into the health and performance of your applications.
Collecting C# logs
If you're just getting started with C# logging, .NET includes native logging providers like TraceSource to help you hit the ground running. However, as your application grows in complexity and scale, you'll likely want to use a specialized C# logging framework like log4net, because it includes more robust features for routing and customizing your logs. We'll walk through some of the ways that you can use TraceSource, log4net, and other utilities to collect C# application logs:
- Output logs to the console with native and open source logging utilities
- Log to a file
- Stream logs directly to a log management service
Along the way, we'll explain why the second option is highly recommended for comprehensive C# log monitoring, but you can also go with the third option if you don't have direct access to your application server. Although many of our examples will focus on log4net, you can achieve similar results with other logging utilities like NLog and Serilog.
Streaming logs to the console with TraceSource
The fastest way to start collecting logs is to stream them to directly the console. This can be very useful for debugging and troubleshooting specific issues. Microsoft's native TraceSource class allows you to trace code as it is executed, and use a listener to log the output to a destination, ranging from the console to a text file.
To configure TraceSource to output logs to the console, you need to complete two steps. First, in your application configuration file (app.config), add a <system.diagnostics> section that defines a source that will generate the logs from our code, and a listener that will listen for traces from that source—and, in this case, output them to the console.
<?xml version="1.0"?><configuration> <system.diagnostics> <sources> <source name="TestLog" switchValue="All"> <listeners> <add name="configConsoleListener" type="System.Diagnostics.SourceSwitch"/> </listeners> </source> </sources> </system.diagnostics> <startup> <supportedRuntime version="v4.0" sku=".NETFramework,Version=v4.6.1"/> </startup></configuration>Note that the switchValue setting specifies the level of events you want to log. The possible levels include "Off" (no logs) and "Critical" (log unhandled exceptions like an OutOfMemoryException). In this example, we set it to "All" in order to get maximum visibility even when the application is not encountering any errors.
Next, we'll need to need to update our application code (e.g., Program.cs) to initialize the trace listener using the same source name that was specified in the application configuration file (TestLog in the previous example), and start writing information to the listener. In the example below, we first initialized the TraceSource logger and then used the TraceSource.TraceEvent() method to write an informational message:
using System;using System.Diagnostics;class Program { private static TraceSource _source = new TraceSource("TestLog"); static void Main(string[] args) { var i = 10; var j = 5; _source.TraceEvent(TraceEventType.Information, 0, "A calculation is about to start: {0}x{1}", i,j); [ ... ] } }In this example, the TraceEvent method includes parameters that instruct it to log an informational message, along with the event ID and a message. Save the file and run your application. In your output, you should see a log line that looks like this:
TestLog Information: 0 : A calculation is about to start: 10x5The source (TestLog), level (Information), and the event ID (0) appear at the beginning of the log line. In a later section of this post, we will show you how to standardize the format of these log fields, so that you do not need to manually define the name of the source/namespace that is generating the log.
You can learn more about Microsoft's TraceSource library and its many configuration options here.
Logging to the console with log4net
Although TraceSource provides a built-in option that's convenient for quickly generating logs, you can get even deeper visibility into your logs by using a specialized C# logging framework. Apache logging library for .NET environments, log4net, provides access to richer logging capabilities, which allow you direct the output of your logs to multiple destinations and add richer context to your logs.
To start using log4net, first, you need to install the NuGet library to your application. In your app.config file, define the logger with log4net.config.Log4NetConfigurationSectionHandler within the configSections section, and configure the ConsoleAppender to append log events to the console:
<?xml version="1.0" encoding="utf-8" ?><configuration> <configSections> <section name="log4net" type="log4net.config.Log4NetConfigurationSectionHandler, log4net"/> </configSections> <log4net> <appender name="ConsoleAppender" type="log4net.Appender.ConsoleAppender"> <layout type="log4net.Layout.PatternLayout" /> </appender> <root> <level value="DEBUG" /> <appender-ref ref="ConsoleAppender" /> </root> </log4net></configuration>Similar to TraceSource's notion of "listeners," log4net uses "appenders" to direct log output to one or more destinations, such as the console or a file. Note that in the example above, we used the level element to configure log4net to log events that are DEBUG and higher priority.
Add the following line to your AssemblyInfo.cs file if you want log4net to automatically reload the configuration each time it detects that the configuration (e.g., TestApp.exe.config) has been updated:
[assembly: log4net.Config.XmlConfigurator(Watch=true)]Now define the log4net logger within your code:
private static readonly log4net.ILog log = log4net.LogManager.GetLogger("TestLog"); static void Main() { var i = 10; var j = 5; log.Info($"A calculation is about to start: {i}x{j}"); [ ... ] }When you run the application, you should see the following output appear in the console:
A calculation is about to start: 10x5Unlike TraceSource's console output, this log message doesn't display the logger name (TestLog), the log level (Information), or the event ID. In a later section, we will show you how to configure log4net to add this context to each log message. For more details on using log4net, consult the documentation.
Sending C# logs to a file
We've seen how easy it is to output your C# logs to the console. Streaming logs to the console provides the real-time visibility you need for debugging, but it doesn't allow you to easily retain and analyze your logs to identify trends and patterns over time. You can extract these insights by configuring your application to log to a file. If you use a monitoring service like Datadog, you can also configure monitoring agents to tail each log file, enabling you to analyze log data from all of your applications in a central platform.
Another option is streaming logs directly to a log management platform that includes data retention. However, logging to a file is still our recommended approach because it does not require your application to account for handling network connection errors or other issues. Furthermore, if the application encounters a network issue that prevents it from streaming logs, you won't lose any data as long as those logs are also being written to a locally stored file.
In this section, we'll show you how to output your logs to a file by using the two logging providers we set up in the previous section.
Logging to a file with TraceSource
TraceSource provides a TextWriterTraceListener class that can direct your log messages to a file. You can configure this within the <listeners> element of your app.config file:
<listeners>[ ... ] <add name="textwriter" type="System.Diagnostics.TextWriterTraceListener" initializeData="testing.log"/></listeners>This adds a "textwriter" listener that writes your logs to the testing.log file specified in initializeData. You can also specify a full path to a file, if desired. If the file does not exist, TraceSource will automatically create one.
Logging to a file with log4net
Just as we configured log4net's ConsoleAppender to direct logs to the console earlier, we can now use log4net's FileAppender to append logs to a file. Define the appender within the <log4net> section of your app.config file:
<log4net> <appender name="FileAppender" type="log4net.Appender.FileAppender"> <file value="C:\Logs\MyLogFile.txt"/> <appendToFile value="true" /> </appender> <layout type="log4net.Layout.PatternLayout" /> </appender>[ … ] <root> <level value="DEBUG" /> <appender-ref ref="FileAppender" /> </root> </log4net>The application will direct (or "append") the log output to the path and file specified in the file attribute. You can also use log4net's RollingFileAppender to set up log rotation, which will roll out a new log file once the current file reaches a maximum size, or once a certain period of time has passed (day, hour, etc.). See the documentation for more details and configuration examples.
Streaming logs directly to a log management solution
For various reasons mentioned earlier, we recommend that you configure your applications to log to a file (rather than streaming them to the console or to an external monitoring service). However, sometimes it is simply not possible to log to a file.
If you do not have direct access to the host running your application, you can still monitor your logs by streaming them directly to a monitoring platform. If you're using a log management service like Datadog, you can configure a Serilog sink to stream logs via TCP directly to your account. From there, you can visualize your logs and set up alerts to monitor specific types of issues. See the documentation for more detailed instructions on setting this up.
Enriching and standardizing your C# logs
So far, we've configured our C# application to output logs to the console and to a file, using the built-in TraceSource library as well as log4net. Next, we will show you how to get even more out of your logs by:
- Adding metadata to your C# logs
- Standardizing the format of your logs by dynamically populating the logger class
- Logging exceptions with try/catch blocks and capturing unhandled exceptions
- Outputting logs in JSON format
Adding metadata to your standard C# logs
If you recall, the log4net library did not include any details about the user, thread ID, or event ID. You can use log4net's conversionPattern to start capturing this information in each log message. Update your app.config file to include the snippet below:
<log4net> <appender name="FileAppender" type="log4net.Appender.FileAppender"> <file value="C:\Logs\testing.txt"/> <appendToFile value="true" /> <layout type="log4net.Layout.PatternLayout"> <conversionPattern value="%date{ABSOLUTE} [%logger] [%thread] %level - eventID:%property{eventID} - userID:%property{userID} - %message - method -%method - line - %line" /> </layout> </appender>[ … ]</log4net>The conversionPattern above specifies that we want to capture the fields (indicated with a % symbol):
- Date (using the AbsoluteTimeDateFormatter)
- Logger name
- Thread
- Log level
- Event ID (property defined in code)
- User ID (property defined in code)
- Message
- Method
- Line
Any text that is not preceded by a % is helper text that describes each log field. Later, we'll see why outputting your logs in JSON format removes the need to use this helper text and makes things a bit more organized. The eventID and userID are specified with the %property variable, because these "properties" will get populated from the logical thread context, by using the LogicalThreadContext.Properties scope:
using System.Threading;{ static class Program { static void Main() {
[ … ] Thread firstThread = new Thread(example => Calculate(user1.id, event1.id)); Thread secondThread = new Thread(example => Calculate(user2.id, event2.id)); firstThread.Start(); secondThread.Start(); [ … ] }
private static void Calculate(int userID, int eventID) { log4net.LogicalThreadContext.Properties["eventID"] = eventID; log4net.LogicalThreadContext.Properties["userID"] = userID; var i = 10; var j = 2; log.Info($"A calculation is about to start: {i}/{j}"); int k = i / j; }log4net's LogicalThreadContext.Properties is useful for capturing information across multithreaded operations, since it captures information at the scope of each logical thread. If we run the application, it will log a message from each thread, as shown here:
20:23:46,714 [TestLog] [4] INFO - eventID:531 - userID:123 - A calculation is about to start: 10/2 - method -Calculate - line - 4420:23:46,716 [TestLog] [5] INFO - eventID:12 - userID:456 - A calculation is about to start: 10/2 - method -Calculate - line - 44If you want log4net to insert a new line at the end of each message so that these two messages don't get jumbled together, you can add a %newline at the end of the conversionPattern. Learn more about this and other conversion pattern names in the documentation.
Standardizing your logs by initializing a C# logger per class
Although we manually configured the name of our TestLog logger in the previous examples, logging libraries generally recommend initializing a logger within each class. To make the process more automatic, you can use a built-in method, MethodBase.GetCurrentMethod(), to use the class and namespace of the current method as the logger name.
This means that you can use the same snippet to define your logger within each class, instead of manually naming each logger. Earlier, we manually defined the logger like this:
namespace SimpleCalculator{ static class Program { private static readonly log4net.ILog log = log4net.LogManager.GetLogger("TestLog");[ … ]Replace that line with the snippet below, which retrieves the name of the class and namespace and feeds this information to the logger:
namespace SimpleCalculator{ static class Program { private static readonly log4net.ILog log = log4net.LogManager.GetLogger(System.Reflection.MethodBase.GetCurrentMethod().DeclaringType);[ … ]If you run your application, you'll see that log4net will start including the namespace and the class in the logger field:
23:33:27,722 [SimpleCalculator.Program] [4] INFO - eventID:531 - userID:123 - A calculation is about to start: 10/0 - method -Calculate - line - 4423:33:28,617 [SimpleCalculator.Program] [5] INFO - eventID:12 - userID:456 - A calculation is about to start: 10/0 - method -Calculate - line - 44Logging C# exceptions
To help you efficiently debug C# errors, your logs need to provide visibility into the types of exceptions that get thrown, even when they're automatically handled by your application. You can update your exception-handling logic to log more informative messages within the try/catch blocks of your code. For even wider coverage, you'll also want to make sure that your applications log any exceptions that are thrown outside of try/catch blocks.
Catching exceptions
Logging handled exceptions will help you stay in the loop about how often this is happening. For example, you can include a try/catch block to capture a DivideByZeroException in your application code:
try{ int k = i / j;}catch(Exception e){ log.Fatal(e);}If this exception gets raised, the application will generate a log like this:
19:07:40,232 [SimpleCalculator.Program] [4] FATAL - eventID:3 - userID:1 - System.DivideByZeroException: Attempted to divide by zero. at SimpleCalculator.Program.Calculate(Int32 userID, Int32 eventID) in C:\Users\Emily\Desktop\Simple Calculator\C#\SimpleCalculator\Program.cs:line 63 - method -Calculate - line - 68In a later section, we will show you how to format these logs in JSON so that you can easily parse the exception message separately from the rest of the properties in the log format (timestamp, logger name, log level, etc.).
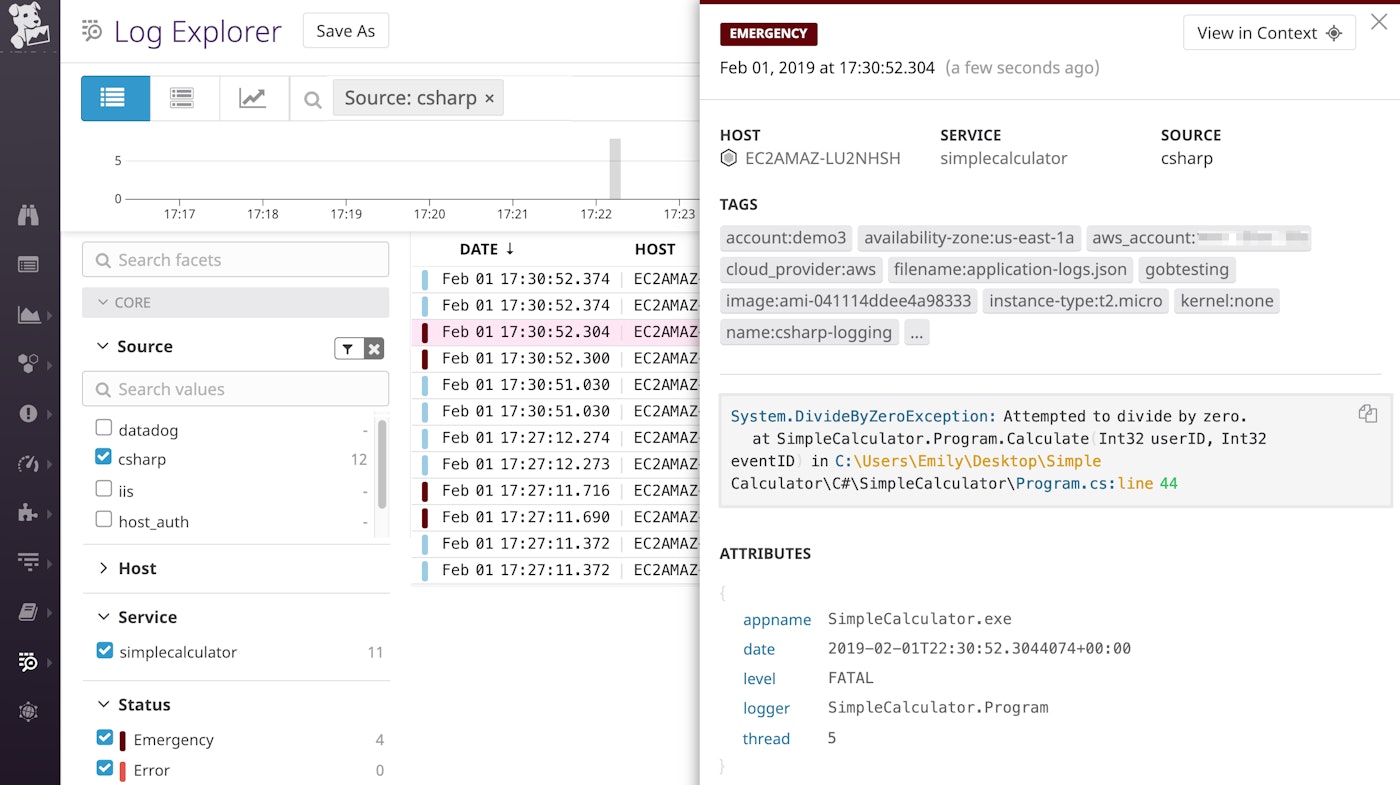
Logging unhandled exceptions
If your application throws an exception outside of a try/catch block, you'll want to log that activity in order to track critical issues that you might otherwise miss. You can use UnhandledExceptionEventHandler to automatically log details about each unhandled exception. You can also use ThreadExceptionEventHandler if you need to log unhandled exceptions at the thread level.
To use UnhandledExceptionEventHandler, you'll need to specify which application domain you want the handler to operate in and then define the event handler. In this example, we are following steps outlined in the documentation, which configure the event handler to catch unhandled exceptions in the default application domain:
static void Main(){ AppDomain currentDomain = AppDomain.CurrentDomain; currentDomain.UnhandledException += new UnhandledExceptionEventHandler(MyHandler);[ … ]
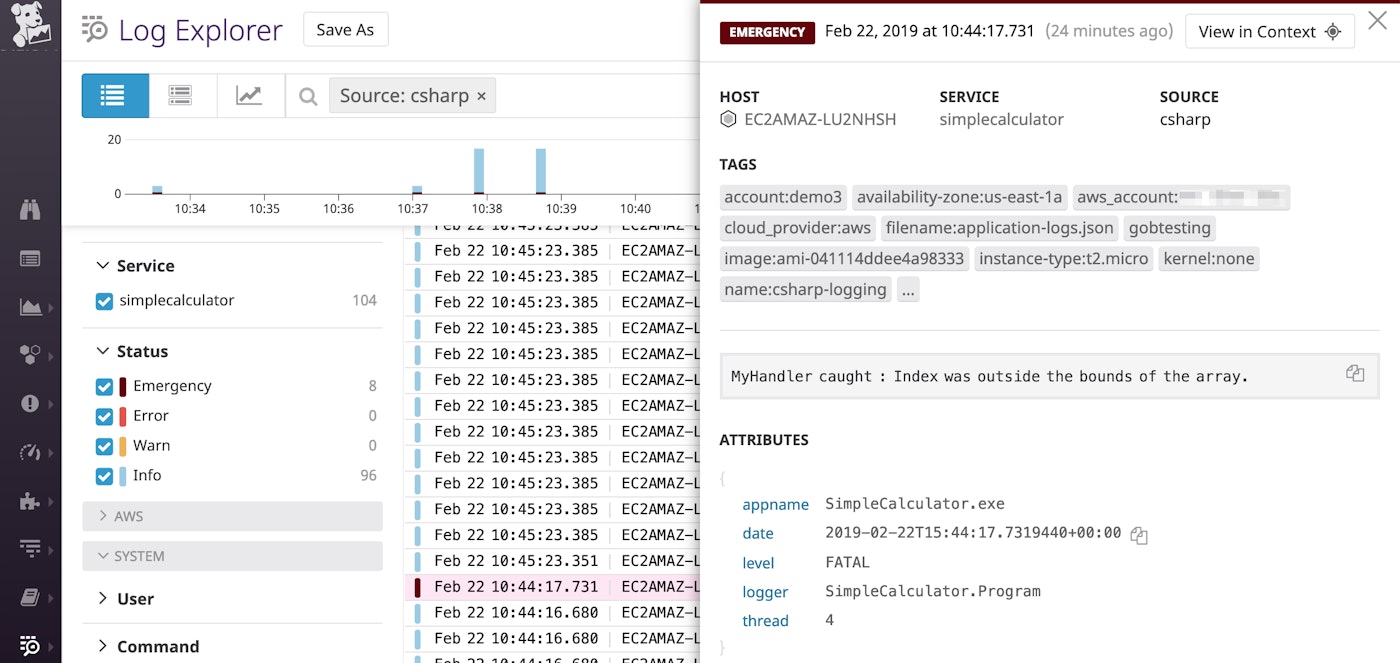
static void MyHandler(object sender, UnhandledExceptionEventArgs args) { Exception e = (Exception)args.ExceptionObject; log.Fatal("MyHandler caught : " + e.Message); }Once we've defined this handler, it will log the unhandled exception that gets thrown when the application runs the following code:
static class Program[...] int[] numberArray = new int[5]; for (int a = 1; a <= 6; a++) { numberArray[a - 1] = a; }[...]The application will throw an IndexOutOfRangeException, which will then trigger the UnhandledExceptionHandler to log the exception:
22:09:50,719 [SimpleCalculator.Program] [4] FATAL - eventID:3 - userID:1 - MyHandler caught : Index was outside the bounds of the array. - method -MyHandler - line - 39In the next section, we'll show you how to log in JSON format instead, which gives you more clarity into multi-line exceptions and helps ensure that an external monitoring service can parse your logs. In JSON format, your logs would look similar to this:
{"date":"2019-02-04T21:40:06.1447191+00:00","level":"FATAL","appname":"SimpleCalculator.exe","logger":"SimpleCalculator.Program","thread":"4","message":"MyHandler caught : Index was outside the bounds of the array."}Logging in JSON format
JSON provides many benefits for log monitoring, and a more structured way to analyze the elements in any given conversion pattern. For example, multi-line logs automatically get wrapped into a single line, so you can interpret them more clearly, rather than having to manually piece log snippets together. And outputting your logs in JSON format also allows you to convert log fields into attributes or metrics that you can analyze and monitor.
To configure log4net to log messages in JSON format, first you will need to install the JsonFileAppender package. One way you can do this is by running the following command in the Package Manager Console:
PM> Install-Package log4net.Ext.JsonAdd the new package to your app.config file by updating the <log4net> section with the following:
<configSections> <section name="log4net" type="log4net.config.Log4NetConfigurationSectionHandler, log4net"/> </configSections> <log4net> <appender name="JsonFileAppender" type="log4net.Appender.FileAppender"> <file value="C:\Logs\application-logs.json"/> <appendToFile value="true" /> <layout type="log4net.Layout.SerializedLayout, log4net.Ext.Json"> <decorator type="log4net.Layout.Decorators.StandardTypesDecorator, log4net.Ext.Json" /> <default /> <remove value="ndc" /> <remove value="message" />
<member value="message:messageobject" />
</layout> </appender> <root> <level value="DEBUG" /> <appender-ref ref="JsonFileAppender" /> </root> </log4net>With the configuration above, the application will log its output messages to the file and path specified in the value of the <file> attribute, in JSON format.
Let's say that your application includes the following code:
var i = 10; var j = 2; log.Info($"A calculation is about to start: {i}/{j}");It will generate a JSON-formatted log like this:
{"date":"2019-02-06T22:00:57.0361509+00:00","level":"INFO","appname":"SimpleCalculator.exe","logger":"SimpleCalculator.Program","thread":"4","message":"A calculation is about to start: 10/2"}As you can see, we used the MethodBase.GetCurrentMethod() to grab the namespace (SimpleCalculator) and class (Program) associated with the operation that's being logged. This information now appears in the logger field of the JSON output. Once you're capturing all your logs in JSON format, you can easily analyze commonly occurring fields to gather critical insights into your applications. For example, you could break down your logs by logger and level to see if a certain class is exhibiting a higher rate of errors than usual.
Logging custom attributes in JSON
JSON format is highly flexible, so you can easily start logging new custom attributes that help you track the activity of your applications. For example, you can use LogicalThreadContext.Properties to store the value of a custom calculationtime property that tracks the duration of a specific calculation:
log.Info($"A calculation is about to start: {i}/{j}"); var watch = System.Diagnostics.Stopwatch.StartNew(); int k = i / j; watch.Stop(); var elapsedMs = watch.ElapsedMilliseconds; log4net.LogicalThreadContext.Properties["calculationtime"] = elapsedMs; log.Info($"Calculation took: {elapsedMs} milliseconds");Then update your app.config file's <log4net> section so that it lists your custom calculationtime attribute as a <member> within your custom JSON layout:
<log4net> <appender name="JsonFileAppender" type="log4net.Appender.FileAppender"> <file value="C:\Logs\application-logs.json"/> <appendToFile value="true" /> <layout type="log4net.Layout.SerializedLayout, log4net.Ext.Json"> <decorator type="log4net.Layout.Decorators.StandardTypesDecorator, log4net.Ext.Json" /> <default /> <remove value="ndc" /> <remove value="message" /> <member value="message:messageobject" /> <member value="calculationtime" /> </layout>[ … ]</log4net>This configures log4net to begin adding the new attribute to the JSON format whenever it's available, without impacting logs that don't include this field. This means that you'll see some messages that include the calculationtime attribute, and others that don't:
{"date":"2019-02-22T16:58:30.1241866+00:00","level":"INFO","appname":"SimpleCalculator.exe","logger":"SimpleCalculator.Program","thread":"4","message":"A calculation is about to start: 10/5"}{"date":"2019-02-22T16:58:30.3322091+00:00","level":"INFO","appname":"SimpleCalculator.exe","logger":"SimpleCalculator.Program","thread":"4","message":"Calculation took: 50 milliseconds","calculationtime":50}JSON format allows you to capture as many custom attributes as you like, so you can use your logs to track application performance and debug features more swiftly than ever before. It also makes it easier to process and analyze your logs with a log management service like the one shown below. If you're using Datadog, you could also track this new calculationtime attribute as a log-based metric, and monitor it with dashboards and alerts.
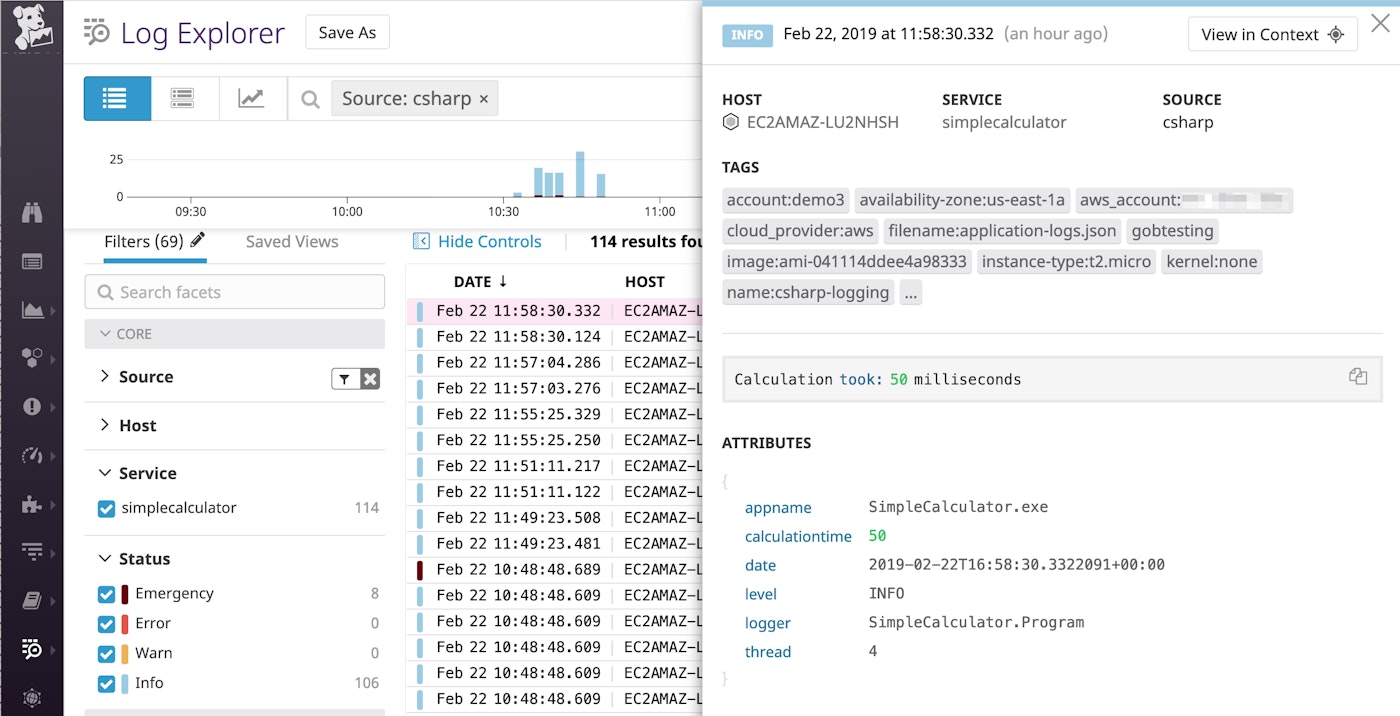
Digging into your C# logs with a centralized solution
As your applications grow in scale and complexity, it becomes increasingly challenging to keep track of your logs, and to correlate them with changes across other services in your environment. Forwarding your logs to a centralized log management platform allows you to extract critical insights from your logs and alert on specific snippets of log text or error rates. It also makes it possible to troubleshoot and investigate issues by correlating logs to application-level metrics and request traces, as well as data from related infrastructure components (e.g., IIS, SQL Server, Azure cloud services, etc.). Collect, process, and analyze C# logs alongside the rest of your stack with Datadog.
Collect, process, and analyze C# logs alongside the rest of your stack with Datadog.
To organize and quickly access the logs you need at any given time, you can configure an external monitoring service like Datadog to tail each log file so that you can aggregate all your logs in one place. As mentioned earlier, you can also use Serilog to stream logs directly to your Datadog account.
Once you're sending all your C# logs to Datadog, you'll see that your logs' JSON attributes have been automatically parsed and displayed in a format that's easy to understand. The Log Explorer also pulls in related information such as the host and service that generated the log, as well as tags from the cloud service that is hosting this server.
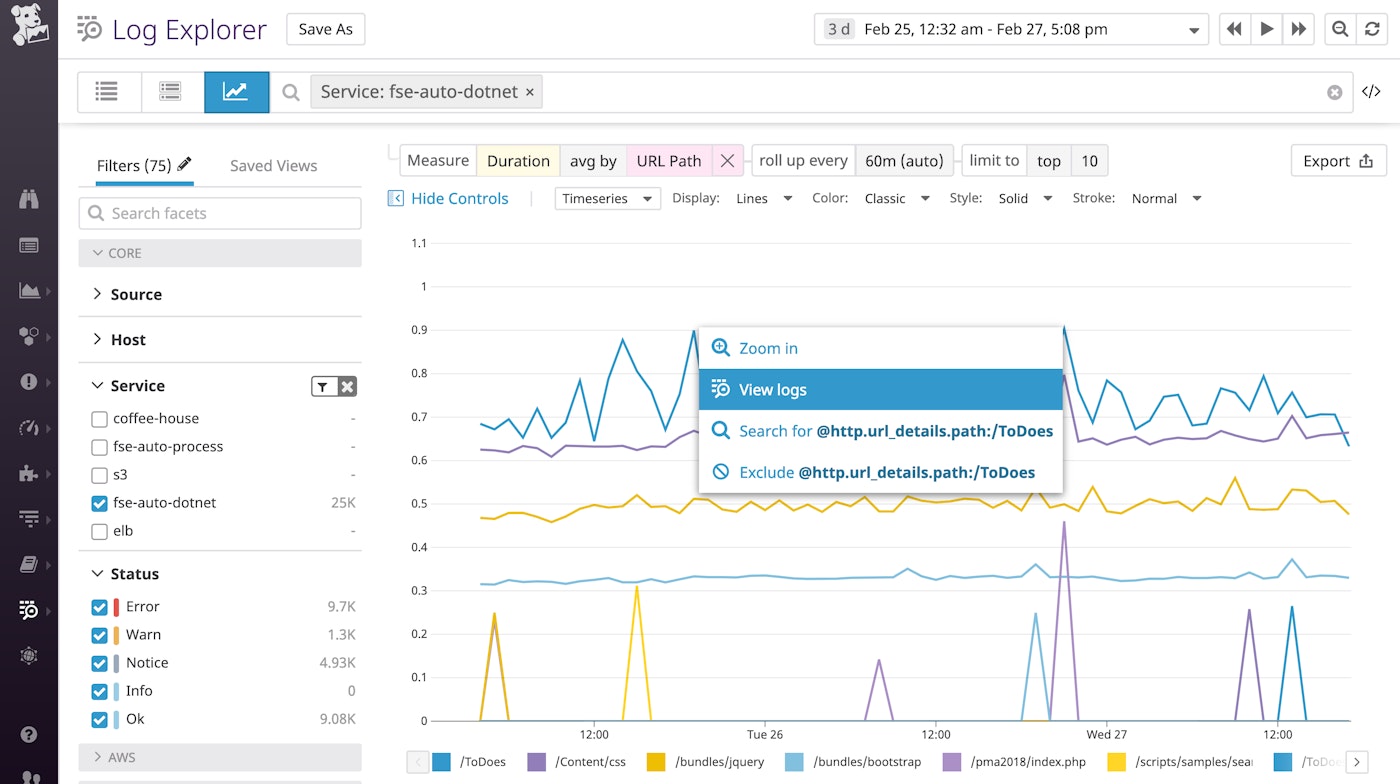
As your logs stream into your Datadog account, you can quickly make sense of them by using Log Analytics to analyze trends and visualize log data in timeseries graphs. You can even create metrics from log attributes, such as the request processing time recorded by web server logs in a .NET application. Below, we have broken down this log-based metric by URL path. From this graph, we can click to view logs that were collected from this application around one of the latency spikes.
Getting sharper insights into your C# logs
In this post, we've walked through some of the utilities and methods that can help you monitor your C# logs. Whether you're using self-hosted tools to manage your logs or forwarding them to a hosted service like Datadog, your logs can provide rich context that is invaluable for investigating and resolving user-facing issues. And if you're using Datadog to collect, process, and analyze all your C# logs, you can monitor them in context with other logs, metrics, and distributed request traces that you're collecting from other services in your environment. If you're not yet using Datadog, but you'd like to monitor C# application logs alongside the rest of your stack, you can start a free trial.


