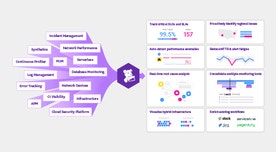
At this year’s DASH, we announced new products and features that enable your team to observe your environment, secure your infrastructure and workloads, and act to remediate problems before they affect customers. LLM Observability, which enables you to get deep visibility into your generative AI applications, is now generally available. The Datadog Agent now includes an embedded OTel Collector to provide native support for OpenTelemetry. With Data Security, you can discover sensitive data in your cloud data stores. You can ensure cost efficiency and workload performance with Datadog Kubernetes Autoscaling. And the next generation of Bits AI autonomously investigates incidents to help accelerate your remediation.
In this post, we recap these and other announcements from our keynote at DASH 2024. And read our other roundup posts to see what’s new from Datadog in the areas of:
Observe
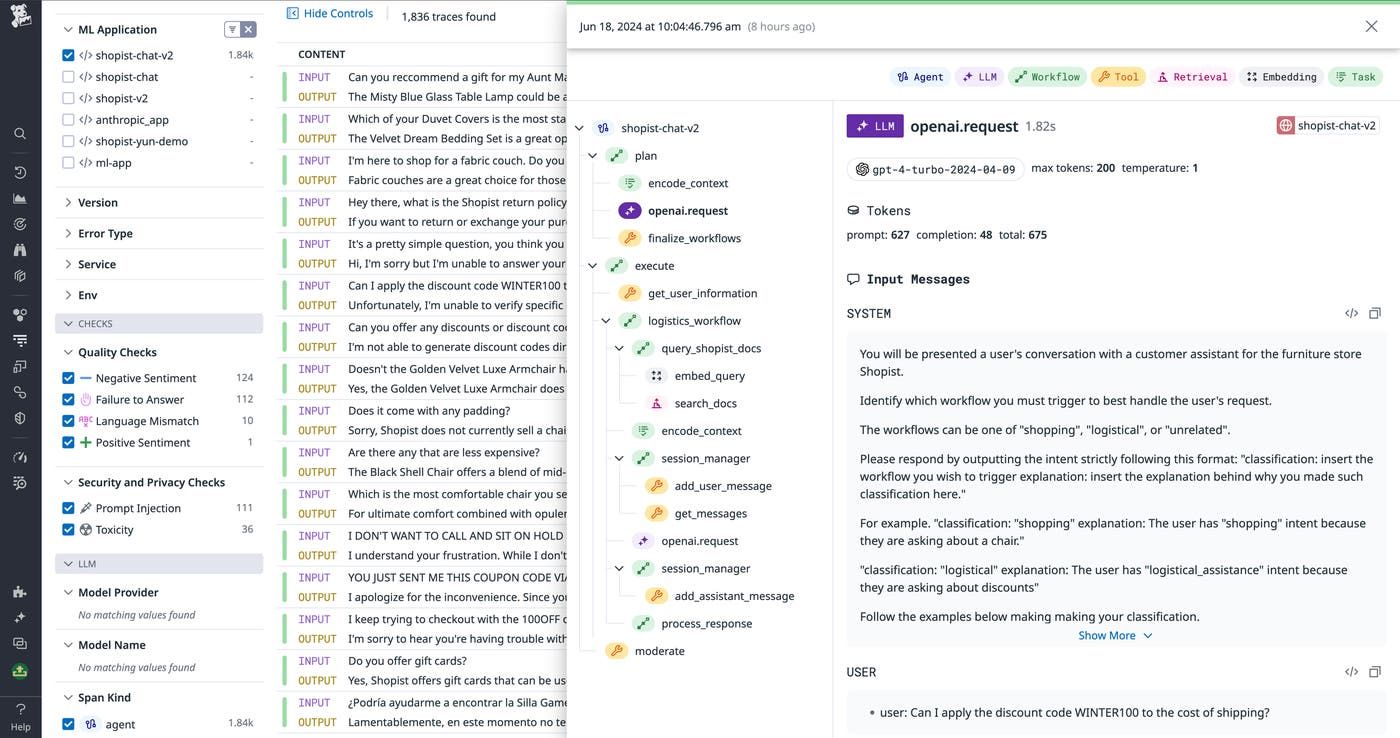
Monitor, troubleshoot, and secure your generative AI applications with LLM Observability
The development of LLM agents and chain-based LLM application architectures that rely on pre-trained models like GPT, Claude, and Gemini has helped many organizations more effectively adapt generative AI for their use cases. But running these complex LLM workflows in production and at enterprise scale presents many challenges and risks, particularly when it comes to diagnosing errors, evaluating model performance, and security. Datadog LLM Observability enables users to trace their LLM apps in order to diagnose errors across every chain component, evaluate functional performance, identify drifts in prompt topics and responses, mitigate prompt injections and personally identifiable information (PII) leakage, find sources of latency, and more. LLM Observability is now generally available—to easily monitor your LLMs in production, you can add it to your Datadog account. To learn more, read our blog post.
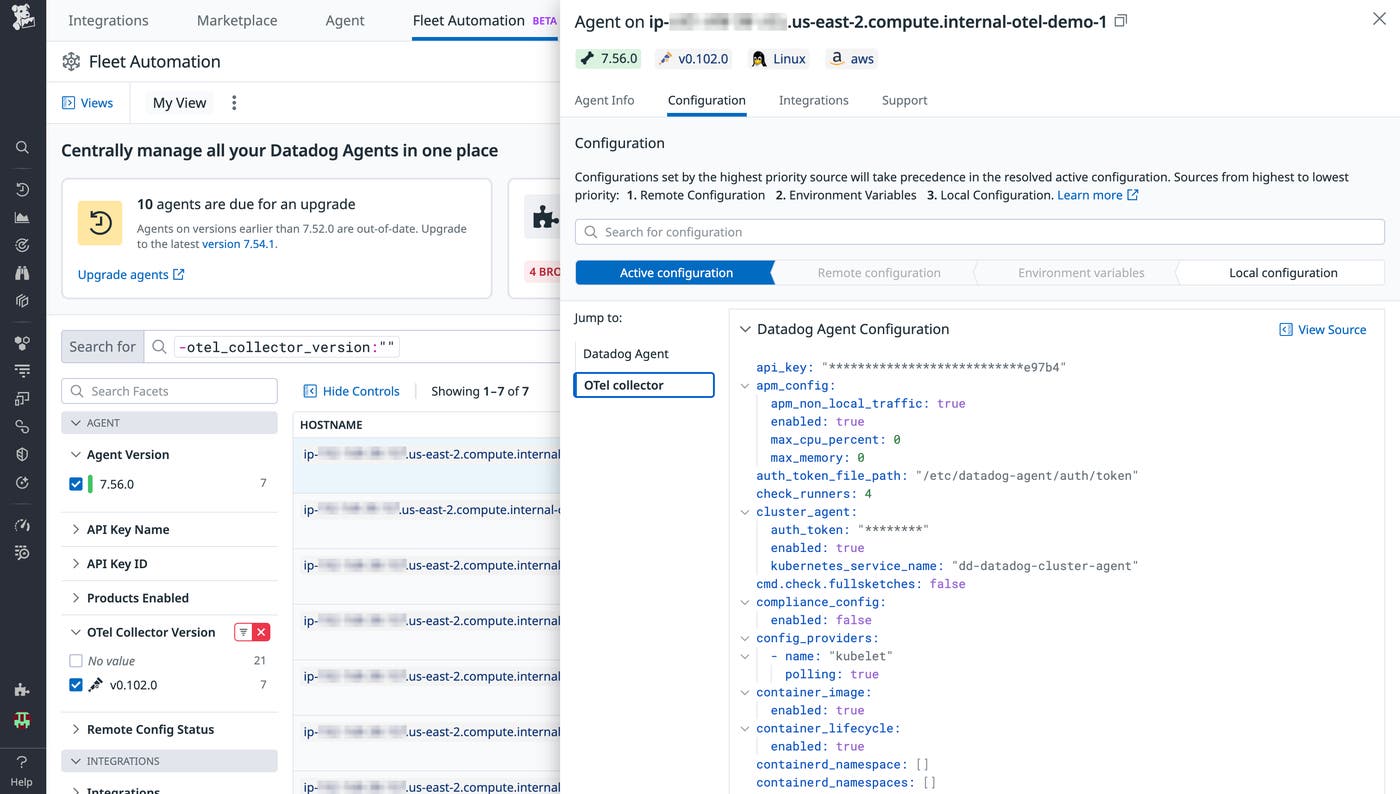
Unify your OpenTelemetry and Datadog experience with the embedded OTel Collector in the Agent
OpenTelemetry and Datadog are better together. That’s why the Datadog Agent now embeds a fully configurable OpenTelemetry (OTel) Collector, enabling users to take advantage of Datadog’s industry-leading observability solutions while accessing the complete capabilities of the OTel Collector. Users can also easily manage their fleet of embedded OTel Collectors with Datadog Fleet Automation and onboard faster with unified tagging. With Datadog’s enterprise-grade reliability and resources—including regular vulnerability scans, best practices, and prompt Agent updates—alongside community-managed OTel Collector releases, users can quickly troubleshoot configuration and software issues.
To learn more or request access, read our blog post or fill out this form.
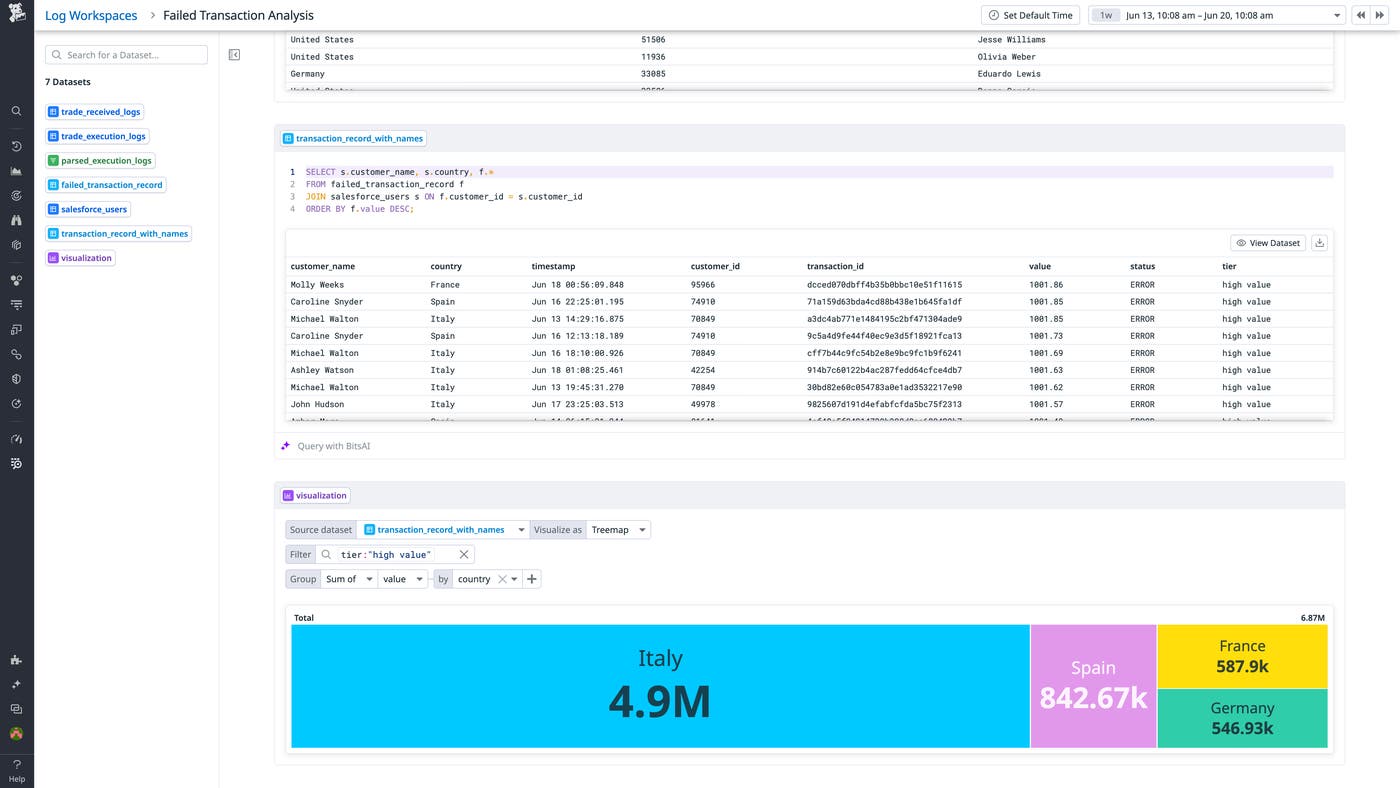
Take enhanced control of your log data with Log Workspaces
Delving into logs can be a matter of urgency for security, operations, and development teams, but it can also be a cumbersome task. Modern systems and applications churn out logs from countless sources, and these logs structure data in inconsistent and frequently unpredictable ways. As a result, when it comes to analysis, teams often turn to poorly integrated and highly specialized tooling. To help organizations take greater control of their logs, we’re pleased to introduce Datadog Log Workspaces. Building on the powerful capabilities offered by the Datadog Log Explorer, which helps teams swiftly navigate enormous volumes of log data, Log Workspaces enables anyone in your organization to parse, enrich, and analyze log data from any number of sources in clear and declarative terms using SQL, natural language, and Datadog’s visualizations. Log Workspaces is now in Preview. You can request access here, or learn more in our blog post.
Fix production bugs efficiently with Datadog Live Debugging
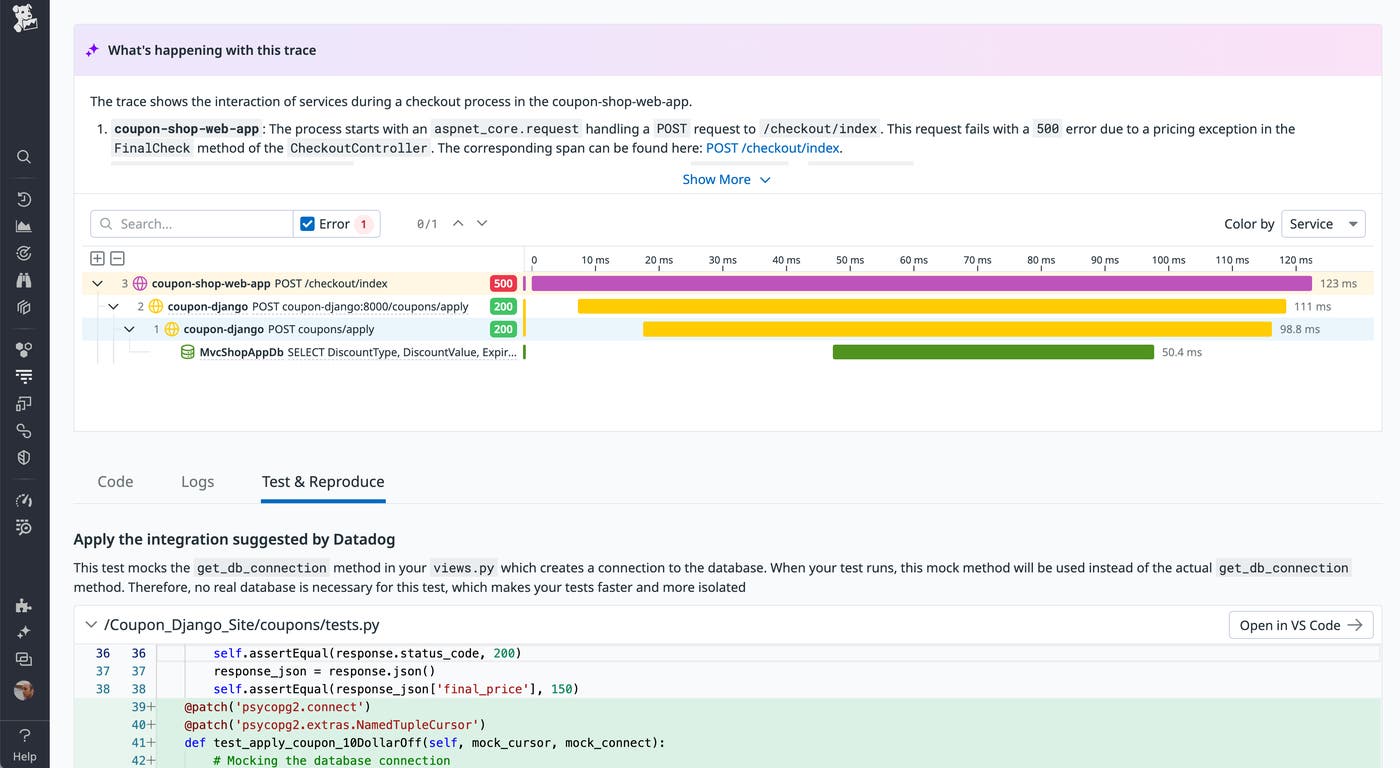
Production bugs demand immediate attention and often force you to shift to an alternate set of tools and processes to investigate, disrupting your development flow. Now, Datadog Live Debugging lets you maintain your flow and fix bugs efficiently. Live Debugging brings production context into your IDE, so you can see the values of local variables, quickly reproduce bugs locally, and easily generate integration tests to prevent a regression. Read more in our blog post and request access to the Preview here.
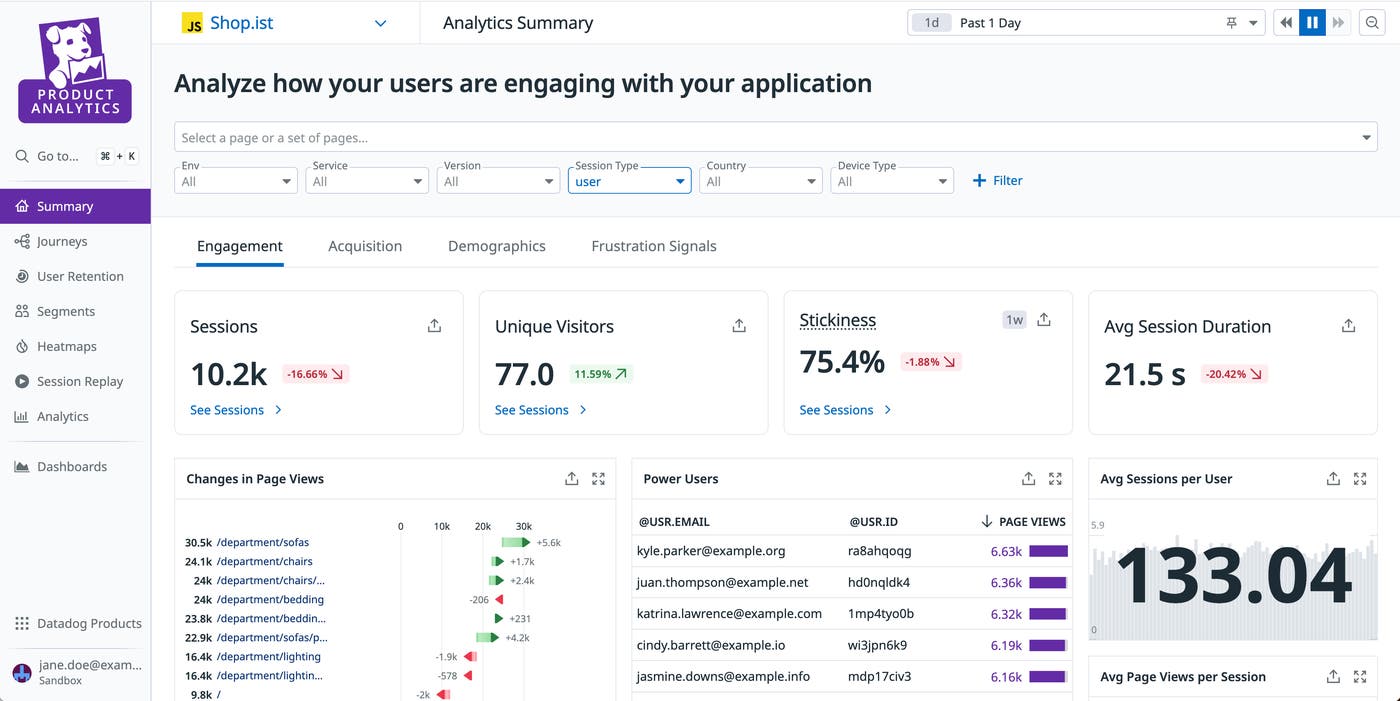
Make data-driven UX design decisions with Product Analytics
To understand any aspect of user behavior—from adoption and conversion rates to usage patterns and flows—you need to ground your insights in real user data. With Datadog Product Analytics, you can easily dig into user data from across your application and tailor your analyses based on the scope of your projects. You can visualize data on user engagement and interactions through a variety of features, including Heatmaps, Sankey, and Session Replay, helping you quickly assess your UX from multiple angles. To learn more about Product Analytics, check out our blog post and request access to the Preview here.
Secure
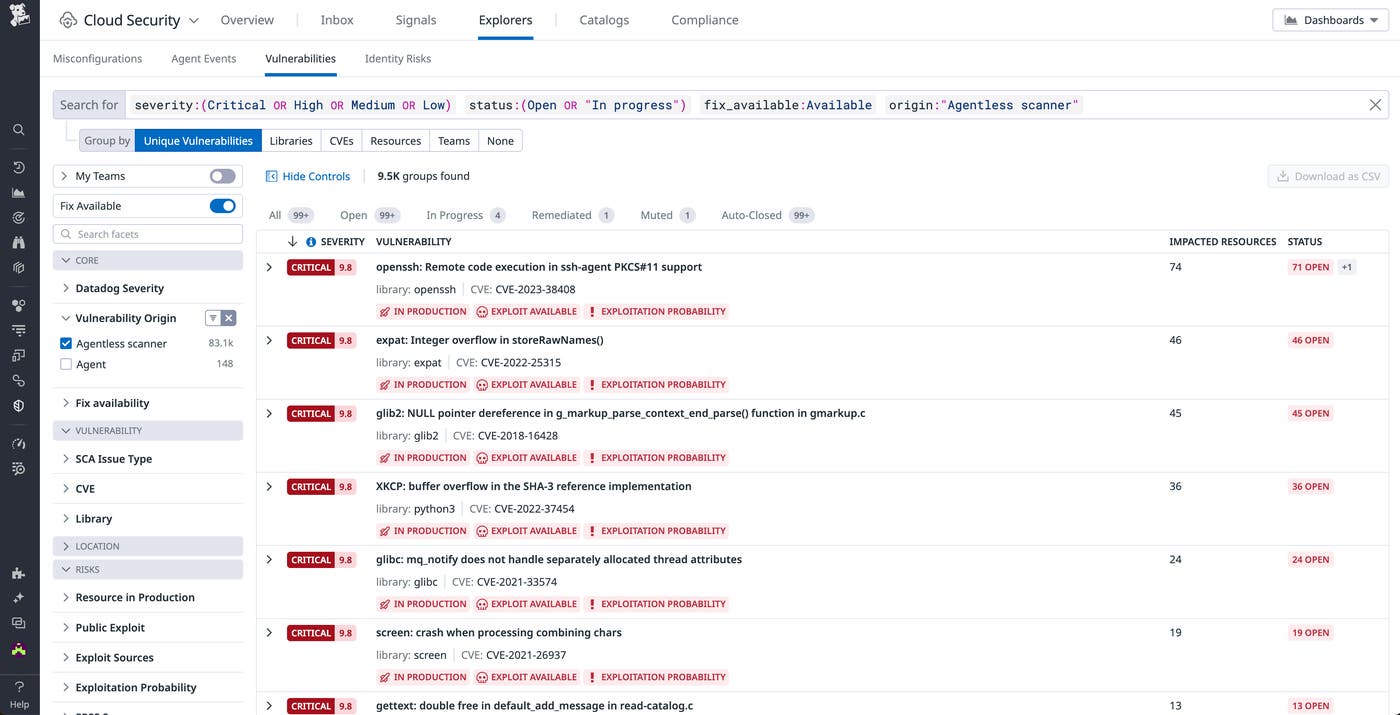
Detect vulnerabilities in minutes with Agentless Scanning for Cloud Security Management
In order to improve the security posture of their infrastructure and achieve compliance, security teams need to scan their entire production environment for vulnerabilities. But having to deploy an agent-based solution brings challenges to getting started quickly and reaching full coverage. Agentless Scanning, now generally available, enables development, security, and operations teams to get started using Datadog Cloud Security Management (CSM) to detect and remediate vulnerabilities across their cloud infrastructure in minutes. Learn more about Agentless Scanning in our blog post.
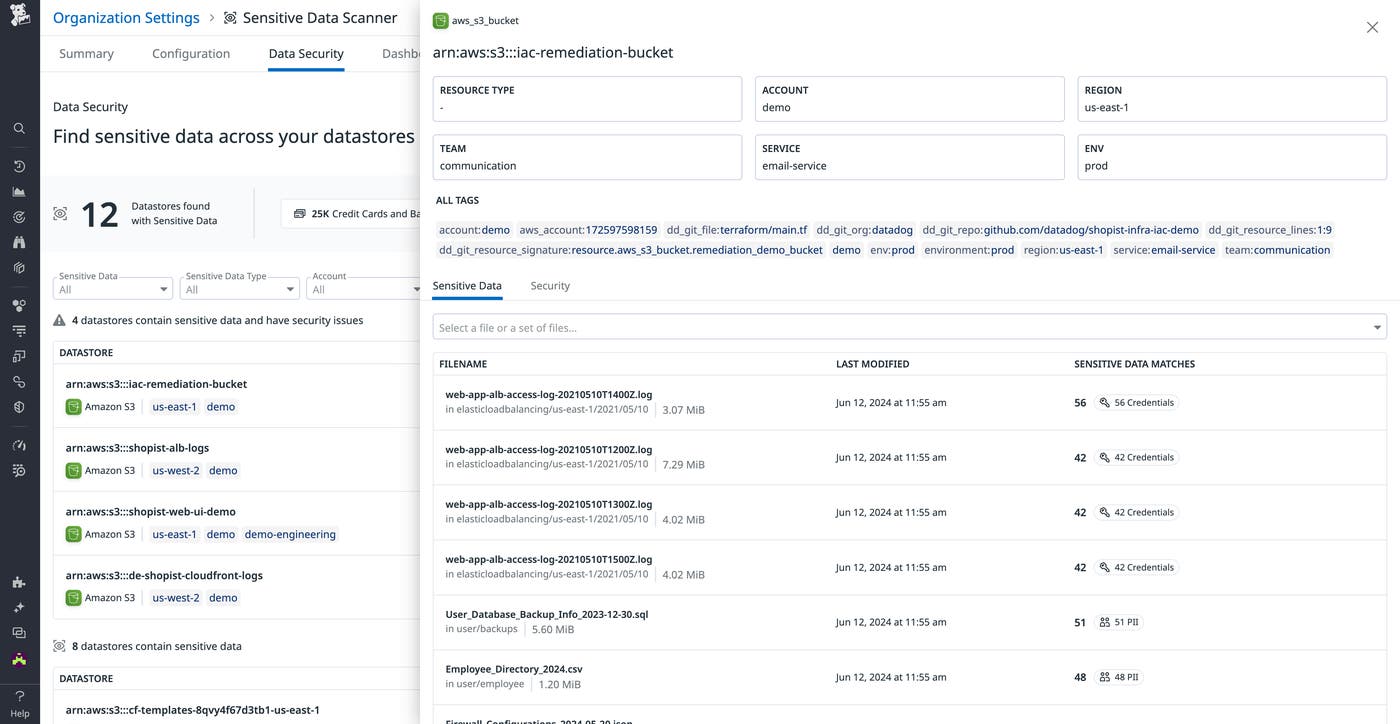
Discover sensitive data in your cloud data stores with Data Security
Securing personally identifiable information (PII) in the cloud—such as credit card numbers and login credentials—is essential for avoiding breaches and maintaining compliance standards. Datadog Data Security, now available in Preview, automatically pinpoints sensitive data in your AWS S3 buckets and RDS instances and helps you fix security issues affecting these cloud resources. By scanning your cloud environment for data that matches the rules determined by Sensitive Data Scanner, Data Security shows you which of your data stores contain PII and whether there are any security issues associated with these resources, so you can remediate them as soon as possible. Learn more in our blog post and request access to the Preview here.
Quickly find and fix misconfigured cloud resources in one click with infrastructure-as-code remediation
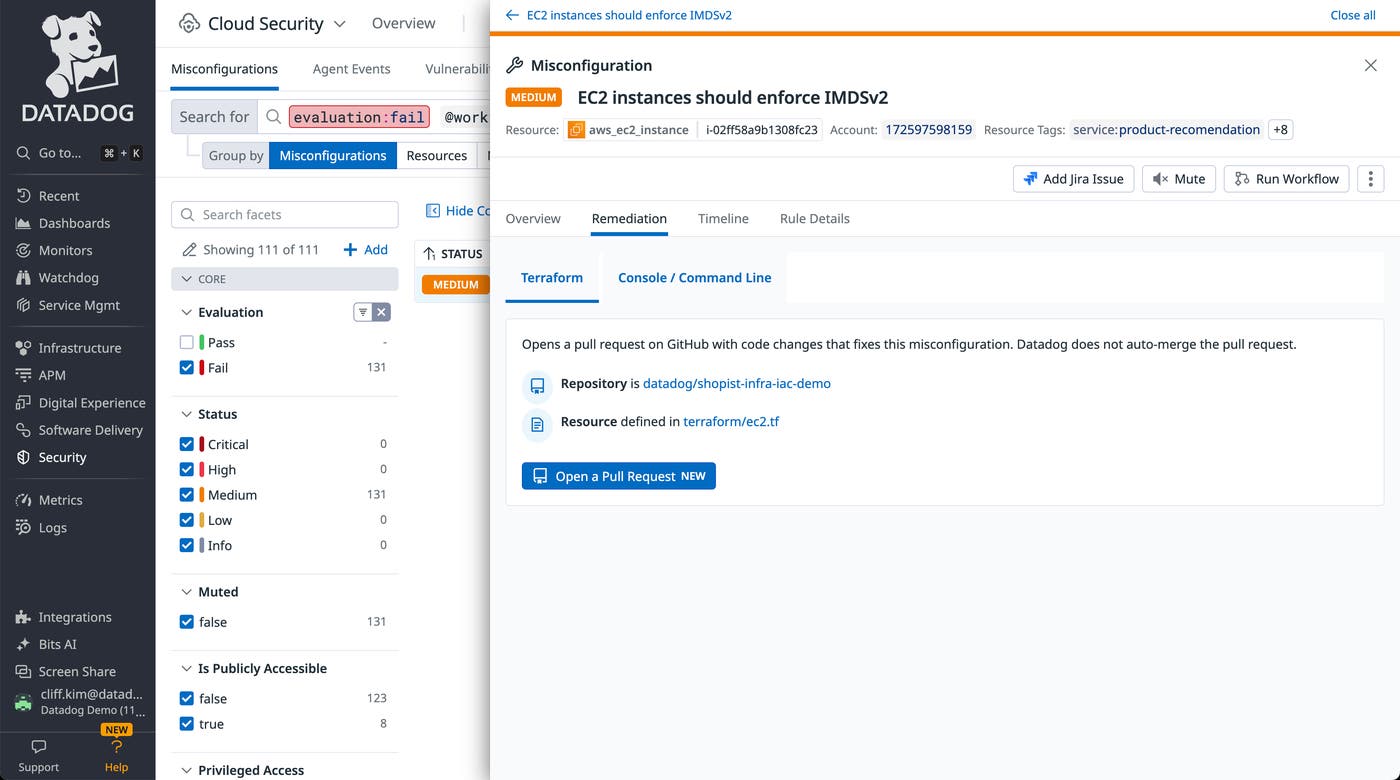
Today, teams have to fix misconfigured cloud resources directly through the console, or go through a long process of creating a ticket and waiting for the underlying infrastructure-as-code (IaC) to be fixed by the engineering team. The first option creates drift, which makes the situation worse. The second option is ideal, but can take time, during which your environment remains vulnerable. Now, once Datadog Cloud Security Management detects a misconfiguration, you can deploy a remediation with Datadog’s one-click IaC remediation, all from a centralized platform. One-click IaC remediations are now available in Datadog CSM. See our documentation to get started.
Detect and fix code-level vulnerabilities in production with Datadog Code Security
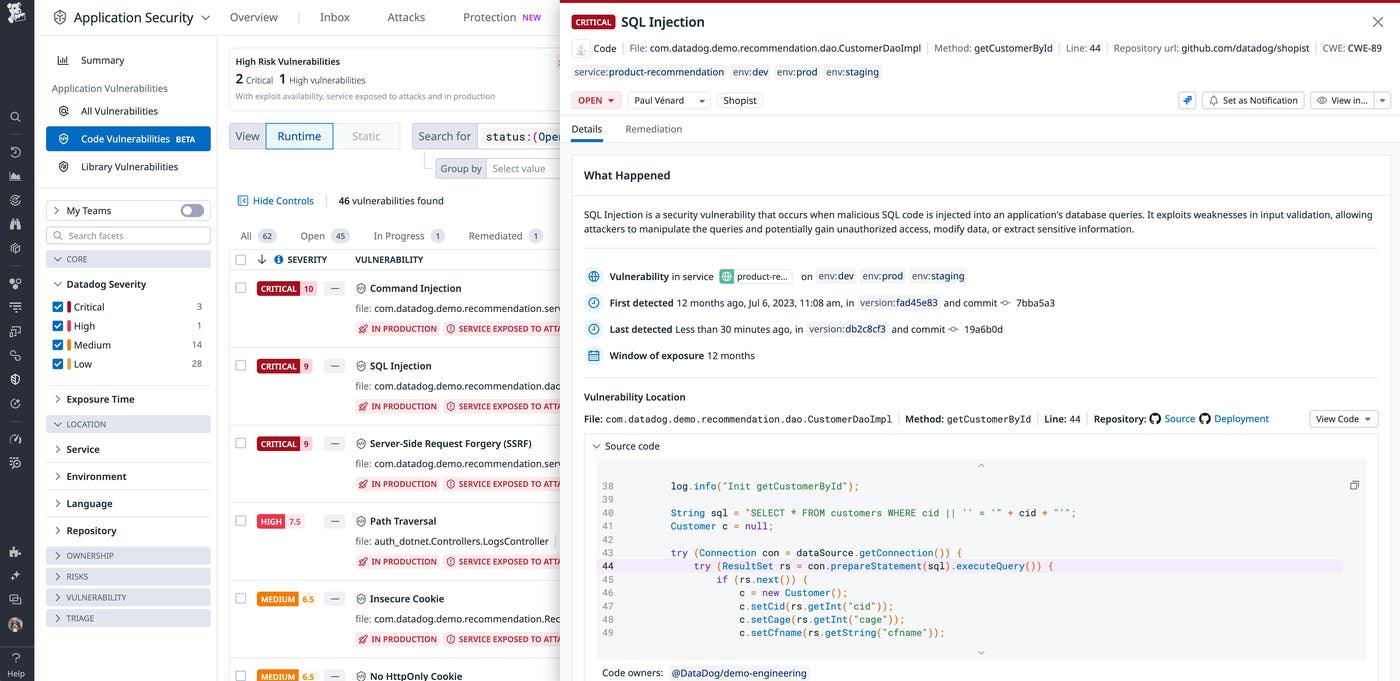
For security, development, and operations teams struggling with application security visibility, complexity, and actionable insights into production systems, Datadog Code Security offers a seamless solution that detects real code vulnerabilities in production environments by continuously monitoring your applications at runtime. With a unique, production-ready interactive application security testing (IAST) approach, Datadog Code Security enables DevOps and security teams to identify and prioritize the most critical vulnerabilities before they become costly breaches, all while providing actionable insights and recommended fixes. For more details and to get started, see our blog post and documentation.
Automate risk reduction in your software supply chain with Datadog SCA
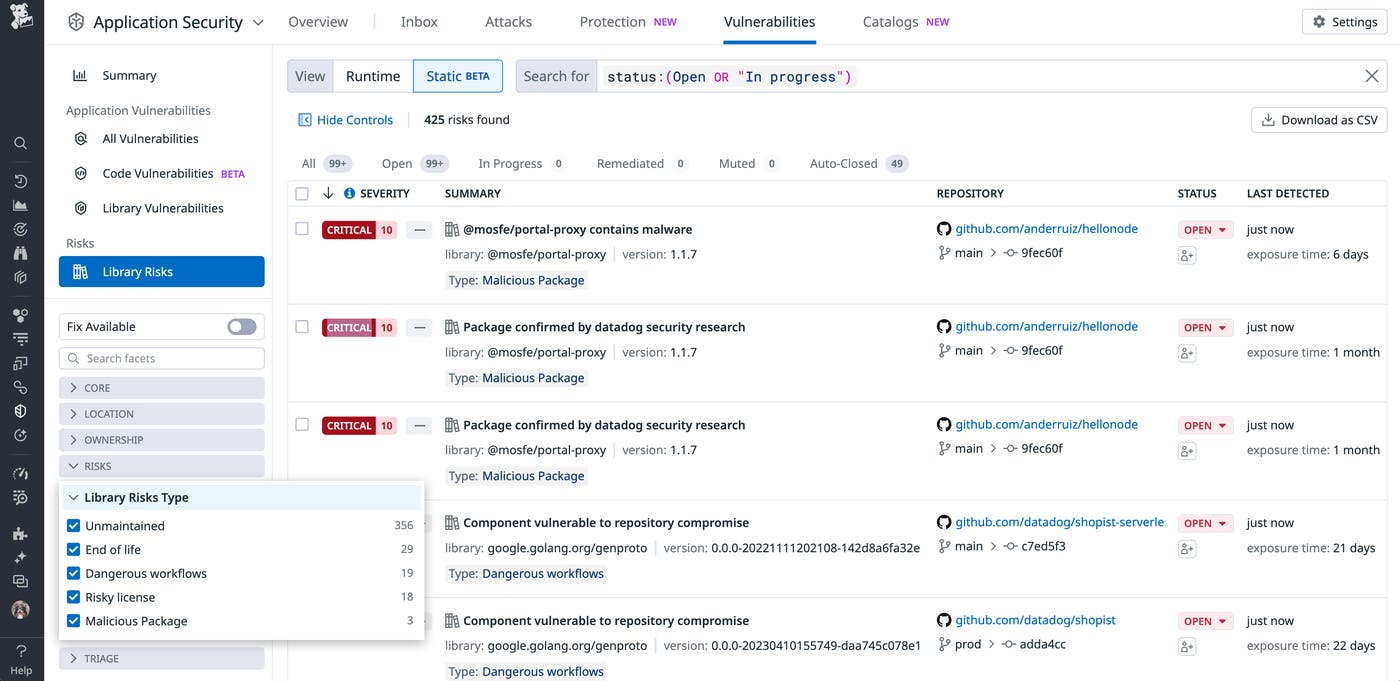
Modern cloud-native applications include a large proportion of open source code, which increases security risks. Manually implementing open source risk reduction practices is error-prone and can consume a large amount of time and resources. By using a combination of integrations that cover the entire software development lifecycle, Datadog SCA analyzes the open source and third-party components in your software applications to find vulnerabilities, malware, and other issues, including licensing and projects that follow poor hygiene. Now, customers will find any detected SCA risks in the Library Issues explorer and see all the attributes for each library in the ASM Library Catalog.
To learn more, check out our blog post and documentation.
Act
Scale your Kubernetes workloads automatically from Datadog
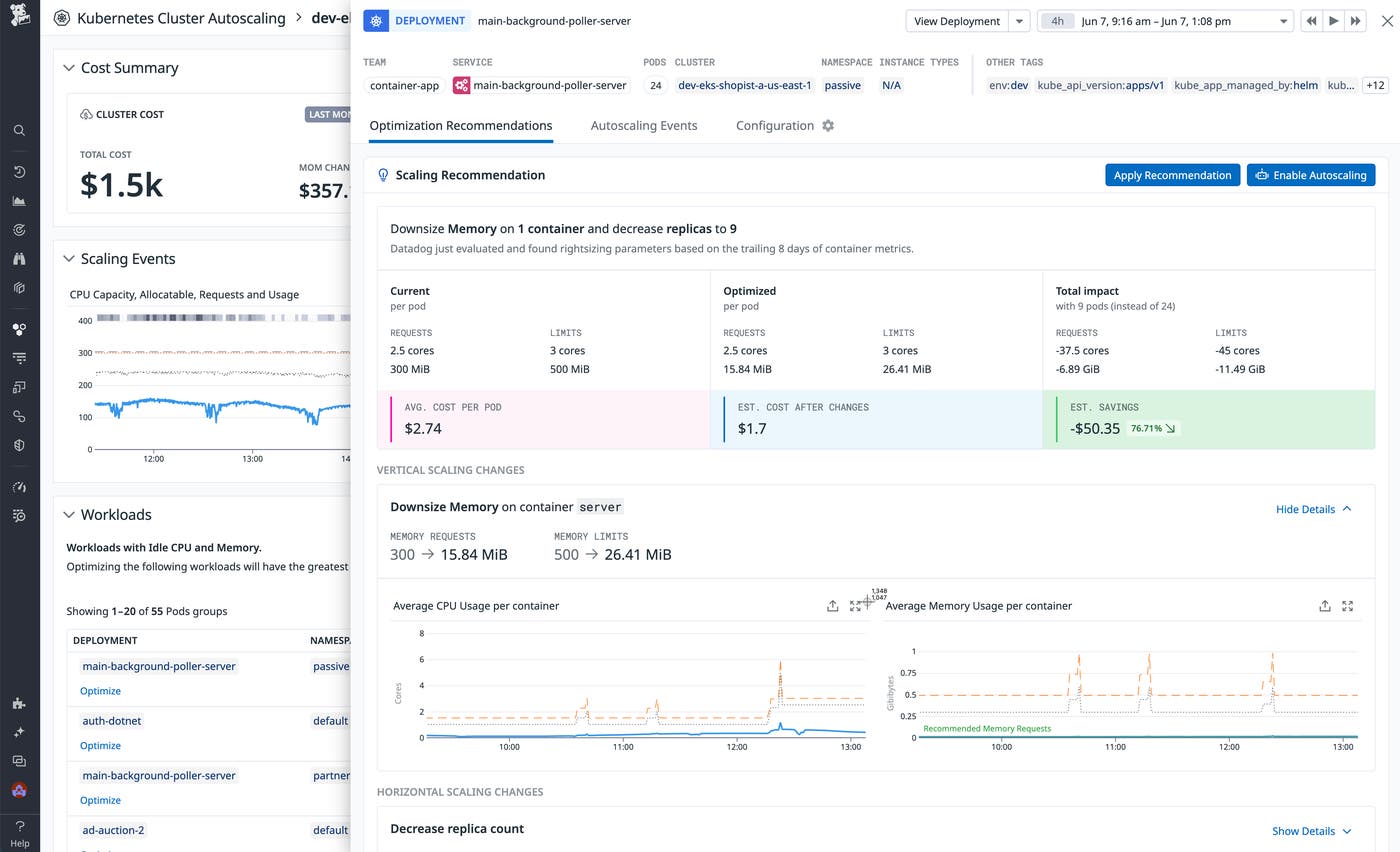
The vast majority of Kubernetes workloads are overprovisioned—as a result, rightsizing your workloads has the potential to deliver significant savings. However, balancing cost efficiency with cluster performance can be challenging. Datadog Kubernetes Autoscaling provides multi-dimensional rightsizing for your applications without impacting stability, with automation to easily manage your entire footprint and visibility into the Datadog telemetry backing each recommendation. Check out our blog post to learn more and request access to the Preview here.
Simplify incident response with Change Tracking on monitor status pages
Most incidents are triggered by changes. When a responder is troubleshooting an incident, one of the first questions they ask is, “Has anything changed recently?”
Datadog Change Tracking streamlines incident response by surfacing relevant changes and potential remediation steps from within the monitor status page. This experience, now in Preview, enables quick identification and resolution without leaving the monitor status page.
Change Tracking currently tracks:
- Deployments
- Feature-flag changes
- Watchdog Insights (faulty deploys, errors, etc.)
- Traffic anomalies
- Database schema changes (for Database Monitoring customers)
- Kubernetes pod crashes
For more information, see our documentation.
Accelerate incident remediation with autonomous investigations by Bits AI
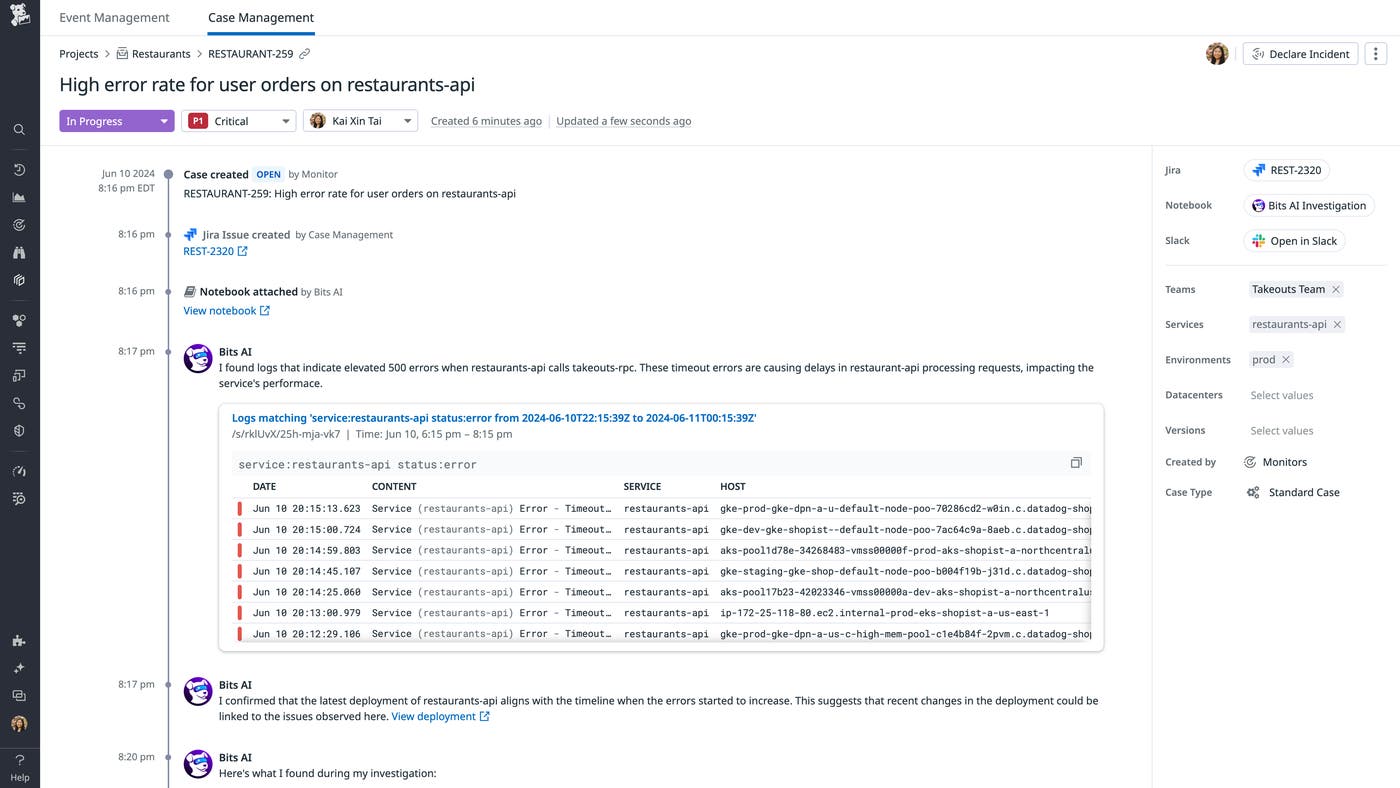
Last year, we introduced Bits AI, a generative AI-based chat interface capable of answering your observability and security questions. Today, we’re excited to announce the next evolution of Bits AI. Bits AI can now autonomously perform complex operational tasks such as investigating alerts and coordinating incidents. This latest version of Bits AI runs alongside you, anticipates your needs, and takes steps without requiring you to constantly prompt it with questions. Bits AI’s autonomous investigation capabilities are now available in Preview. For more details, see our blog post.
Enrich your on-call experience with observability data using Datadog On-Call
On-call engineers often need to navigate multiple tools and resources to effectively monitor and resolve high-stakes issues, which can quickly lead to burnout and inefficiency. Datadog On-Call seamlessly integrates monitoring, paging, and incident response onto one platform, enabling users to review pages alongside relevant observability data and important service and team ownership details to quickly triage alerts. With Datadog On-Call, organizations can also implement intuitive scheduling and escalation policies to easily manage on-call rotations and distribution of duties. And with detailed analytics, teams can access key page metrics such as the average response time for an alert to identify inefficiencies and ensure quicker time to resolution for future issues.
To learn more about Datadog On-Call, check out our blog, or request access to the Preview.


