- 製品
インフラストラクチャ
アプリケーション
データ
ログ
セキュリティ
- 概要
- Code Security
- Software Composition Analysis
- Static Code Analysis (SAST)
- Runtime Code Analysis (IAST)
- IaC Security
- Cloud Security
- Cloud Security Posture Management
- Cloud Infrastructure Entitlement Management
- Vulnerability Management
- Compliance
- Cloud SIEM
- Workload Protection
- App and API Protection
- Sensitive Data Scanner
- Security Labs Research
- Open Source Projects
- Secret Scanning
デジタル エクスペリエンス
ソフトウェア デリバリ
サービス管理
AI
プラットフォーム機能
- お客様
- 価格設定
- お客様事例
- 金融サービス
- 製造 / 物流
- ヘルスケア / ライフサイエンス
- 小売業 / E コマース
- 行政機関
- 文教・教育
- メディア / エンターテインメント
- テクノロジー
- ゲーミング
- Amazon Web Services モニタリング
- Azure モニタリング
- Google Cloud モニタリング
- Oracle Cloud モニタリング
- Kubernetes モニタリング
- Red Hat OpenShift
- Pivotal プラットフォーム
- OpenAI
- SAP モニタリング
- OpenTelemetry
- アプリケーション セキュリティ
- クラウド移行
- モニタリング統合
- Unified Commerce モニタリング
- SOAR
- DevOps
- FinOps
- シフトレフト テスト
- デジタル エクスペリエンス モニタリング
- セキュリティ分析
- CIS ベンチマークのコンプライアンス
- ハイブリッド クラウド モニタリング
- Edge Device Monitoring
- リアルタイム BI
- オンプレミス モニタリング
- ログ分析と相関
- CNAPP
業界
テクノロジー
使用例
- 会社情報
- ブログ
- ドキュメント
- ログイン
- 開始する
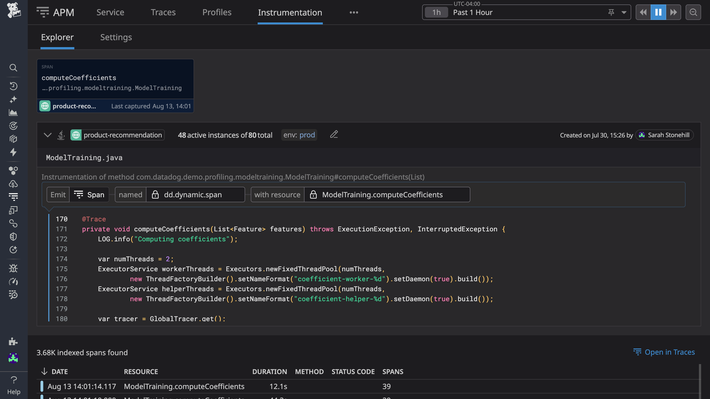
Observability
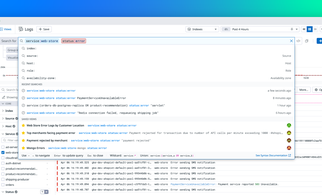
動的インスツルメンテーション
コードを変更することなく、アプリケーションのログ、スパン、メトリクス、スパンタグを Datadog で即座に生成