Evan Mouzakitis
It is essential to tag your metrics when monitoring large-scale infrastructure. Tags (aka labels) are a foundational concept in hyper-scale operations like Google's internal orchestration project, Borg, Kubernetes, and Datadog.
Tags are key to modern monitoring because they allow you to aggregate metrics across your infrastructure at any level you choose.
By adding tags to your metrics you can observe and alert on metrics from different hardware profiles, software versions, availability zones, services, roles—or any other level you may require.
Tags give you the flexibility to add infrastructural metadata to your metrics on the fly without modifying the way your metrics are collected.

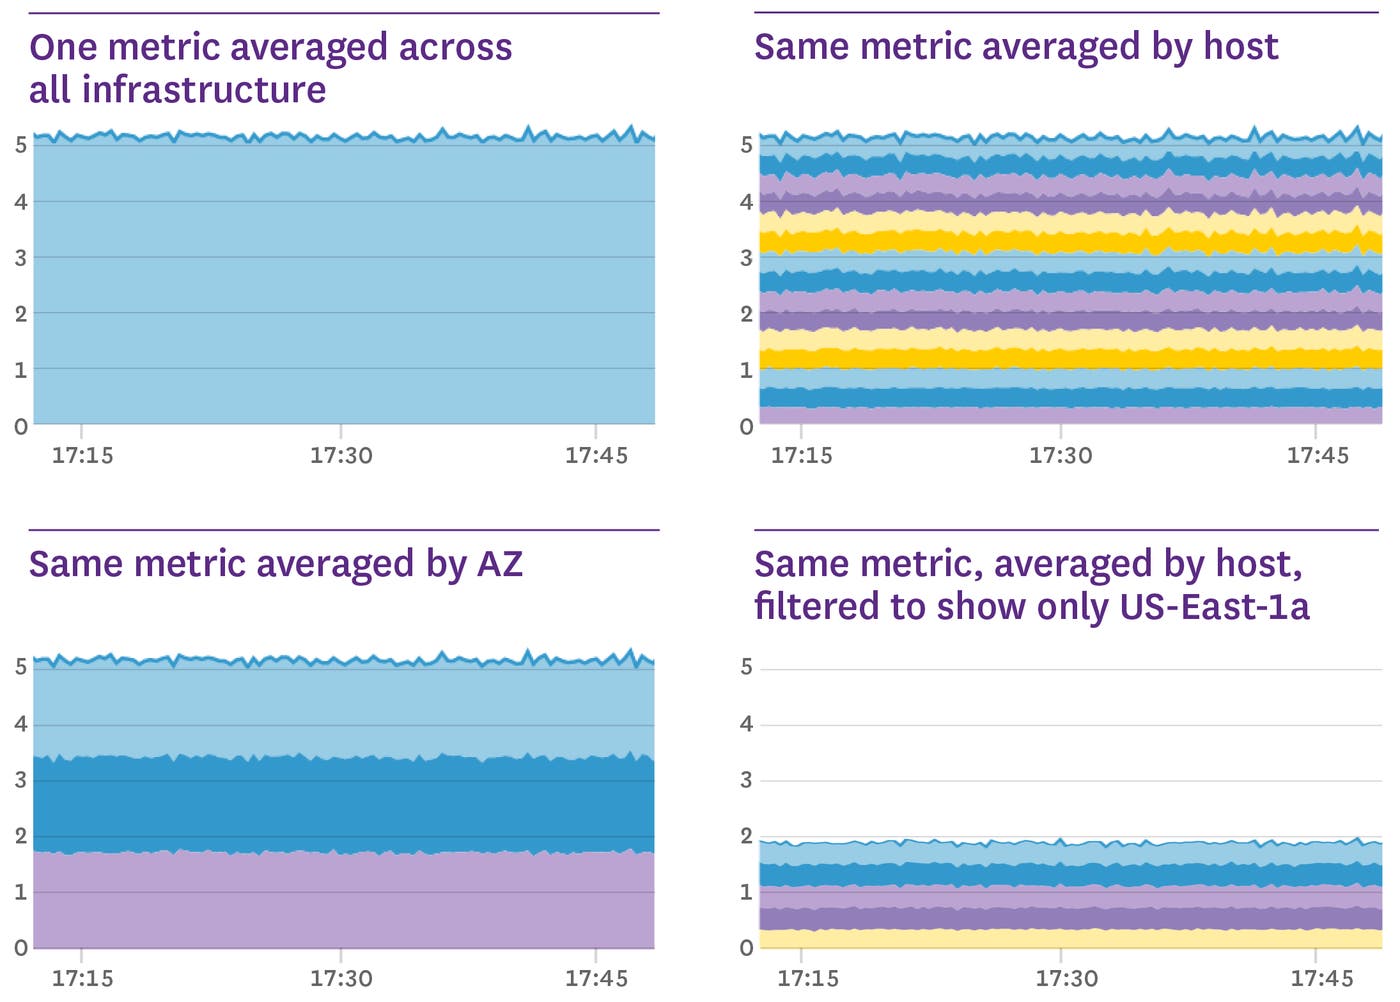
In the series of graphs above, each graph represents the same metric in the same time frame, but with different aggregations. With metric tags, one metric can be aggregated to an arbitrary level of abstraction.
What's a metric tag?
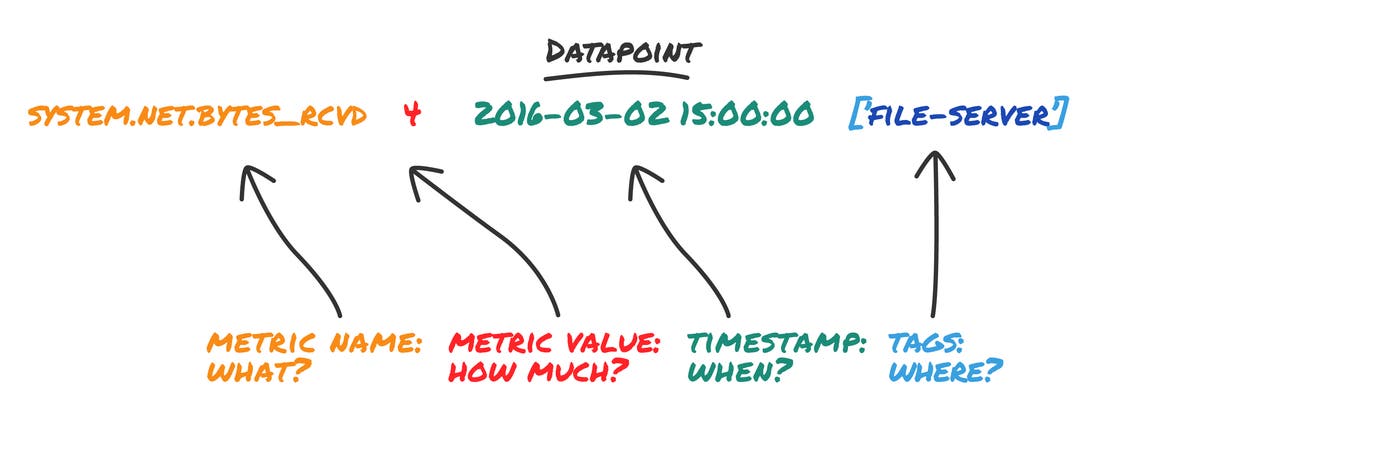
A timeseries is a particular sequence of datapoints over time, and is often visualized as a graph. A datapoint is at least: a metric name, a metric value, and the time at which the value was collected. But in Datadog, a datapoint also includes tags, which declare all the various scopes the datapoint belongs to. Here's an example:

By filtering and grouping by different combinations of a datapoint's tags, the same datapoint can be part of multiple different timeseries. For example, the datapoint directly above is part of all four timeseries graphs at the top of this article, whether as part of an aggregated group or as a host-level datapoint.
Filtering with simple metric tags
The following example shows a datapoint with the simple tag of file-server:

Simple tags can only be used to filter datapoints: either show the datapoint with a given tag, or do not.
Creating new dimensions with key:value tags
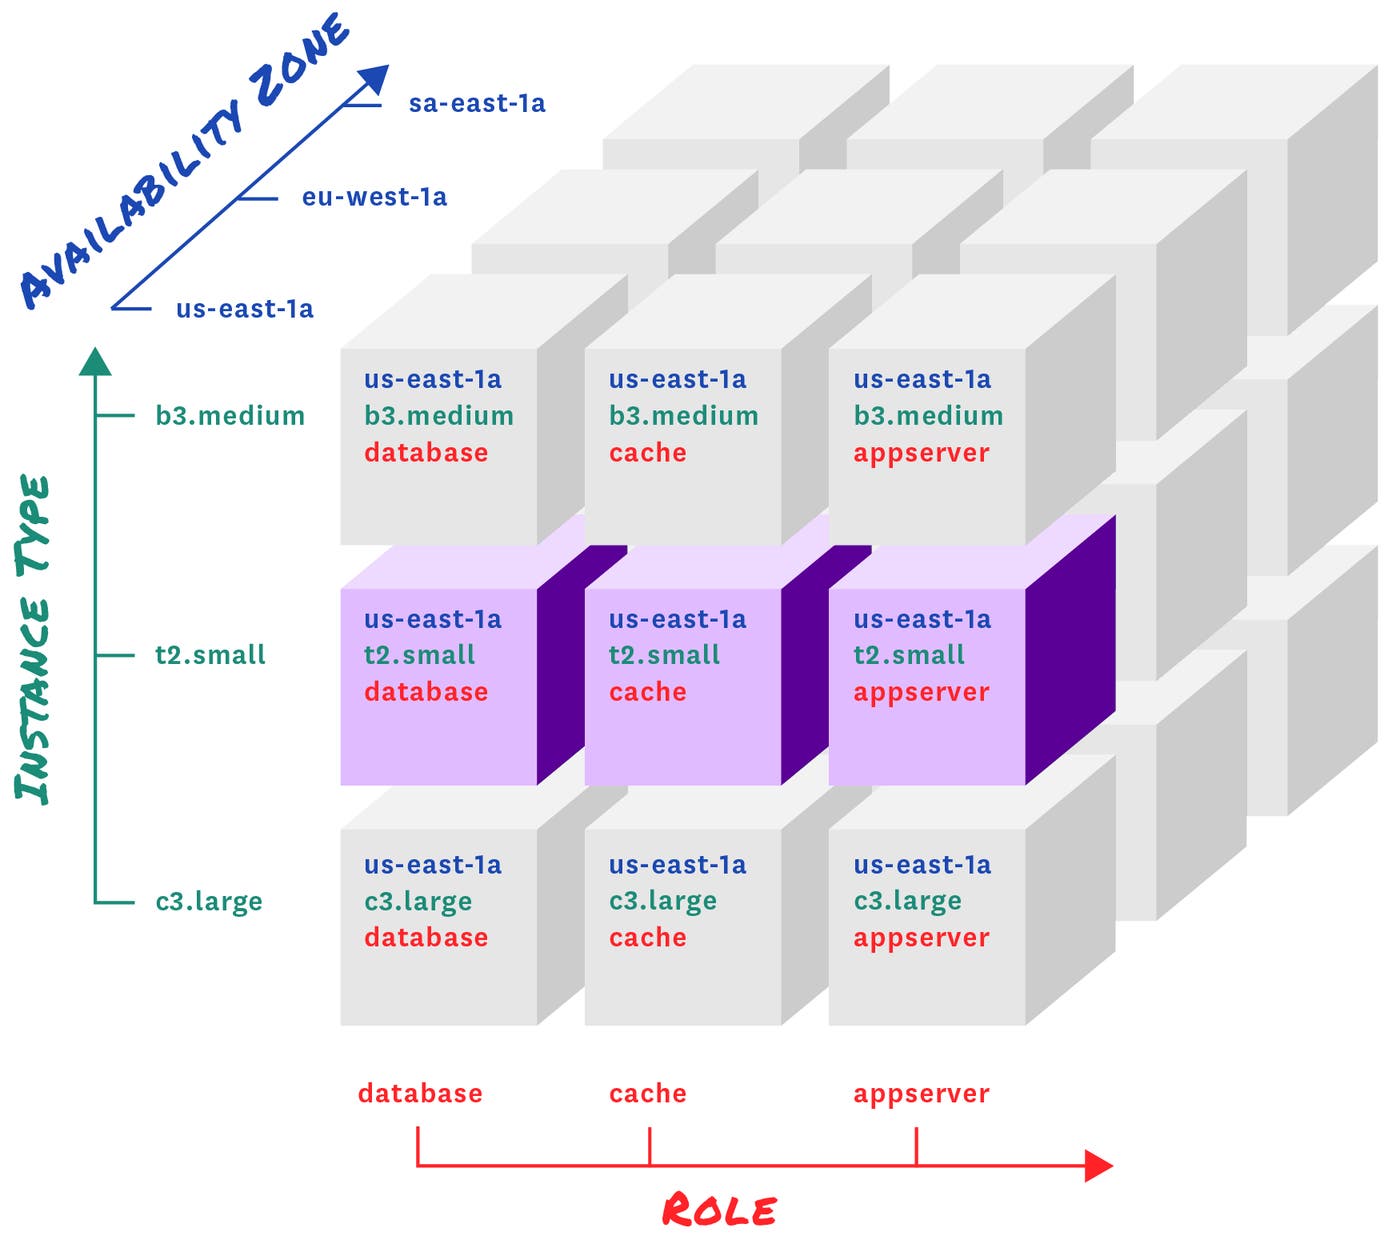
When you add a key:value tag to a metric, you’re actually adding a new dimension (the key) and a new attribute in that dimension (the value). For example, a metric with the tag "instance-type:m3.xlarge" declares an "instance-type" dimension, and gives the metric the attribute "m3.xlarge" in that dimension.
When using key:value tags, the "key" selects the level of abstraction you want to consider (e.g. instance type), and the "value" determines which datapoints belong together (e.g. metrics from instance type m3.xlarge).

If you add other metrics with the same key, but different values, those metrics will automatically have new attributes in that dimension (e.g. "m3.medium").
Once your key:value tags are added, you can then slice and dice in any dimension. You can even add new dimensions (keys) on the fly, via our API.
Monitoring as dynamic as your infrastructure
In modern environments, infrastructure is constantly in flux: auto-scaling servers die as quickly as they're spawned, and containers come and go with surprising frequency. With all of these transient changes, the signal-to-noise ratio can become quite low. In most cases, you don't want to focus your monitoring at the level of the host, VM, or container. You don't care if a specific instance goes down, but you care if latency for a given service, category of customers, or geographical region goes up, for example.
Metrics tagged automatically
Datadog will automatically detect important metadata about your infrastructure and tag metrics with that metadata.
For example, if you capture a metric for myapp.shoppingcart.transactions, Datadog can automatically add the right role: tag from Chef, the right availability-zone: and instance-type: from AWS, the right labels from Google Cloud, etc. All this happens automatically at runtime—not at development time, and the tags are constantly refreshed in real-time, so you always see the most up-to-date information.

Customizable tags
You can also easily add your own simple or key:value tags from within Datadog or even programmatically via API. For example, if you have non-standard infrastructure or want to track your own in-app metrics, you can add exactly the tags you need.
Tags decouple collection and reporting
Imagine your metrics were not tagged. They would probably look something like this: system.cpu.usage.foo.us-east-1a
The problem with this solution is that infrastructure profile is hardcoded into the metric, which means developers must know where their code will run. If you want to add more dimensions, every metric must be updated with the additional scope, and new code must be deployed. The more scopes you have, the more unmanageable this name-encoding scheme becomes.
How would you aggregate for a high-level overview like CPU usage in US-East-1? Maybe like this: system.cpu.usage.foo.us-east-1a + system.cpu.usage.bar.us-east-1a + system.cpu.usage.baz.us-east-1a + …
Now, not only is aggregation manual, but you need to know exact metric names down to the availability zone. That solution simply doesn't scale to cloud-proportions.
With metric tags, you don't even need to know the values of key:value tags. You can just aggregate using that key, and every value in use will automatically appear as its own timeseries.
Say goodbye to manual aggregation: just choose a metric and a tagged scope and let Datadog do the aggregation for you under the hood.
Try it yourself
Once you start using metric tags, we think you’ll find that it’s hard to live without them. If you’re using one of our 1,000+ integrations, chances are you’re already taking advantage of tags, because they come out of the box with a host of tagged metrics. If you’re submitting your own metrics via API or StatsD, you can start tagging your metrics today!
Try using tagged metrics in Datadog today with a 14-day free trial, or learn more about standardizing tags with Datadog.

