
What Is Infrastructure Monitoring?
Infrastructure monitoring is used to collect health and performance data from servers, virtual machines, containers, databases, and other backend components in a tech stack. Engineers can use an infrastructure monitoring tool to visualize, analyze, and alert on metrics and understand whether a backend issue is impacting users. In this article, we’ll explain how infrastructure monitoring works, its primary use cases, challenges to keep in mind, and tools to help you get started.
How Infrastructure Monitoring Works
Infrastructure monitoring tracks the availability, performance, and resource utilization of hosts, containers, and other backend components. Engineers typically install software, called an agent, on their hosts. Hosts may include physical servers, also called bare metal servers, or virtual machines which use the resources of a physical server. The agent collects infrastructure metrics from hosts and sends the data to a monitoring platform for analysis and visualization. Infrastructure monitoring provides visibility into the health of backend components that run your applications, allowing you to ensure that critical services are available for users and that they work as expected.
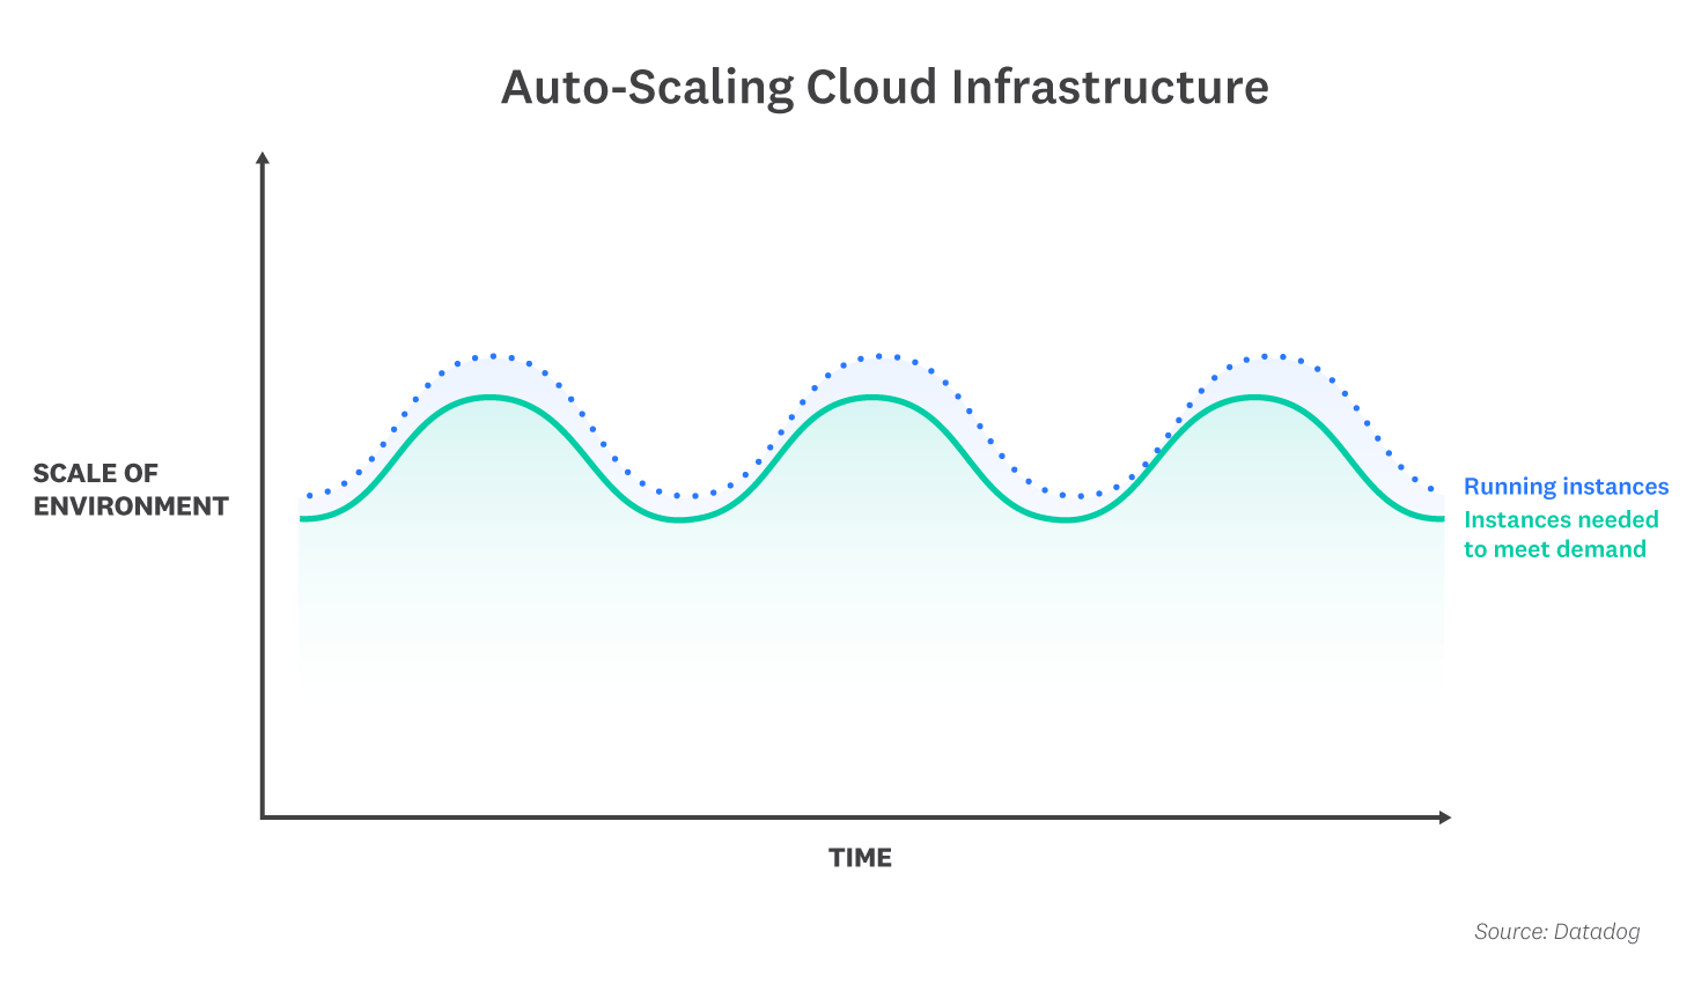
Traditionally, organizations managed their own on-premise physical servers, which had fixed IP addresses. In the cloud, engineers can spin up or replace servers on demand. The adoption of cloud infrastructure has fundamentally changed how infrastructure monitoring works. In such dynamic environments, engineers often need to monitor ephemeral infrastructure components rather than static, individual hosts. Engineers also need insight into meaningful subsets of their infrastructure, such as hosts in a specific region.
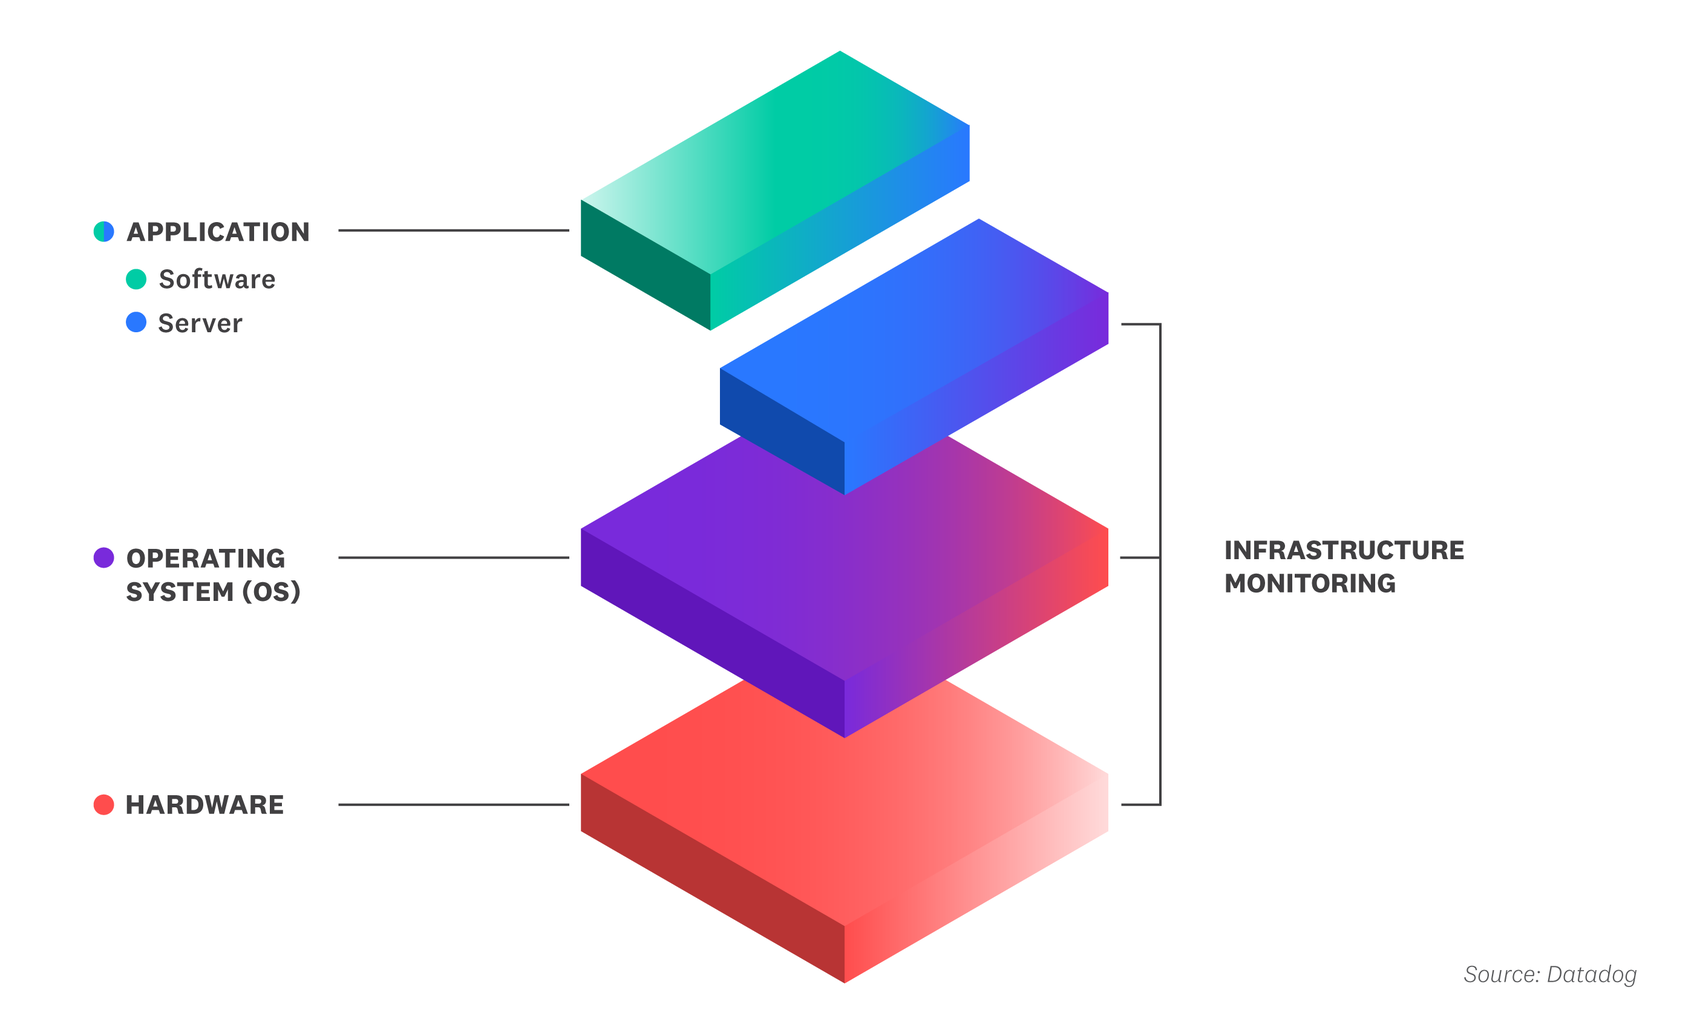
Infrastructure monitoring provides visibility across multiple layers of the tech stack, including the hardware, the operating system (OS), and the application server. The hardware layer includes the physical components, such as memory chips and the processor, that your backend components use to function. The OS is an intermediary between the hardware and application layers. It provides a user interface, executes the applications, and controls how the host uses CPU and other resources. The application server is the host that generates content for client applications and services.
Typically, engineers use an infrastructure monitoring platform to assess if their backend components are causing a user-facing problem, such as a 5xx error code. To investigate why, they can then dig into the following resource metrics from their backend:
- CPU Utilization
This indicates the percentage of processing capacity that a host is using to handle computing tasks. When an application is unusually slow or times out, this may indicate that the host is underprovisioned, lacking sufficient CPU to quickly process requests and manage other tasks.
- Memory Utilization
This indicates the number of objects or bytes that the host has in short-term storage to run a program. When a host utilizes all of its memory, it can no longer accept or serve further requests.
- Storage Use
This indicates the amount of disk that the host is using to store files, images, and other content. Items can be copied from storage to short-term memory when they’re needed to run a program. When a host runs out of disk space, you may lose data or the underlying application may fail.
To take an example, let’s say users complain that a web application isn’t responding. Using an infrastructure monitoring tool, an engineer may determine that enough CPU hasn’t been allocated for the web application or that runaway processes are monopolizing the host’s CPU. To resolve the issue, the engineer may want to allocate more CPU for the web application or stop the runaway processes so the web application has enough resources to run.
Use Cases of Infrastructure Monitoring
An organization’s applications and services can only work well for users when the underlying backend infrastructure is healthy. Infrastructure monitoring allows engineers to spot and prevent problems anywhere in the backend, which minimizes downtime and service degradation for users.
Operations teams, DevOps engineers, and site reliability engineers (SREs) typically rely on infrastructure monitoring to help them:
- Troubleshoot performance issues
Infrastructure monitoring is commonly used to prevent incidents from escalating into outages. An infrastructure monitoring tool can show which hosts, containers, or other backend components failed or experienced latency during an incident. When an outage does occur, engineers can determine which hosts or containers were responsible. This helps teams resolve support tickets and address customer-facing issues.
- Optimize infrastructure use
Infrastructure monitoring can also be used to proactively lower costs. For example, if some of your servers are overprovisioned or sitting idle, you can decommission them and run the associated workloads on fewer hosts. You can also balance your infrastructure usage by directing requests from underprovisioned hosts to overprovisioned ones.
- Forecast backend requirements
Organizations can predict future resource consumption by reviewing historical infrastructure metrics. For example, if certain hosts were underprovisioned during a recent product launch, you can configure more CPU and memory in the future during similar events to reduce strain on key systems and reduce the likelihood of revenue-draining outages.
Challenges of Infrastructure Monitoring
Given the complexity of many companies’ backend systems, it can be challenging to find a suitable infrastructuring monitoring tool, especially when an organization migrates to the cloud or relies on cloud infrastructure. Legacy infrastructure monitoring tools are used primarily in on-premise environments and tend to focus on individual hosts. This “host-centric” approach works when host counts and IP addresses are relatively static, but isn’t well suited to monitoring containers, serverless functions, and other cloud-native components that automatically scale up and down in response to demand. For example, in a serverless architecture, you can’t even access the servers that run your code, so there’s nowhere to install a monitoring agent.
Most legacy tools don’t integrate with cloud services because they are not capable of authenticating access to cloud-based metrics with an API. Even if a limited integration exists, many legacy tools require you to manually SSH into cloud servers to retrieve infrastructure metrics, which takes significant time and expertise.
Cultural silos between teams present another challenge. If Dev and Ops teams use different monitoring tools, they may disagree about which performance issues to fix and how to fix them. For example, the Ops team may identify that a particular service is using too much CPU or memory, but they may not be able to determine whether the code is causing the problem because they don’t have access to the Dev team’s monitoring tool. If both teams use the same monitoring tool, it’s easier to find the root cause of the resource consumption problem and determine whether to prioritize a fix. The teams can work together even more seamlessly if the tool correlates infrastructure and application performance metrics.
For many organizations, infrastructure monitoring is just one part of a complete monitoring solution. To troubleshoot effectively, you often need to view infrastructure monitoring data alongside data from your applications, network, and other parts of your stack. A comprehensive monitoring solution will give you context into the root cause of a problem—whether it’s a host that consumed too many resources, a bug in your application code, a connectivity issue, or something else altogether.
eBook: Monitoring Modern Infrastructure
Choosing an Infrastructure Monitoring Tool
When choosing an infrastructure monitoring tool, consider one that offers the following features:
- Cloud-native and autoscaling support
If you utilize serverless functions, containers, or cloud services in your stack, you’ll need to use an infrastructure monitoring tool that integrates with third-party cloud providers and orchestration tools. To track ephemeral, autoscaling cloud resources, some infrastructure tools will automatically start collecting data from backend components as they come online.
- Tagged infrastructure metrics
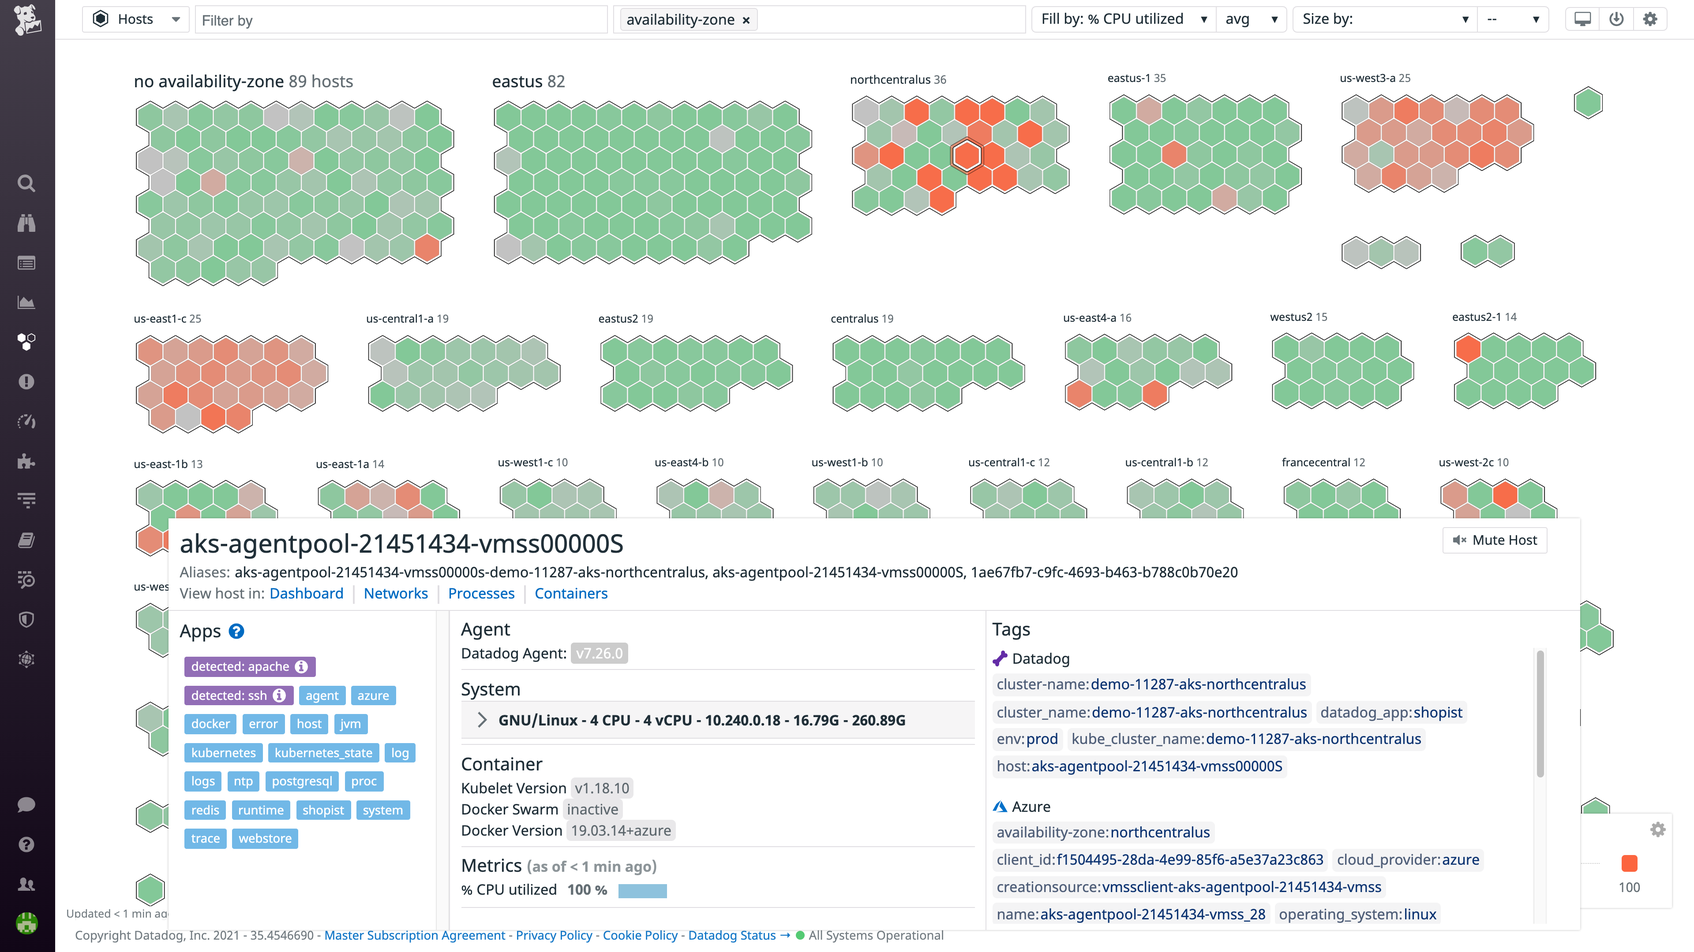
Some infrastructure monitoring platforms can automatically tag backend components with applicable metadata—such as the operating system or service it’s running, the cloud provider, or the availability zone in which a host is located. These tags allow developers to aggregate metrics from across their infrastructure and target parts of their stack—such as a specific service or category of customers—that may be experiencing issues.
- Customizable alerts
Infrastructure monitoring tools typically alert you when a key metric goes above or below a threshold. Some platforms also let you set up proactive, machine learning-based alerts that notify the appropriate teams when the error rate or latency of a host or container is trending higher than normal.
- Visualizations
Some infrastructure monitoring tools provide pre-built or customizable dashboards that give you an overview of the health and performance of your hosts and containers. You can use these visualizations to identify overloaded hosts that require more resources or idle hosts that can be migrated to smaller instance types or consolidated to save on compute costs.
- Machine learning
Machine learning-based tools automatically analyze historical infrastructure performance to detect anomalies, so you don’t have to manually set up alerts for every possible failure mode. For example, an infrastructure monitoring platform may automatically alert you if there’s an unexpected decrease in database query throughput. Machine learning-based tools may also forecast where CPU usage, memory usage, and other resource metrics are heading based on historical analysis.
- Unified platform
A unified infrastructure monitoring platform gives you the ability to correlate infrastructure metrics with related traces, logs, processes, and events. This provides the full context of a request and allows developers to quickly diagnose and solve problems.
Datadog Infrastructure Monitoring offers full visibility into infrastructure performance across any on-premise, hybrid, or cloud environment. The easy-to-deploy, open source Datadog Agent collects metrics from your hosts and containers at 15-second granularity, and turn-key integrations with more than 500 popular technologies ensure complete coverage of your environment.
With tag-based search and analytics, you can slice and dice your metrics to create fine-grained alerts or to focus investigations on a specific subset of your infrastructure. Datadog also provides machine learning-based tools to proactively detect issues for you. Datadog’s unified platform brings together infrastructure monitoring with application performance monitoring, log management, digital experience monitoring, and more—giving you everything you need to understand and resolve performance issues across any layer of your stack.