![Monitor Docker with Datadog [訳]](https://imgix.datadoghq.com/img/blog/monitor-docker-datadog/22.png?auto=compress%2Cformat&cs=origin&lossless=true&fit=crop&q=75&ar=380%3A193&w=1400&h=711&dpr=1 "Monitor Docker with Datadog [訳]")


Jay Hotta
Monitor Docker with Datadog(原文)
Docker is an emerging platform to build and deploy software using lightweight, pared-down virtual machines known as containers. By delivering easy-to-provision recipes for developers and bit-for-bit compatibility between environments, Docker is a popular solution to solve continuous delivery in modern infrastructure.
Dockerは、既存の仮想環境から贅肉を削ぎ落とし軽量化したLinuxコンテナという仕組みを使用し、ソフトウェアシステムを構築&展開するための新たなプラットフォームです。Dockerは、アプリ開発者に簡単にプロビジョニングできるレシピを提供することと環境間の再現性を上げることで、現代インフラでの継続的デリバリーを実現する最も人気のある方法になりました。
Like virtual machines before them, containers require a new monitoring approach. Luckily, if you are a Datadog user, you can now take advantage of our newest integration: Docker.
従前の仮想マシンと同様に、Linuxコンテナでも新しい監視アプローチが必要にまります。Datadogユーザーであれば幸いなことに、最新のDocker Integrationの恩恵を受けることができます。
With our Docker integration you can monitor containers by running version 4.3.1 of the Datadog agent. The integration configuration is, like all other agent-based integrations, a simple YAML file.
バージョン4.3.1のDatadog agentを導入することで、Docker Integrationを使ってコンテナを監視することができるようになります。 Docker Integrationの設定方法は、今まであった他のアプリケーションのIntegrationと同じように簡単なYAMLファイル形式になっています。
How Docker monitoring works
The simplest way to monitor Docker containers is to run the Datadog Agent on the host, where it can access container statistics. This is especially true if you are deploying Docker on existing, full-fledged Host OSes, along existing applications such as databases.
Dcokerコンテナを監視するための最も簡単な方法は、コンテナのスタティック情報にアクセスできるホスト上でDatadog Agentを実行することです。本格的なホストOSにデータベースなどの既存のアプリケーションと共にDockerを展開するなら、尚更この方法は有効です。
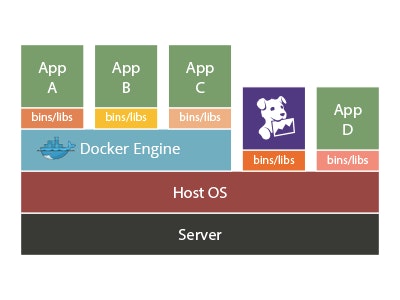
Since Docker uses existing kernel constructs (namespaces and cgroups) in order to run containers, the Datadog Agent uses the native cgroup accounting metrics to gather CPU, memory, network and I/O metrics of the containers every 15 seconds before they are forwarded to Datadog.
Dockerは、コンテナを実行するために既存のカーネル構成体(名前空間とcgroup)を使用しています。 Datadog agentは、このカーネル構造体のcgroupか提供するトリックス(指標)を使ってCPU、メモリ、ネットワーク、15秒ごとのコンテナI/Oの情報を収集し、Datadogに転送しています。
Monitor many containers efficiently with tags
With easy-to-use, lightweight containers, you will likely dial up several times more running containers than the number of underlying physical or virtual hosts in your infrastructure. How do you then keep track and monitor them without spending time chasing after every single one of them? With tags.
簡単に使用でき軽量なコンテナを使うと、インフラストラクチャ内にある物理マシンまたは仮想ホストの数の数倍のコンテナを起動することになるでしょう。あなたらな、どのように時間をかけずに追跡し又監視しますか? タグを使っては、どうでしょう!
Tags are the key to monitoring a lot of containers without additional effort. By default, the agent will monitor your containers and turn the Docker “name”, “image” and “command” attributes into a “tag”.
追加の努力をせずに大量のコンテナを監視するためには、タグ付けが有効な解決策です。何もしなくてもDatadog agentは、Dockerの「名前」,「イメージ名」,「コマンド」の属性をタグに追加します。
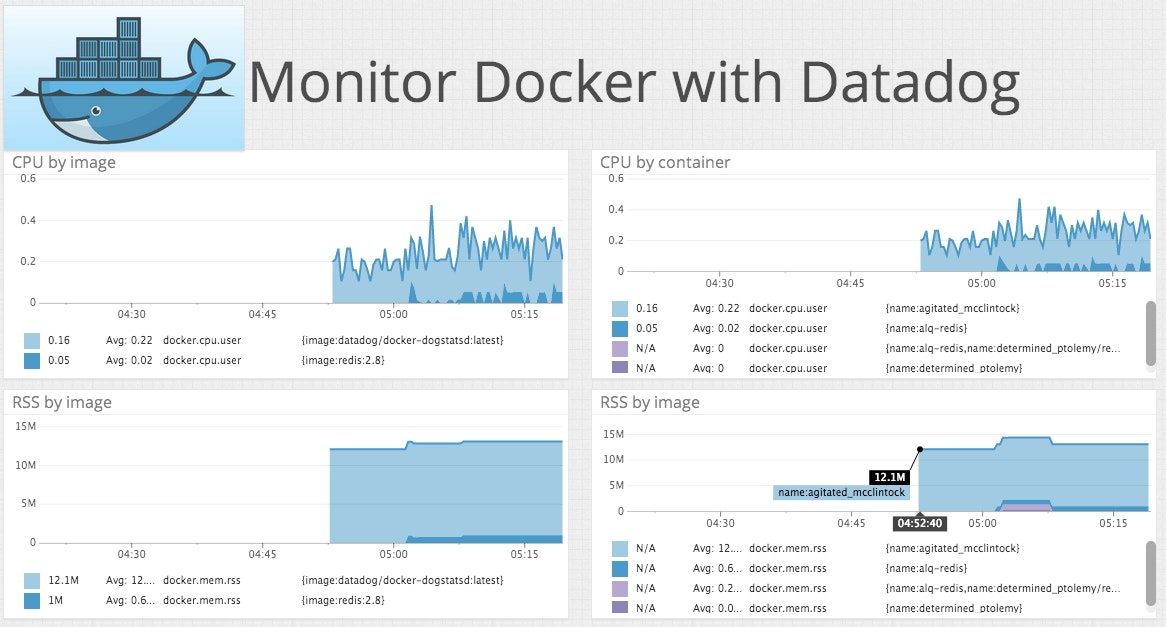
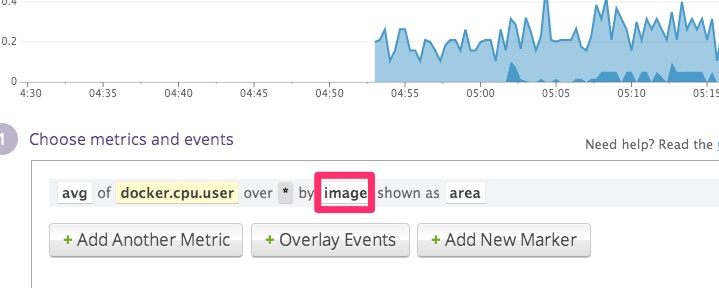
Graph specific metrics with tags
In Datadog, you define the metrics shown in dashboards and graphs based on one or many tags. This allows you to track specific metrics for many containers in aggregate. Using tags, you can easily create a graph for a metric drawn from all containers running a given image.
Datadogでは、タグの組み合わせに基づいてダッシュボードやグラフに表示するメトリック(指標)を定義することができます。この複数のタグの組み合わせによって統計的に複数のコンテナの特定のメトリクス(指標)を追跡することができるようになります。又タグを使用すると、同じDockerイメージから起動しているコンテナのメトリクス(指標)を手軽にグラフを描くこともできます。
In the example below, we are showing the amount of CPU consumed, broken down by image.
以下の例では、CPUの消費量をDockerイメージの分類で表示しています。
Alerts
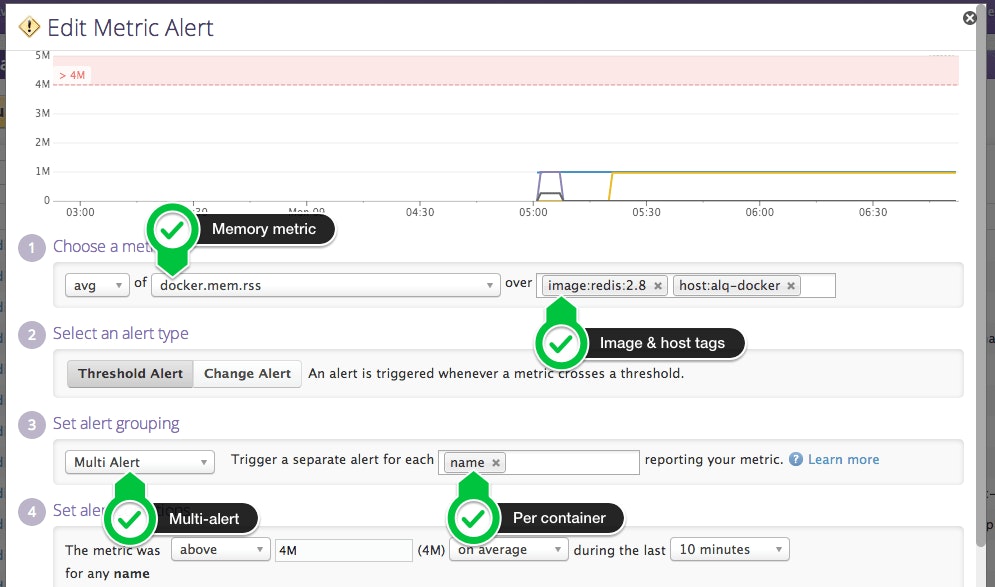
Tags are also very useful to define alerts that span clusters of containers. For instance, let us say that you are running a cluster of Redis containers and you want to be alerted when one of the containers is running out of memory.
タグの使用は、コンテナをクラスター化し、そのクラスターにアラートを定義するのに非常に便利です。たとえば、Redisが起動しているコンテナのクラスターを運用中、クラスタ内のどれかのコンテナにメモリの不足が発生した場合に、アラートを受け取るようにしたいとしましょう。
Instead of defining one alert per container, you only have to create a multi-alert on the docker.mem.rss metric and Datadog will trigger an alert if any container misbehaves.
各コンテナごとにアラートの定義する代わりに、docker.mem.rssのメトリクス(指標)を基に、multi-alertを設定します。Datadogでは、この設定によって任意のコンテナでの誤作動によりアラートを送信することができます。
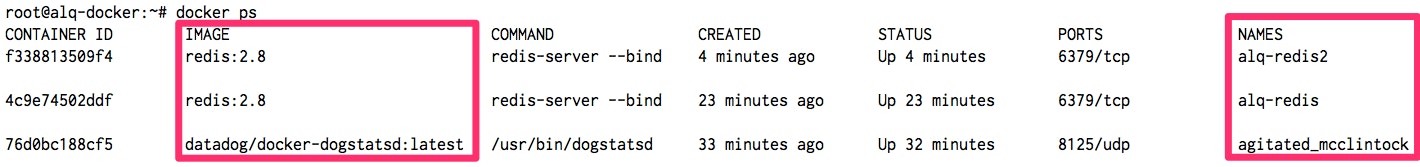
You can also mix and match tags to express more complex conditions. For instance, you can monitor all Redis containers running the redis2.8 image that run on host alq-docker with a simple tag selection:
又タグは、より複雑な条件を設定するためにタグを組み合わせてマッチングさせることができます。たとえば、簡単なタグ選択により、ホスト名alq-docker上で実行されているDockerイメージredis2.8のすべてのRedisのコンテナを監視することができます。
Monitor your containers’ lifecycles
Since containers are designed to be as short-lived (or long-lived) as traditional OS processes, it can be very useful to track particular containers throughout their lifecycles.
コンテナは、伝統的なOSのプロセスのように短期間しか存在しないように設計されています。従って、そのライフサイクルを通して状態を追跡することは非常に重要です。
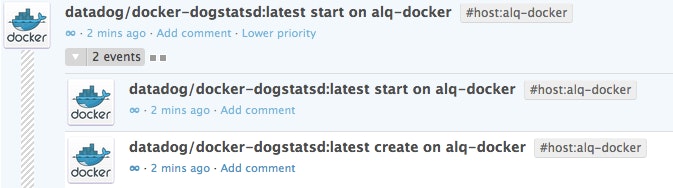
Much like any other meaningful event in your infrastructure, you can search for Docker container create/start/stop/destroy events using the Events Stream. Simply use “sources:docker” as the search filter.
インフラ内の他の重要な出来事のように、Dockerコンテナのcreate/start/stop/destroy イベントは、Datadogのイベントストリームで検索することができます。検索フィルターでsources:dockerと入力し検索するだけです。
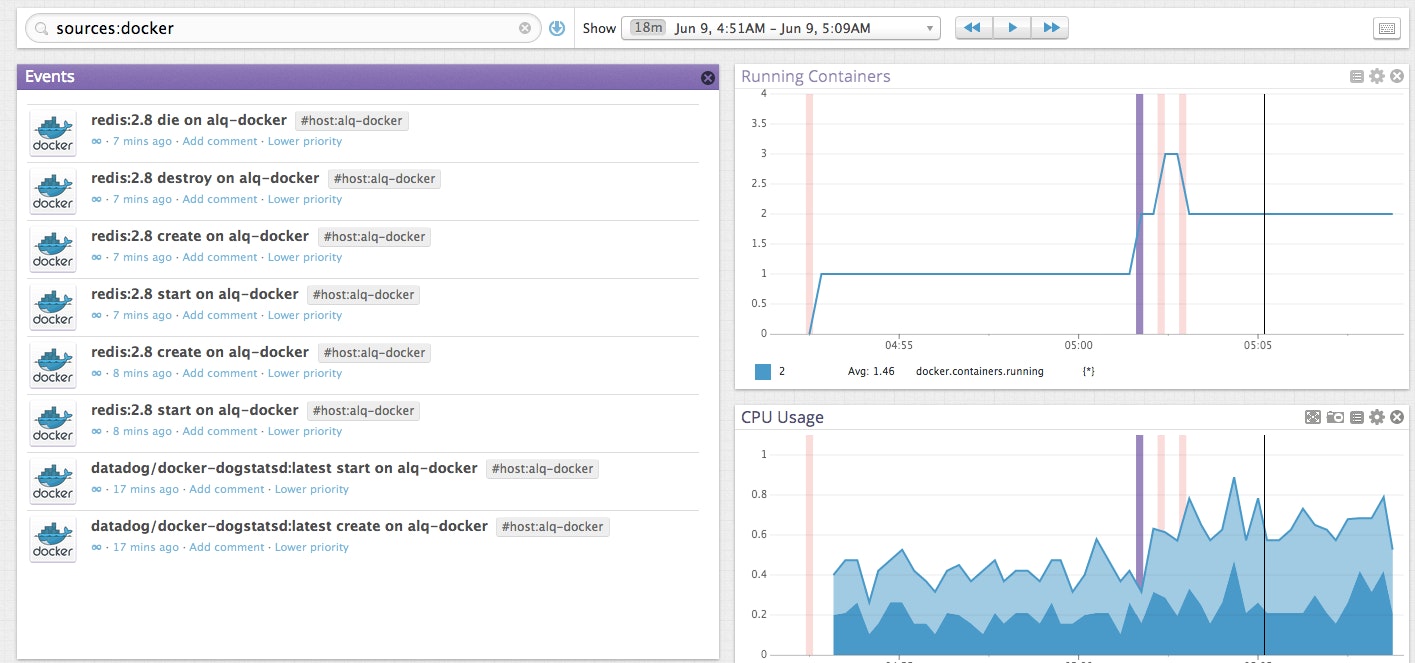
You can also apply the same search to any TimeBoard to visualize Docker container events in the context of Docker and non-Docker metrics. In the following example, we overlay containers starting and stopping over memory and CPU metrics.
更に、Dockerに関連したメトリクス(指標)とそれ以外のメトリック(指標)の検索結果を同一TimeBoardに混在させて表示することができます。次の例では、Dockerコンテナの起動と停止と、ホストマシンのメモリとCPUの消費量を同じTimeBoardで表示しています。
Explore Docker metrics
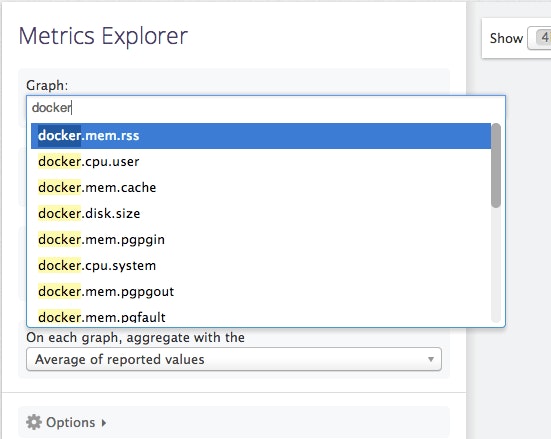
To explore the Docker metrics that are available, you can use the Metrics Explorer in Datadog and type “docker” in the first drop-down.
利用可能なDockerのメトリクス(指標)は、DatadogのMetrics Explorer画面内の最初のドロップダウンメニューでdockerと入力することで探索することができます。
You can find detailed descriptions about all the metrics in Docker’s Runtime Metrics guide.
これらのメトリクスの詳細に関しては、Docker’s Runtime Metrics guideを参照してください。
If you would like to easily visualize and alert on Docker metrics, try out Datadog for free with a 14-day trial. Metrics for the Docker engine, containers and underlying hosts will be immediately available after installing the Datadog agent.
Dockerのメトリクス(指標)を使って状況の可視化や通知をしたい場合は、14日間のフリートライアルを試してみてください。Datadog agentをインストールした後、直ちにDockerエンジン、コンテナ、ホストマシンのメトリクス(指標)を監視できるようになります。
by ALEXIS LÊ-QUÔC (CTO & co-founder Datadog, Inc)

![Docker-ize Datadog with agent containers [訳]](https://imgix.datadoghq.com/img/blog/docker-ize-datadog-with-agent-containers/22.png?auto=compress%2Cformat&cs=origin&lossless=true&fit=crop&q=75&ar=380%3A193&w=319&h=&dpr=1 "Docker-ize Datadog with agent containers [訳]")

