Emily Chang
Amazon CodeDeploy is a service that helps users manage and automate application deployment across EC2 instances or on-premise hosts. It is designed to help simplify the way you deploy changes to your applications, by integrating with other AWS services, plus continuous integration and continuous delivery tools such as Ansible, Chef, Puppet, and Jenkins.
Datadog’s new integration helps you monitor AWS CodeDeploy by tracking how often your deployments are failing, how long they’re taking to execute, and how newly deployed code impacts application performance. And, because Datadog also integrates with more than 1,000 infrastructure technologies (including other AWS services), you get complete observability of your AWS applications and infrastructure, all in one place.
How AWS CodeDeploy works
Although AWS CodeDeploy can deploy to on-premise instances, it is particularly useful for rolling out updates to AWS applications. For example, you can configure CodeDeploy to apply revisions to Auto Scaling groups, or use Elastic Load Balancing to route traffic away from instances while they are undergoing a deployment. You can also set up CodeDeploy to automatically roll back a deployment if it fails, or use it to manually stop any deployments as needed.
Terminology & tags
Before we go any further, it’s useful to explain some CodeDeploy terminology, since Datadog ingests deployment attributes as tags that allow you to filter and aggregate data on the fly, and precisely target your alerting.
In AWS CodeDeploy, applications are organized into one or more deployment groups. To create a deployment group, you need to specify which instances should be included in a given deploy, and which of two deployment types to run on those instances. The first type is in-place deployment, which requires each instance to temporarily go offline in order to install a revision; you can use a load balancer to direct traffic away from instances that are currently undergoing deployment. The second type is called blue/green, which launches and installs the revision on new instances, and then uses elastic load balancing to reroute traffic to the new instances.
You can run a deploy on a deployment group by specifying a deployment configuration that controls how the revision is rolled out across the instances (one instance at a time, all at once, etc.), and the location of the revision that should be deployed. Application revisions can be stored in S3, GitHub, or Bitbucket, and should include a YAML AppSpec file that defines each step of the deploy.
Monitor AWS CodeDeploy with Datadog
Whether you are running AWS CodeDeploy deployments once a week or several times a day, Datadog’s integration helps you track how those deploys impact your applications’ health and performance.
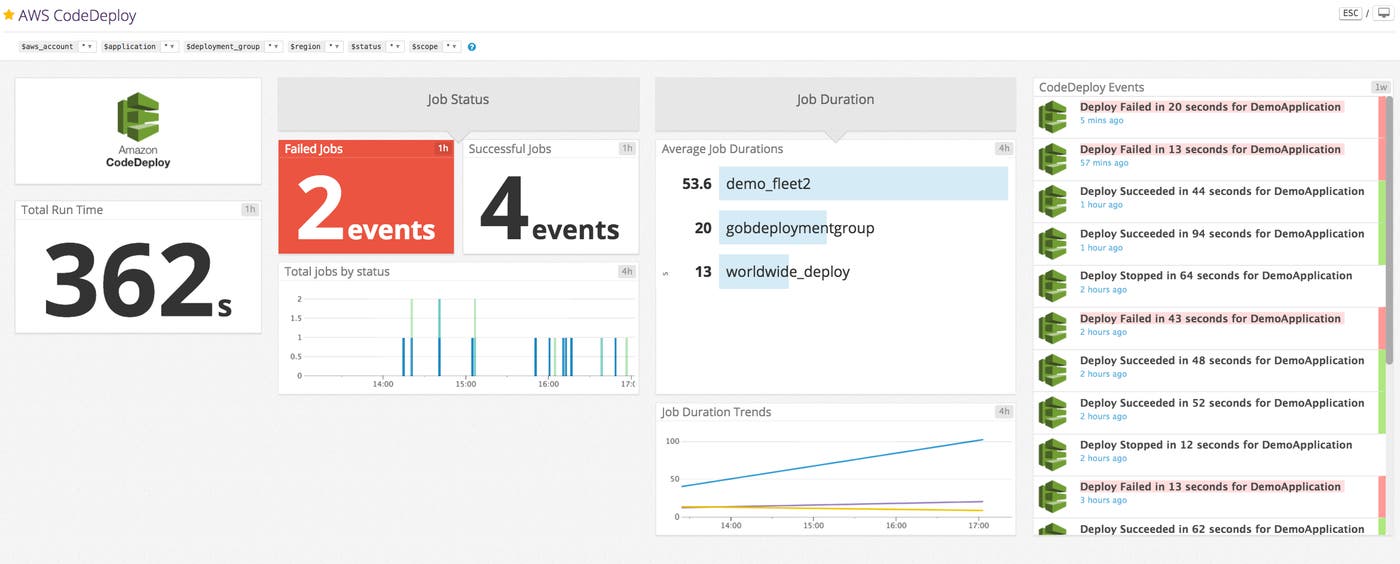
Datadog automatically tags CodeDeploy events and metrics with AWS metadata, including your account, region, the final status of the deploy (failed, succeeded, or stopped), and all of the bolded CodeDeploy terms in the previous section. These tags can help you build custom dashboards and alerts that provide a window into CodeDeploy performance.
Visualize AWS CodeDeploy performance at a glance
Once you integrate CodeDeploy with Datadog, you will see metrics starting to populate an out-of-the-box dashboard. The dashboard provides a bird’s-eye view of CodeDeploy trends, including the number of failed and successful jobs, as well as the average latency of deploys, broken down by deployment group.
You can also create dashboards that combine CodeDeploy metrics with data from related AWS services and other tools associated with your deploys, such as ELB, S3, Jenkins, and Chef.
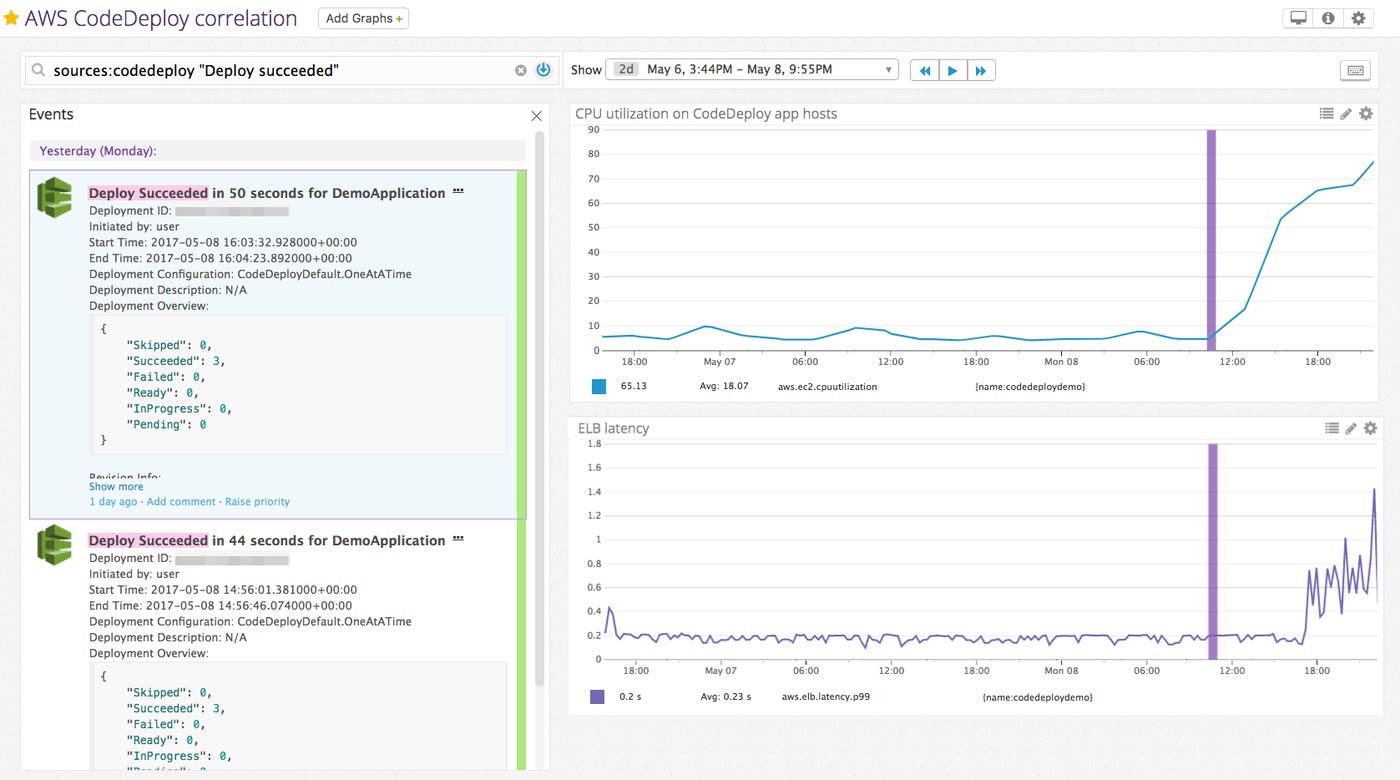
Once you’ve created a dashboard of related metrics, you can search the event stream to see if a deployment is correlated with a performance degradation elsewhere in your stack. In the dashboard above, it looks like CPU usage on CodeDeploy EC2 instances and ELB latency both started increasing after a deployment (represented by the purple bar on each graph), indicating that those changes may have triggered the issue.
Track and alert on AWS CodeDeploy performance
Once you’ve enabled Datadog’s CodeDeploy integration, each deploy will show up in Datadog as an event that provides rich context to help you identify and fix deployment issues quickly. You can dive into more details about each deployment right from the event stream, including how long the deploy took, any error info (if applicable), and the name and version (e.g. ETag or commit ID) of the S3 bucket or GitHub repository associated with the revision.
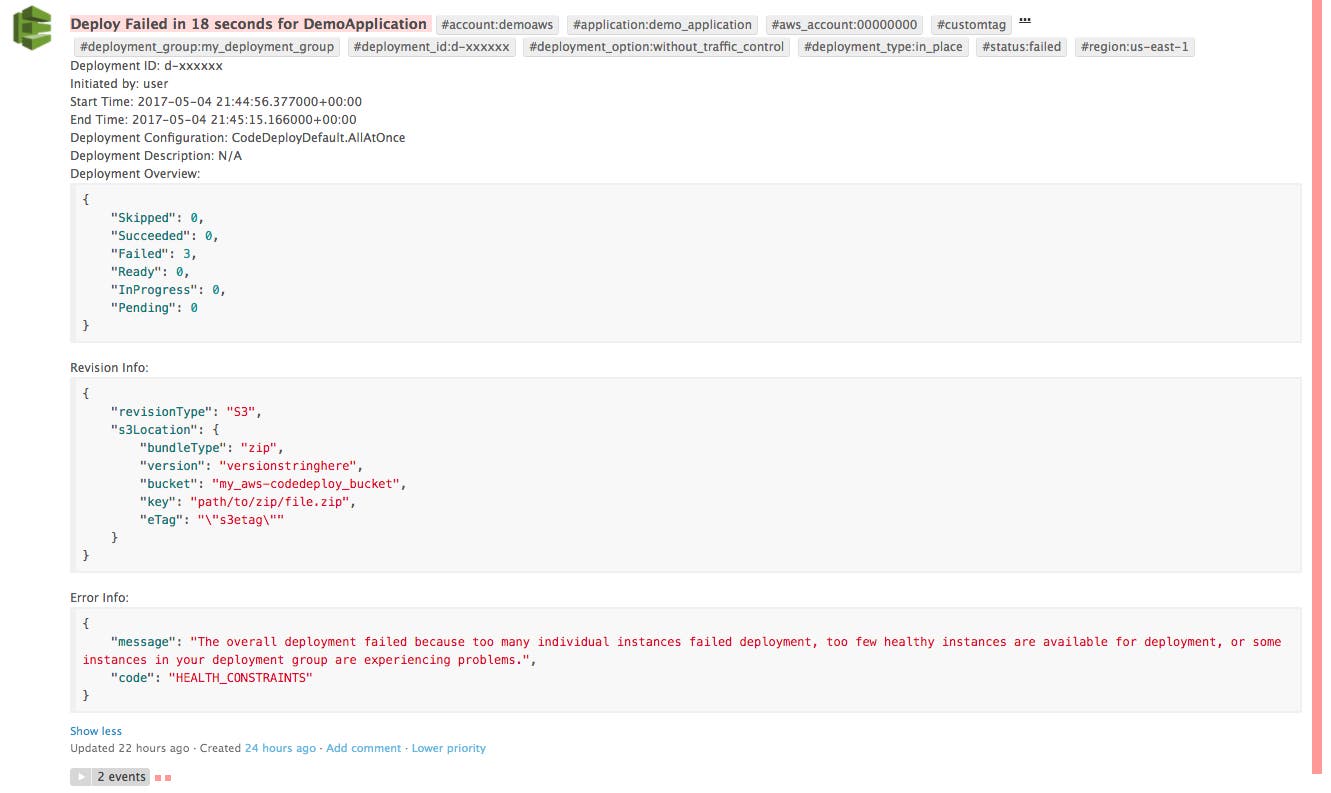
In addition to tracking deploys from dashboards and the event stream, you can also set up alerts to automatically get notified when an important deploy stops unexpectedly or fails. If your deploys follow a predictable pattern, anomaly detection can help automatically detect deviations from your standard deployment schedule.
Start monitoring AWS CodeDeploy
In order to monitor AWS CodeDeploy, you will first need to install the main AWS integration, if you haven’t done so already. Then simply navigate to the AWS CodeDeploy integration tile and click on “Install”. If you’re not using Datadog yet, get started with a 14-day free trial.


