

Andrew Lock

Jay Davé

Mallory Mooney
Staff Technical Content Writer
ASP.NET Core is an open source web development framework that enables you to develop .NET applications on macOS, Linux, and Windows machines. The introduction of .NET Core in 2016 dramatically increased the number of ways to build and deploy .NET applications. This means that you need the ability to easily monitor application performance across a wide variety of platforms, such as Docker containers.
Being able to track requests across all of an application's service and process boundaries helps you identify issues with services and their dependencies, such as slow database calls or overloaded servers. In this post, we'll walk through how to instrument a sample containerized ASP.NET Core application to send traces to Datadog for monitoring by:
Deploying the Datadog Agent in a Docker container to collect application traces
Instrumenting an application running on Linux or Windows containers with Datadog's .NET tracer
Datadog's .NET tracer uses the .NET profiling APIs to add out-of-the-box instrumentation for many common libraries and programming languages used for both .NET Core and .NET frameworks, including VB.NET, C#, and F#. Once instrumented, your application will automatically send traces to the Datadog Agent, which aggregates and enhances them with additional metadata from the host before forwarding them to Datadog. For full details on the .NET tracer, check out our documentation.
Get started with a sample application
To get started, make sure you have at least version 5 of the .NET Core SDK, the .NET CLI, and Docker Desktop installed. This will let you generate the sample ASP.NET Core application we'll use throughout this guide.
You can use the .NET CLI to create a new web application project with all of the files needed to run a sample application via the following commands:
dotnet new sln -n DatadogContainerExampledotnet new webapp -o DatadogContainerExample -n DatadogContainerExampledotnet sln add DatadogContainerExampleThese commands create a new solution file (i.e., DatadogContainerExample.sln) and add a new Razor Pages web application project and associated DatadogContainerExample directory to the file.
Deploy the Datadog Agent via Docker Compose
Monitoring any application starts with deploying the Datadog Agent. There are many ways to do this, but here we'll use Docker Compose to automatically configure the Datadog Docker Agent, which enables you to easily package and deploy Datadog with your containerized applications. Docker Compose provides a simple declarative format for orchestrating Docker containers when you don’t need the resilience or complexity of a solution like Kubernetes. Docker Compose is particularly useful for local development, but it can also be used in production environments.
To use Docker Compose to deploy the Datadog Agent, first create a new docker-compose.yml file in the same root directory as your DatadogContainerExample.sln file and add the following configuration:
version: "3.9"services: datadog-agent: image: "gcr.io/datadoghq/agent:latest" environment: DD_APM_ENABLED: "true" DD_APM_NON_LOCAL_TRAFFIC: "true" DD_DOGSTATSD_NON_LOCAL_TRAFFIC: "true" DD_API_KEY: ${DD_API_KEY}This file defines a single service called datadog-agent to build and run the latest version of the Datadog Agent container image. We'll use this service to link the Agent to your containerized web application, which we'll look at later when we instrument the application. The file also automatically configures the Agent to enable APM and allows it to listen for non-local traffic, which is required when the Agent and application are running in different containers. Finally, it passes in a DD_API_KEY environment variable for connecting the Agent to your Datadog account—your unique API key can be found in your account's settings.
To launch the Datadog Agent, you can run the docker-compose up command in a terminal window. The Agent will automatically capture metrics from your host, enabling you to monitor host performance as soon as the Agent spins up.
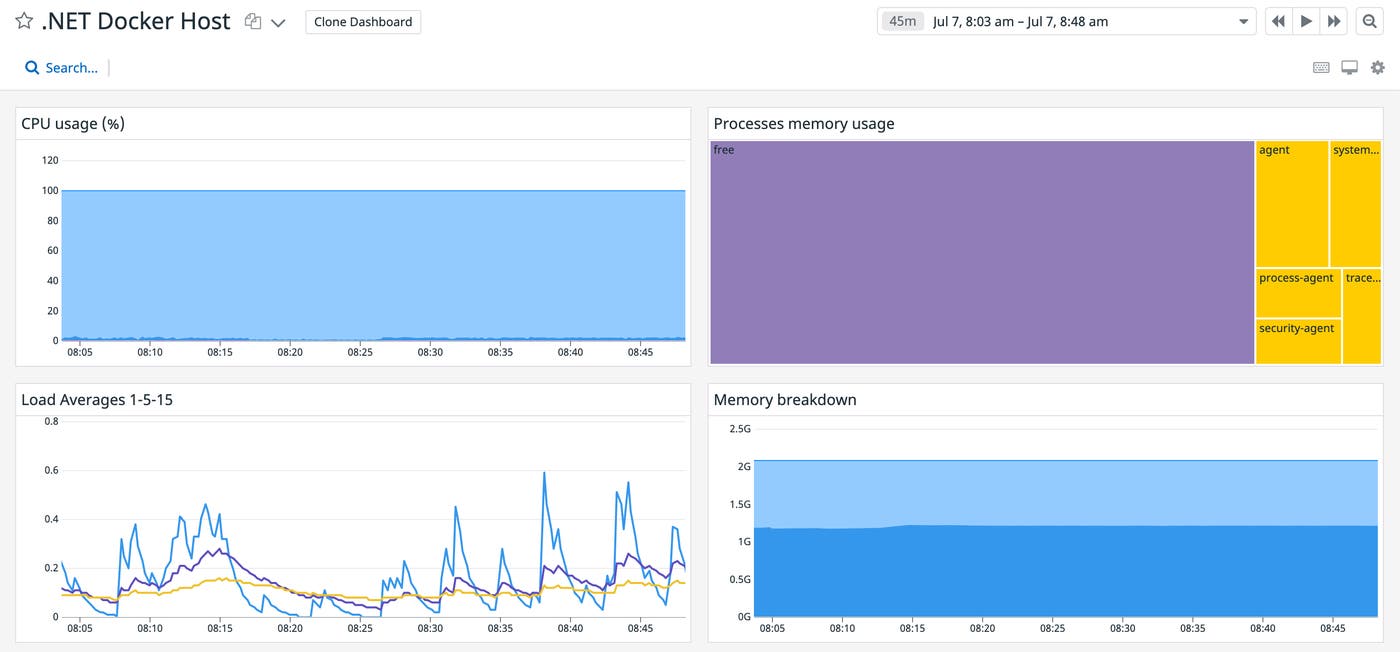
The Datadog Agent runs alongside your containerized application and .NET tracer instrumentation, enabling you to capture traces as soon as you deploy the application. Next, we'll show how you can use Datadog's .NET tracer to automatically instrument your application running on a Linux container.
Deploy the .NET tracer in a Linux container
Linux containers provide a lightweight, cheap, and fast option for building .NET Core applications, and Datadog's .NET tracer supports several Linux distributions. To deploy and instrument your application in a Linux container, create a Dockerfile in your project's DatadogContainerExample directory:
FROM mcr.microsoft.com/dotnet/aspnet:5.0 AS baseWORKDIR /appEXPOSE 80EXPOSE 443
FROM mcr.microsoft.com/dotnet/sdk:5.0 AS build
# Download the latest version of the tracer but don't install yetRUN TRACER_VERSION=$(curl -s \https://api.github.com/repos/DataDog/dd-trace-dotnet/releases/latest | grep tag_name | cut -d '"' -f 4 | cut -c2-) \ && curl -Lo /tmp/datadog-dotnet-apm.deb https://github.com/DataDog/dd-trace-dotnet/releases/download/v\${TRACER_VERSION}/datadog-dotnet-apm_\${TRACER_VERSION}_amd64.deb
WORKDIR /srcCOPY ["DatadogContainerExample/DatadogContainerExample.csproj", "DatadogContainerExample/"]RUN dotnet restore "DatadogContainerExample/DatadogContainerExample.csproj"COPY . .WORKDIR "/src/DatadogContainerExample"RUN dotnet build "DatadogContainerExample.csproj" -c Release -o /app/build
FROM build AS publishRUN dotnet publish "DatadogContainerExample.csproj" -c Release -o /app/publish
FROM base AS final
# Copy the tracer from build targetCOPY --from=build /tmp/datadog-dotnet-apm.deb /tmp/datadog-dotnet-apm.deb# Install the tracerRUN mkdir -p /opt/datadog \ && mkdir -p /var/log/datadog \ && dpkg -i /tmp/datadog-dotnet-apm.deb \ && rm /tmp/datadog-dotnet-apm.deb
# Enable the tracerENV CORECLR_ENABLE_PROFILING=1ENV CORECLR_PROFILER={846F5F1C-F9AE-4B07-969E-05C26BC060D8}ENV CORECLR_PROFILER_PATH=/opt/datadog/Datadog.Trace.ClrProfiler.Native.soENV DD_DOTNET_TRACER_HOME=/opt/datadogENV DD_INTEGRATIONS=/opt/datadog/integrations.json
WORKDIR /appCOPY --from=publish /app/publish .ENTRYPOINT ["dotnet", "DatadogContainerExample.dll"]We'll look at the Dockerfile in more detail below, but it is designed to optimize the build process with multi-stage builds and ensure compatibility with Visual Studio, so you can debug issues locally via Visual Studio’s container tools. You can check out Microsoft’s documentation for details.
There are four build stages in the Dockerfile above: base, build, publish, and final. The mcr.microsoft.com/dotnet/aspnet:5.0 Docker image in the base stage is based on the Debian operating system and serves as the main image to run the application in the final stage.
In the build stage, the file uses the mcr.microsoft.com/dotnet/sdk:5.0 Docker image to first download the latest version of the Datadog .NET tracer—this image has the curl utility needed to download the tracer—then build the DatadogContainerExample project. To use a specific version of the tracer, you can set the TRACER_VERSION environment variable via a build argument instead. We'll show how you can do that for Windows containers later.
The publish stage publishes the project and its dependencies to the /app/publish directory for deployment, and the final stage installs and enables the tracer with the necessary file configurations and environment variables.
Run your instrumented application
To run your instrumented application and the Agent together, update the docker-compose.yml file with the following configuration:
version: "3.9"services: web: build: context: ./ dockerfile: ./DatadogContainerExample/Dockerfile ports: - "8000:80" depends_on: - datadog-agent environment: DD_ENV: "core-local" DD_SERVICE: "DatadogContainerExample" DD_VERSION: "1.0.0" DD_AGENT_HOST: "datadog-agent" DD_TRACE_ROUTE_TEMPLATE_RESOURCE_NAMES_ENABLED: "true" DD_RUNTIME_METRICS_ENABLED: "true" datadog-agent: image: "gcr.io/datadoghq/agent:latest" environment: DD_APM_ENABLED: "true" DD_APM_NON_LOCAL_TRAFFIC: "true" DD_DOGSTATSD_NON_LOCAL_TRAFFIC: "true" DD_API_KEY: ${DD_API_KEY}This update configures a new web service, which points to the ASP.NET Core application’s Dockerfile you created and exposes port 8000 on the localhost—mapping it to port 80 inside the container. It also links the web service's container to the datadog-agent container at runtime by using the depends_on configuration option. Finally, the updated configuration sets several environment variables for the Datadog Agent to collect data from your application:
DD_ENV,DD_VERSION,DD_SERVICE: sets theenv,version, andservicetags on traces for Unified Service TaggingDD_AGENT_HOST: tells the tracer to send traces to thedatadog-agentcontainerDD_TRACE_ROUTE_TEMPLATE_RESOURCE_NAMES_ENABLED: enables improved resource names for ASP.NET CoreDD_RUNTIME_METRICS_ENABLED: enables runtime metrics for the .NET runtime like thread counts and garbage collection (GC) pressure
You can run the docker-compose up command in your project's root directory again to launch the Datadog Agent and build your instrumented application. (You may need to run docker-compose down to stop previously launched containers.) Then you can navigate to http://localhost:8000 to view the application.
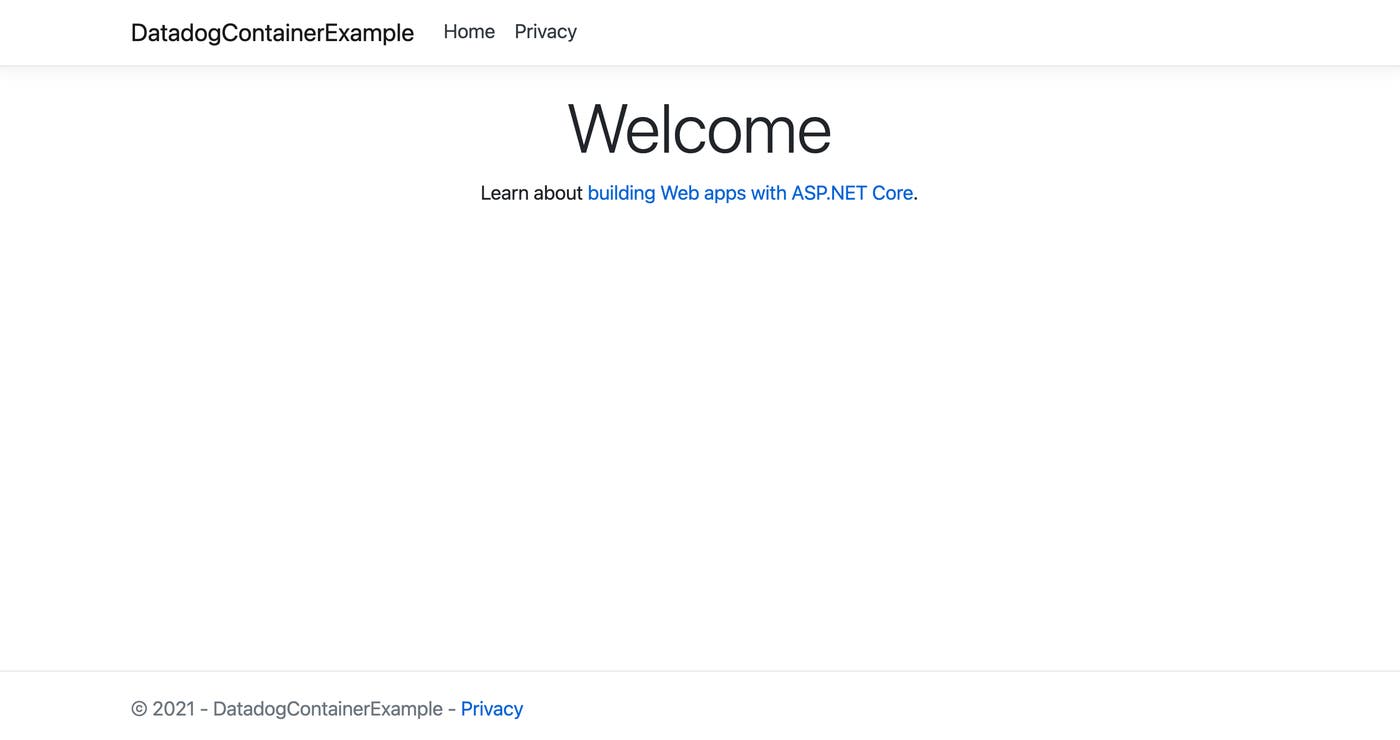
Since the Datadog Agent is deployed alongside the application, you will start seeing trace data in Datadog APM as you generate traffic.
In this section, we looked at how you can configure monitoring for a sample .NET Core application running in a Linux container with the containerized Agent and Datadog's .NET tracer. Next, we'll walk through the same process for instrumenting a .NET Core application running in a Windows container.
Deploy the .NET tracer in a Windows container
In most cases, you would run .NET Core applications on Linux containers because they typically consume fewer resources and are cheaper to develop on than Windows containers. However, your application may rely on services such as Microsoft's Internet Information Services (IIS), or you may need to install Windows packages (e.g., .msi files) in Windows-only environments. There are two Windows containers available for these types of use cases:
Windows Server Core: supports all .NET Framework applications, with a few additional features
Windows Nano Server: supports .NET Core and .NET 5+ applications
To launch your instrumented application on these containers, we will make a few modifications to the Dockerfile and walk through the key changes.
Windows Server Core
The Windows Server Core container is useful if you need to support legacy applications or run utilities such as Powershell in your environment. To use this container, you can replace the contents of your Dockerfile with the following configuration:
FROM mcr.microsoft.com/dotnet/aspnet:5.0-windowsservercore-ltsc2019 AS baseWORKDIR /appEXPOSE 80EXPOSE 443
FROM mcr.microsoft.com/dotnet/sdk:5.0-windowsservercore-ltsc2019 AS buildWORKDIR /srcCOPY ["DatadogContainerExample/DatadogContainerExample.csproj", "DatadogContainerExample/"]RUN dotnet restore "DatadogContainerExample/DatadogContainerExample.csproj"COPY . .WORKDIR "/src/DatadogContainerExample"RUN dotnet build "DatadogContainerExample.csproj" -c Release -o /app/build
FROM build AS publishRUN dotnet publish "DatadogContainerExample.csproj" -c Release -o /app/publish
FROM base AS final
# Download and install the tracer# We recommend always using the latest release and regularly updating: https://github.com/DataDog/dd-trace-dotnet/releases/latestARG DD_TRACER_VERSION=1.27.0ENV DD_TRACER_VERSION=$DD_TRACER_VERSIONENV ASPNETCORE_URLS=http://*.80
ENV COR_ENABLE_PROFILING="1"ENV COR_PROFILER="{846F5F1C-F9AE-4B07-969E-05C26BC060D8}"
ENV CORECLR_ENABLE_PROFILING="1"ENV CORECLR_PROFILER=$COR_PROFILER
SHELL ["powershell", "-Command", "\$ErrorActionPreference = 'Stop'; \$ProgressPreference = 'SilentlyContinue';"]
RUN Write-Host "Downloading Datadog .NET Tracer v$env:DD_TRACER_VERSION" ;\ (New-Object System.Net.WebClient).DownloadFile('https://github.com/DataDog/dd-trace-dotnet/releases/download/v' + \$env:DD_TRACER_VERSION + '/datadog-dotnet-apm-' + \$env:DD_TRACER_VERSION + '-x64.msi', 'datadog-apm.msi') ;\ Write-Host 'Installing Datadog .NET Tracer' ;\ Start-Process -Wait msiexec -ArgumentList '/i datadog-apm.msi /quiet /qn /norestart /log datadog-apm-msi-installer.log' ;\ Write-Host 'Datadog .NET Tracer installed, removing installer file' ;\ Remove-Item 'datadog-apm.msi'
WORKDIR /appCOPY --from=publish /app/publish .ENTRYPOINT ["dotnet", "DatadogContainerExample.dll"]The updated file uses the mcr.microsoft.com/dotnet/aspnet:5.0-windowsservercore-ltsc2019 Docker image for the base and build stages and downloads and installs the tracer as part of the final stage. It also uses a build argument to specify which version of the tracer is installed. The other build stages remain the same.
Windows Nano Server
Windows Nano Server is optimized for the cloud and includes the Kestrel web server, making it a lightweight option for .NET Core development in Windows environments. To run the .NET tracer and your application in this container, replace the contents of your Dockerfile with the following configuration:
FROM mcr.microsoft.com/dotnet/aspnet:5.0 AS baseWORKDIR /appEXPOSE 80EXPOSE 443
FROM mcr.microsoft.com/dotnet/sdk:5.0 AS build
WORKDIR /srcCOPY ["DatadogContainerExample/DatadogContainerExample.csproj", "DatadogContainerExample/"]RUN dotnet restore "DatadogContainerExample/DatadogContainerExample.csproj"COPY . .WORKDIR "/src/DatadogContainerExample"RUN dotnet build "DatadogContainerExample.csproj" -c Release -o /app/build
FROM build AS publishRUN dotnet publish "DatadogContainerExample.csproj" -c Release -o /app/publish
FROM base AS final
WORKDIR /datadog
# Install the latest version of the tracerARG DD_TRACER_VERSION=1.27.0ENV DD_TRACER_VERSION=$DD_TRACER_VERSIONRUN curl -Lo datadog-dotnet-apm.zip https://github.com/DataDog/dd-trace-dotnet/releases/download/v%DD_TRACER_VERSION%/windows-tracer-home.zip \ && tar.exe -xf datadog-dotnet-apm.zip \ && del datadog-dotnet-apm.zip
# Enable the tracerENV CORECLR_ENABLE_PROFILING=1ENV CORECLR_PROFILER={846F5F1C-F9AE-4B07-969E-05C26BC060D8}ENV CORECLR_PROFILER_PATH=/datadog/Datadog.Trace.ClrProfiler.Native.dllENV DD_DOTNET_TRACER_HOME=/datadogENV DD_INTEGRATIONS=/datadog/integrations.json
WORKDIR /appCOPY --from=publish /app/publish .ENTRYPOINT ["dotnet", "DatadogContainerExample.dll"]This configuration uses the same mcr.microsoft.com/dotnet/aspnet:5.0 Docker image as the Linux deployment because the image supports both Linux and Windows Nano Server operating systems. The file also downloads and extracts a specific version of the tracer as a .zip file, which is required for installing the tracer on a Windows Nano Server container. The rest of the stages remain the same.
Run your instrumented application
You can run your application for either Windows container using the same docker-compose up command, then navigate to http://localhost:8000 to view your application. You will not need to modify docker-compose.yml because the datadog-agent image will automatically recognize that your application is running in a Windows environment and launch the appropriate Windows-based container when you run the docker-compose command.
We've just looked at how you can set up Datadog's Agent and .NET tracer for a sample .NET Core application running in two different Windows containers. Now that you have instrumented and deployed a sample .NET Core application on both Linux and Windows containers, you can monitor its performance in Datadog APM.
Monitor containerized applications with Datadog APM
Datadog APM enables you to track distributed traces end to end and capture detailed performance metrics from your application, so you can get a better understanding of how your application services process requests.
To view your application's traces, navigate to the service page in your Datadog account and locate the datadogcontainerexample service, which reflects the value you set for the DD_SERVICE tag in the docker-compose.yml file. You can select that service to see a high-level overview of application performance and visualizations for key metrics, such as the total number of requests, errors, and request latency.
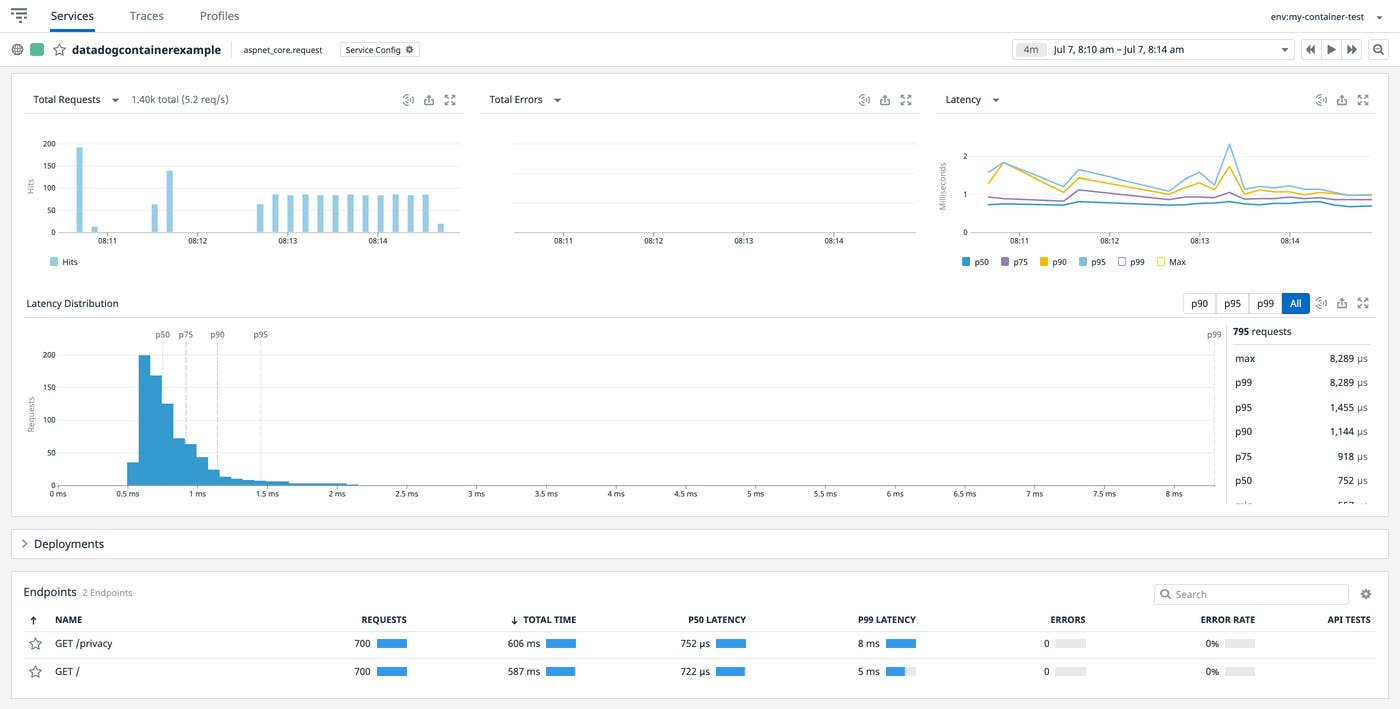
You can then select an endpoint, which represent individual requests to an application page, and drill down to collected traces in order to view more details about each application call involved in processing the request.
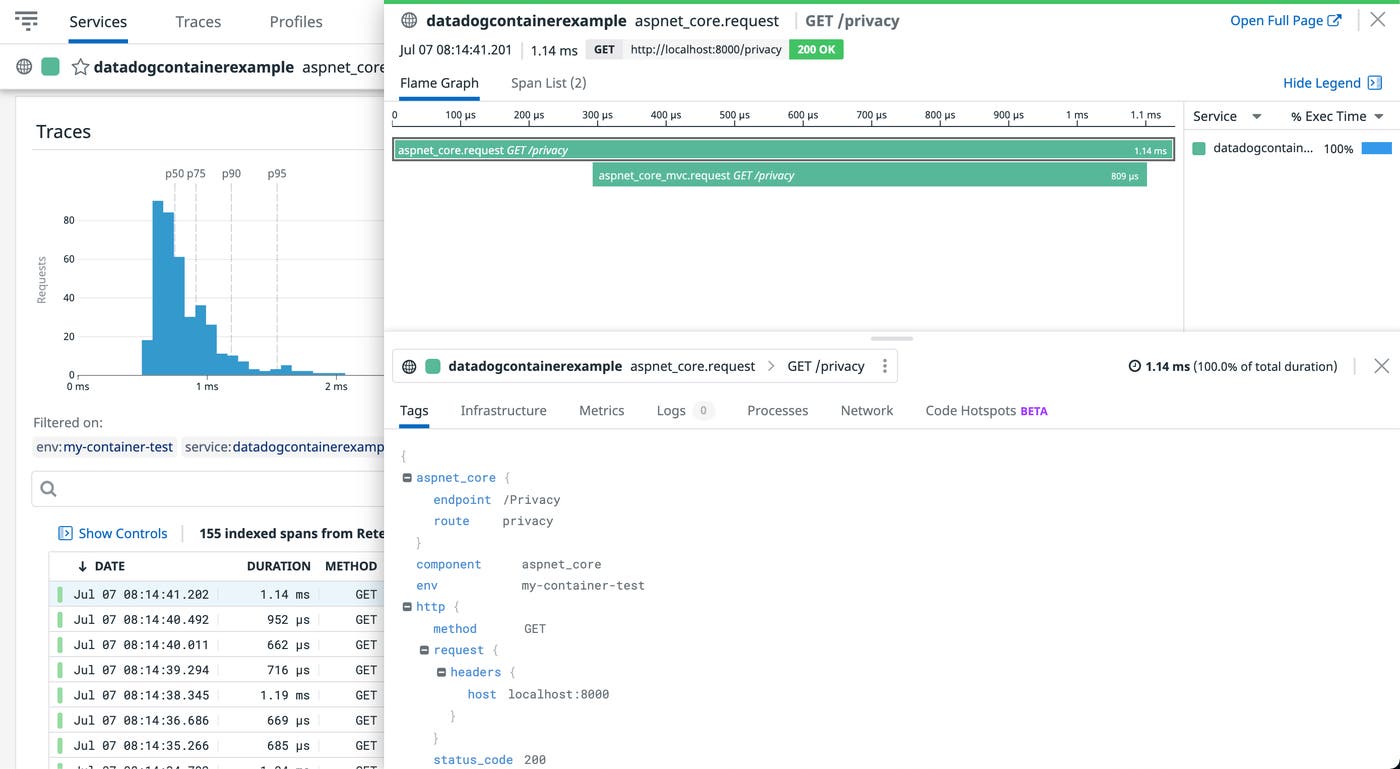
You can also capture traces from any custom instrumentation to help you monitor the performance of your application's business logic, such as methods that generate customer IDs or purchase order numbers.
For even greater visibility into your application, you can connect your .NET logs to your traces by automatically injecting trace and span IDs into your logs. This enables you to quickly pivot between your traces and .NET logs to get more context for an issue, so you can resolve it sooner.
Better visibility into .NET Core applications
In this post, we've shown how you can instrument your .NET Core applications deployed on Linux and Windows containers with Datadog's containerized Agent and .NET tracer. We also looked at how you can use Datadog APM to monitor the flow of requests throughout your .NET Core applications, regardless of the container's infrastructure. Check out our documentation for more information about tracing your applications. If you don't already have a Datadog account, you can sign up for a free 14-day trial.
