Marshal Ma
Application performance monitoring (APM) dovetails nicely with infrastructure monitoring, allowing you to monitor app performance and end-user satisfaction in context with the rest of your infrastructure. That’s why we unveiled Datadog APM to complement our infrastructure monitoring platform and provide full-stack observability. Datadog also integrates with APM service provider New Relic, so you can see your app-level New Relic metrics alongside metrics from your app infrastructure and supporting technologies. And with our integration with New Relic Synthetics, you can see even more performance metrics in Datadog.
How APM and infrastructure monitoring fit together
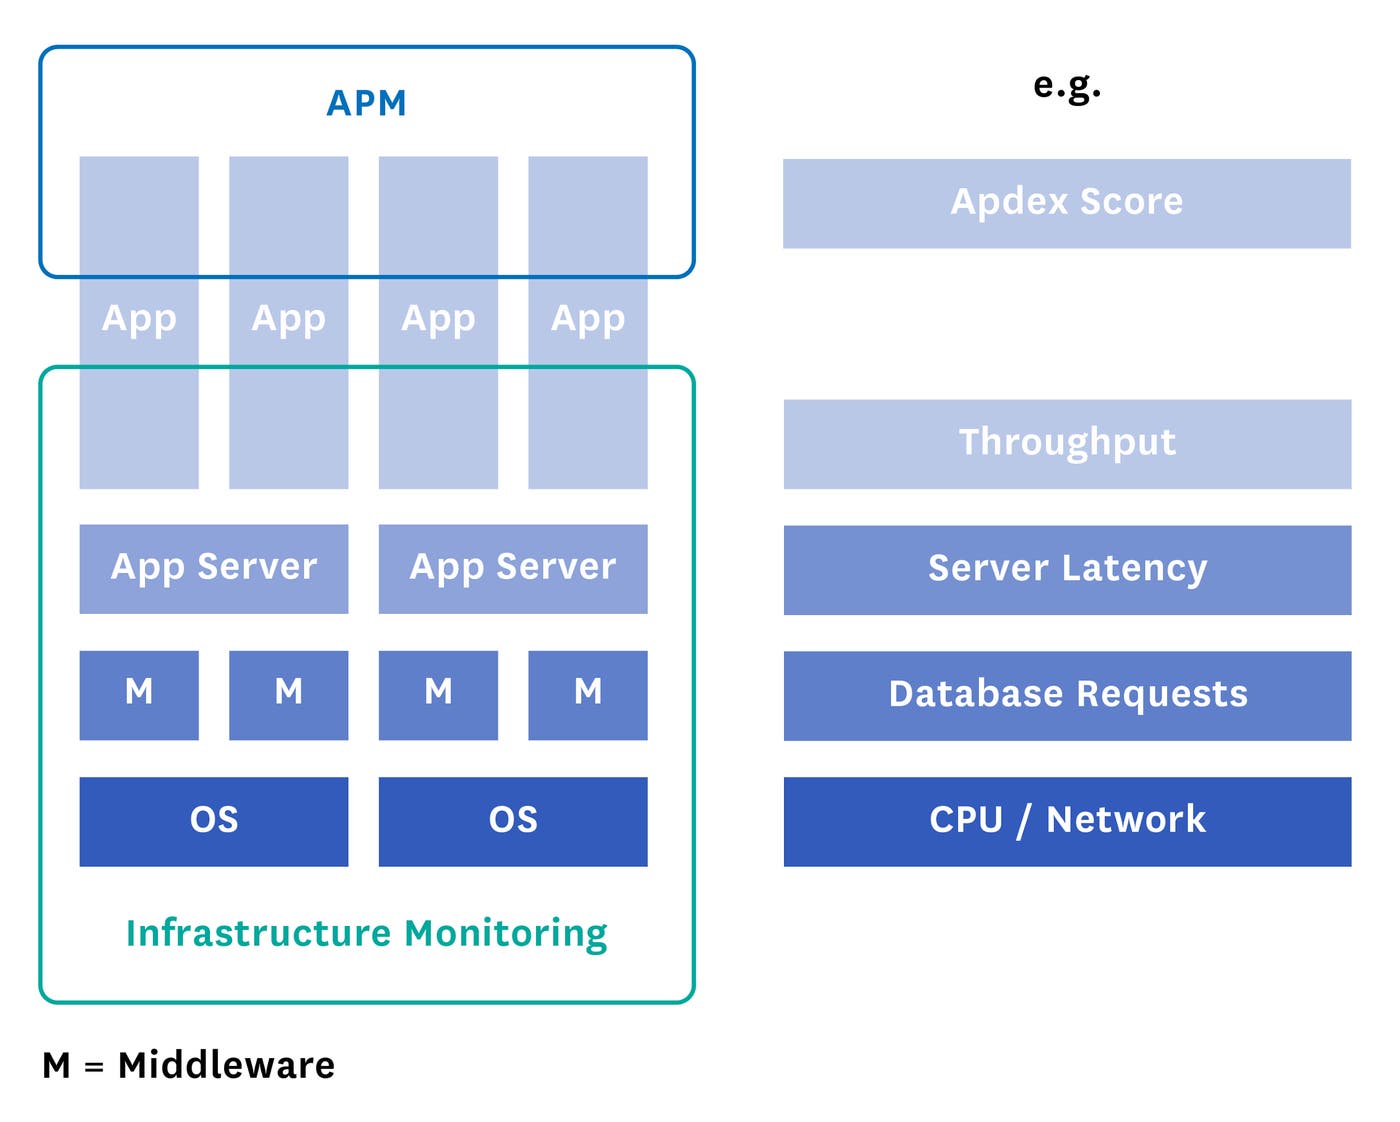
Infrastructure monitoring and APM focus on different layers of your stack. APM examines the user-facing aspects of application performance, helping you answer questions such as: how long does an end user need to wait before getting the service? And what code might be slowing things down? Infrastructure monitoring supplements that layer of visibility with detailed insight into the complex infrastructure supporting the application. After all, a user-facing performance problem–like excessively long response times–may arise from anywhere in the stack and could be due to one of countless causes, including load balancing bottlenecks or a database resource constraint.
With our integration, dev and ops teams using New Relic can find issues in any part of their application stack. Together they help improve the observability of all system components and their interactions.
Monitor app performance in Datadog
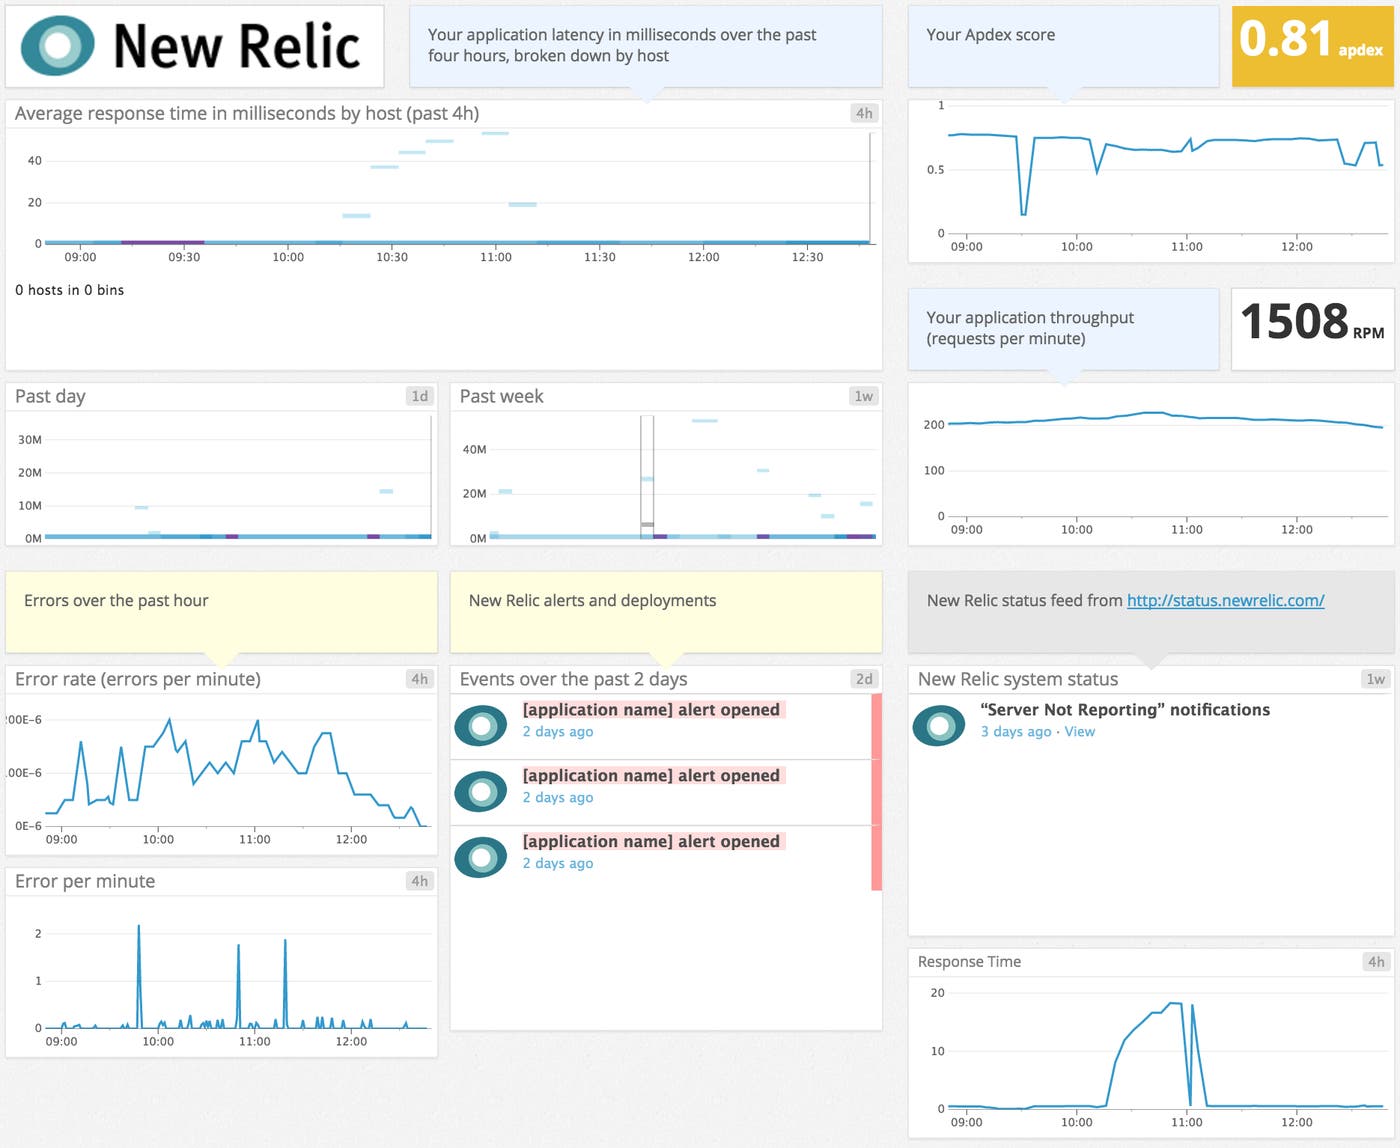
Datadog collects New Relic metrics such as Apdex score, request throughput, and average response time so you can monitor app health and performance alongside your other application and server metrics. Metrics like Apdex score help surface symptoms of problems and as such are often useful for alerting.
Apdex Score
As shown in the top right corner of the template dashboard above, Apdex score, or Application Performance Index score, is an open industry standard that estimates the end user’s satisfaction level on an application’s response time. The score is derived by taking the ratio of the number of satisfactory, timely web page responses to the total number of service requests.
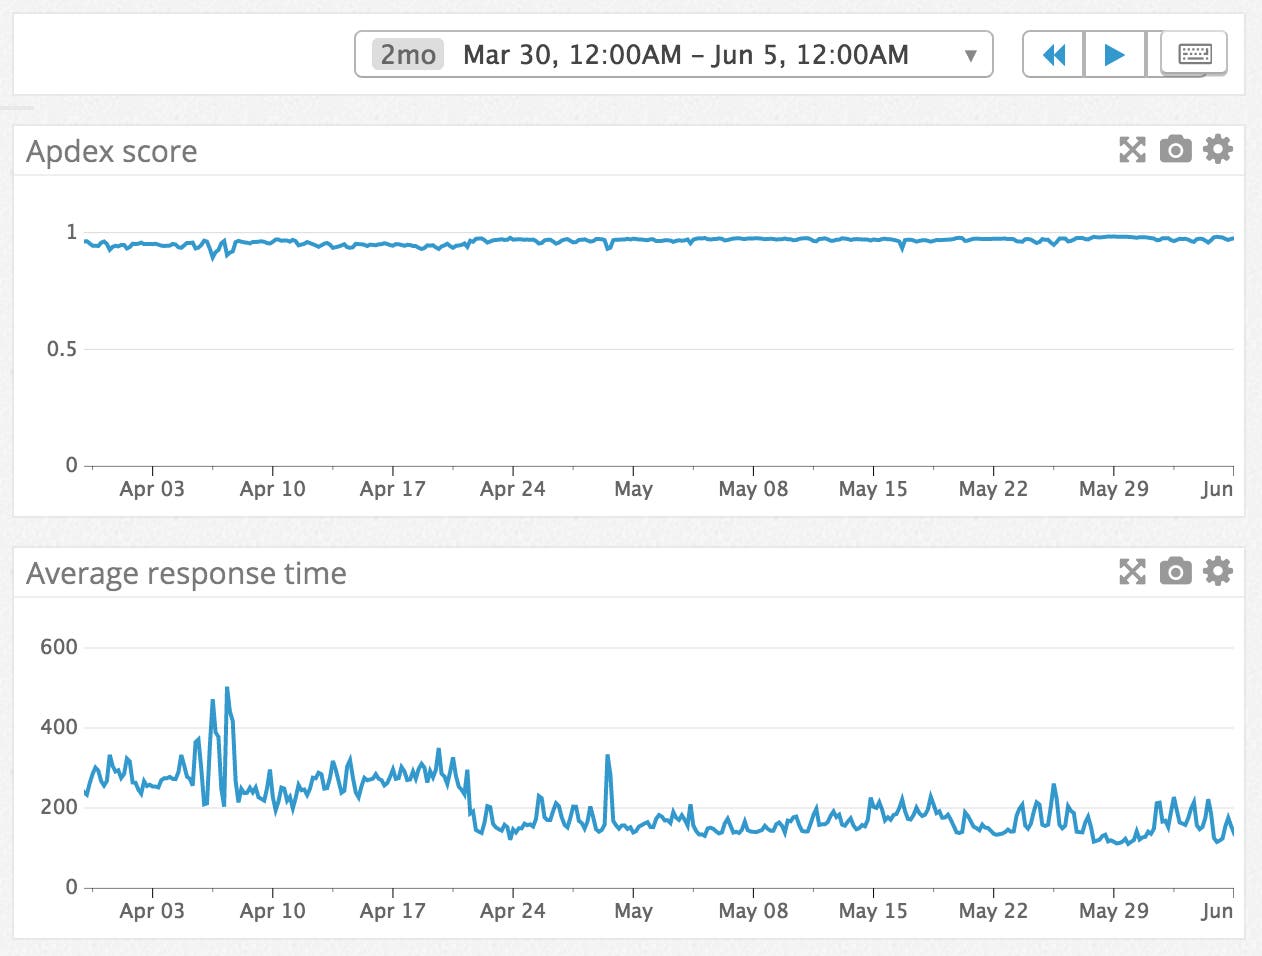
The “satisfactory” threshold is specifically tailored for a particular app context. Because it is relatively more stable than response time, Apdex can serve as a robust alert metric for performance issues.
Synthetics: Monitoring app availability and load time
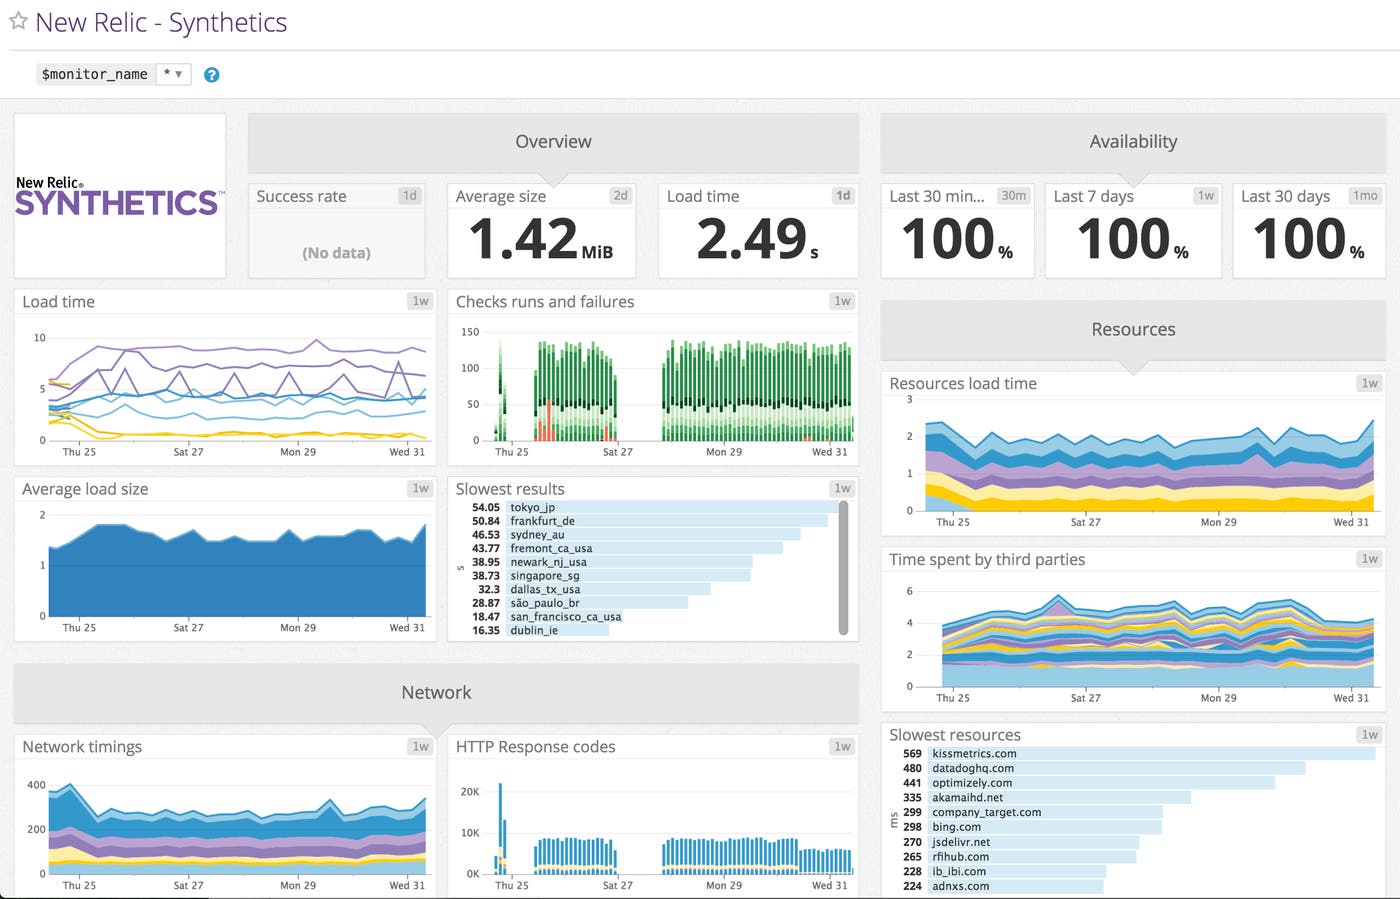
Adding to our support for New Relic’s high-level application metrics, Datadog also captures metrics from New Relic Synthetics so you can get insights on end-user experience via availability and scriptable transaction checks from browser engines deployed worldwide. In Datadog, you can graph and alert on metrics for app availability, load time, transaction checks, and more. You can also go deeper, breaking down a page’s load time by the exact loading processes, i.e., from DNS lookup, SSL negotiation and connection establishment, to the round-trip data transmission.
Correlate everything
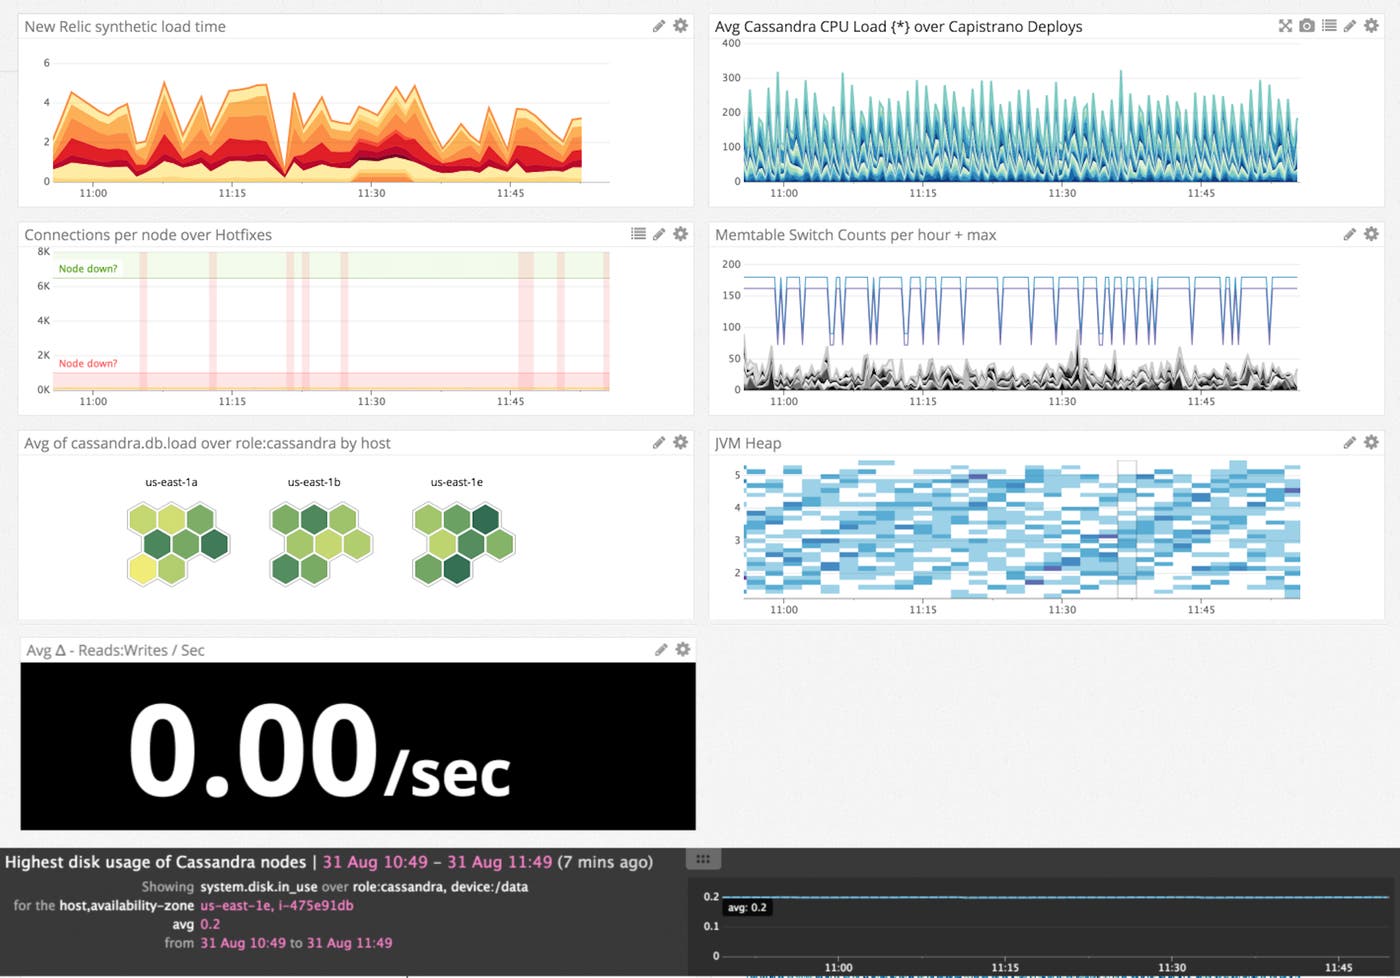
Because Datadog integrates not only with New Relic but with over 1,000 other infrastructure technologies, you can easily correlate metrics and events between systems. With a dashboard displaying performance metrics from New Relic together with metrics from your app servers, load balancers, caches, and databases, you can quickly pinpoint the root cause of performance problems and start to investigate right away.
Connect, collaborate, and share
You can also capture any application error, error analysis, alert, and deployment event from New Relic by creating a configurable Datadog webhook. These events appear in Datadog’s event stream with a brief summary and a link to the specific incident. The searchable, chronological event stream allows users across the organization to collaboratively address New Relic events in context with all of your other integration events. Engineers can comment, assign, prioritize and @-mention anyone to send a direct message about a specific event. From there, teams can work together to efficiently resolve the issue using the data and tools available in Datadog.

Get started
If you are already a Datadog customer, you can add insights from New Relic’s APM and Synthetics to the metrics you’re already gathering from your infrastructure. Otherwise, you can start a free, full-featured trial here right away.


