
Emily Chang
The Java Virtual Machine (JVM) dynamically manages memory for your applications, ensuring that you don’t need to manually allocate and release memory in your code. But anyone who’s ever encountered a java.lang.OutOfMemoryError exception knows that this process can be imperfect—your application could require more memory than the JVM is able to allocate. Or, as the JVM runs garbage collection to free up memory, it could create excessively long pauses in application activity that translate into a slow experience for your users. In this post, we’ll take a look at how the JVM manages heap memory with garbage collections, and we’ll cover some key metrics and logs that provide visibility into the JVM’s memory management. Then we will walk through correlating metrics, traces, and logs to gather more context around out-of-memory errors, and show you how to set up alerts to monitor memory-related issues with Datadog.
Java memory management overview
When the JVM starts up, it requests memory for the heap, an area of memory that the JVM uses to store objects that your application threads need to access. This initial heap size is configured by the -Xms flag. The JVM will dynamically allocate memory to your application from the heap, up to the maximum heap size (the maximum amount of memory the JVM can allocate to the heap, configured by the -Xmx flag). The JVM automatically selects initial and maximum heap sizes based on the physical host’s resource capacity, unless you specify otherwise. If your application’s heap usage reaches the maximum size but it still requires more memory, it will generate an OutOfMemoryError exception.
You can explicitly configure the initial and maximum heap size with the -Xms and -Xmx flags (e.g., -Xms 50m -Xmx 100g will set a minimum heap of 50 MB and a maximum heap of 100 GB).
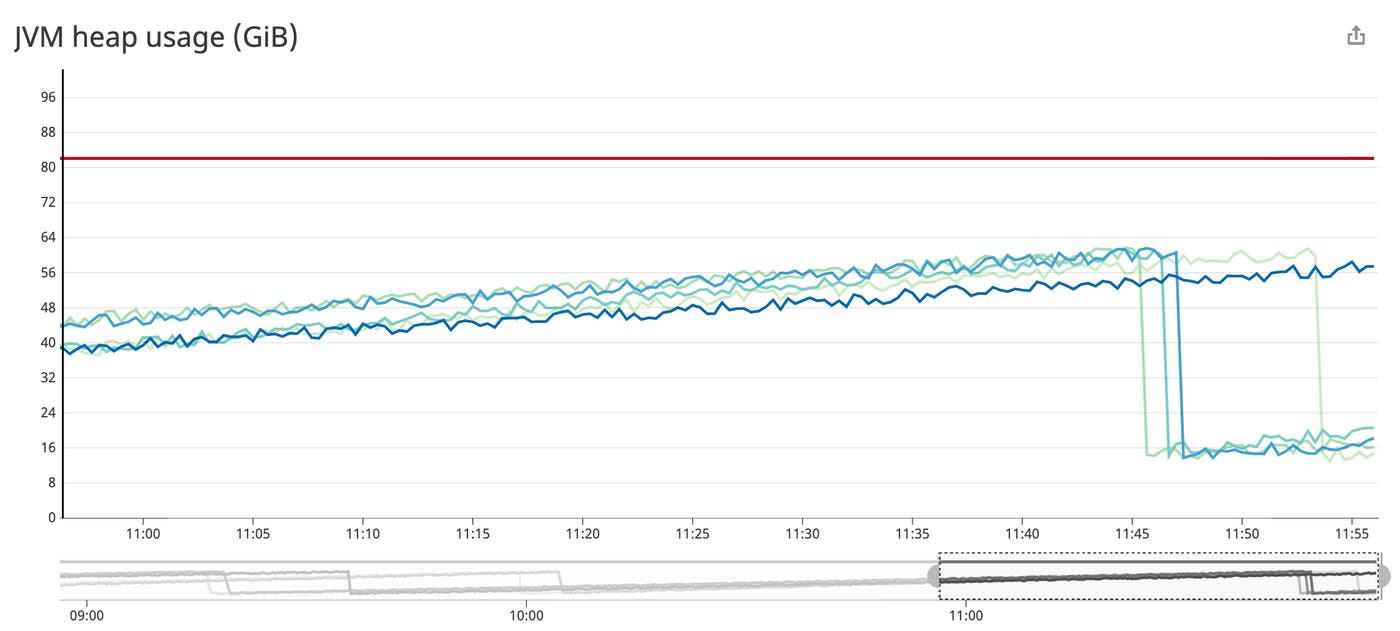
As your application creates objects, the JVM dynamically allocates memory from the heap to store those objects, and heap usage rises. In the graph above, you can see average heap usage (each blue or green line represents a JVM instance) along with the maximum heap usage (in red). The JVM also runs garbage collection to free up memory from objects that your application is no longer using, periodically creating a dip in heap usage. This helps ensure that the JVM will have enough memory to allocate to newly created objects.
Garbage collector algorithms
Garbage collection is necessary for freeing up memory, but it temporarily pauses application threads, which can lead to user-facing latency issues. Ideally, the JVM should run garbage collection frequently enough to free up memory that the application requires—but not so often that it interrupts application activity unnecessarily. Java garbage collection algorithms have evolved over the years to reduce the length of pauses and free up memory as efficiently as possible. As of Java 9, the Garbage-First garbage collector, or G1 GC, is the default collector. Although other, more efficient garbage collectors are in development, G1 GC is currently the best option for production-ready applications that require large amounts of heap memory and shorter pauses in application activity. Therefore, we will focus on the G1 collector in this post.
How the G1 collector organizes the heap
G1 equally divides the heap into regions; each region is assigned to either the young generation or the old generation. The young generation consists of eden regions and survivor regions, while the old generation is made up of old regions and humongous regions (for storing “humongous” objects that require more than 50 percent of a region’s worth of memory). With the exception of humongous objects, newly allocated objects get assigned to an eden region in the young generation, and then move to older regions (survivor or old regions) based on the number of garbage collections they survive.
Phases of G1 garbage collection
As a Java application runs, the garbage collector takes inventory of which objects are still being used or referenced (“live” objects), and which objects are no longer needed (“dead” objects) and can be removed from the heap. Stop-the-world pauses (when all application activity temporarily comes to a halt) typically occur when the collector evacuates live objects to other regions and compacts them to recover more memory.
The G1 garbage collection cycle alternates between a young-only phase and a space-reclamation phase. During the young-only phase, the G1 collector runs two types of processes:
- young garbage collections, which evacuate live objects from eden to survivor regions or survivor to old regions, based on their age.
- a marking cycle, which involves taking inventory of live objects in old-generation regions. G1 begins this process in preparation for the space-reclamation phase if it detects that a certain percentage of the old generation is occupied.
Some phases of the marking cycle run concurrently with the application. During these, the JVM can continue allocating memory to the application as needed. If the garbage collector successfully completes the marking cycle, it will typically transition into the space-reclamation phase, where it runs multiple mixed collections, so named because they evacuate objects across a mixture of young and old regions. When the G1 collector determines that mixed collections have evacuated enough old-generation regions without exceeding the pause time goal (the desired maximum duration of stop-the-world pauses), the young-only phase begins again.
If, on the other hand, the G1 collector runs too low on available memory to complete the marking cycle, it may need to kick off a full garbage collection. A full GC typically takes longer than a young-only or mixed collection, since it evacuates objects across the entire heap, instead of in strategically selected regions. You can track how often full garbage collections occur by collecting and analyzing your garbage collection logs, which we’ll cover in the next section.
Useful JVM metrics and logs to monitor
We’ve provided a brief (and simplified) overview of JVM memory management and explored how the JVM uses garbage collection to free up heap memory that is no longer being used. In this section, we’ll explore the key JVM runtime metrics and garbage collection logs that can help you monitor memory-related issues in your Java applications.
JVM runtime metrics
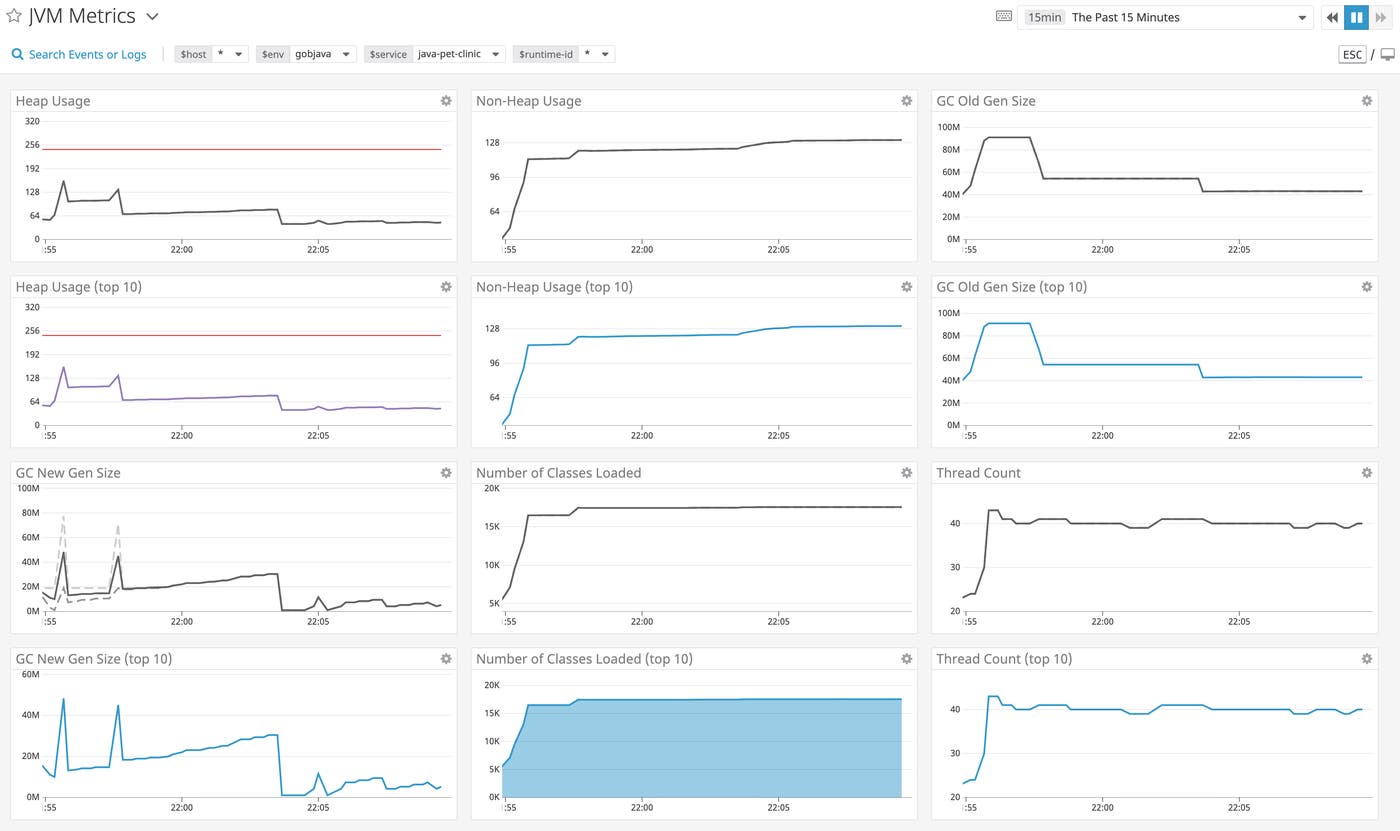
The JVM exposes runtime metrics—including information about heap memory usage, thread count, and classes—through MBeans. A monitoring service such as Datadog’s Java Agent can run directly in the JVM, collect these metrics locally, and automatically display them in an out-of-the-box dashboard like the one shown above. With distributed tracing and APM, you can also correlate traces from individual requests with JVM metrics. Below, you can see the time of the trace overlaid on each metric graph for easy correlation, allowing you to visualize the health of the application’s runtime environment at the time of a slow request.
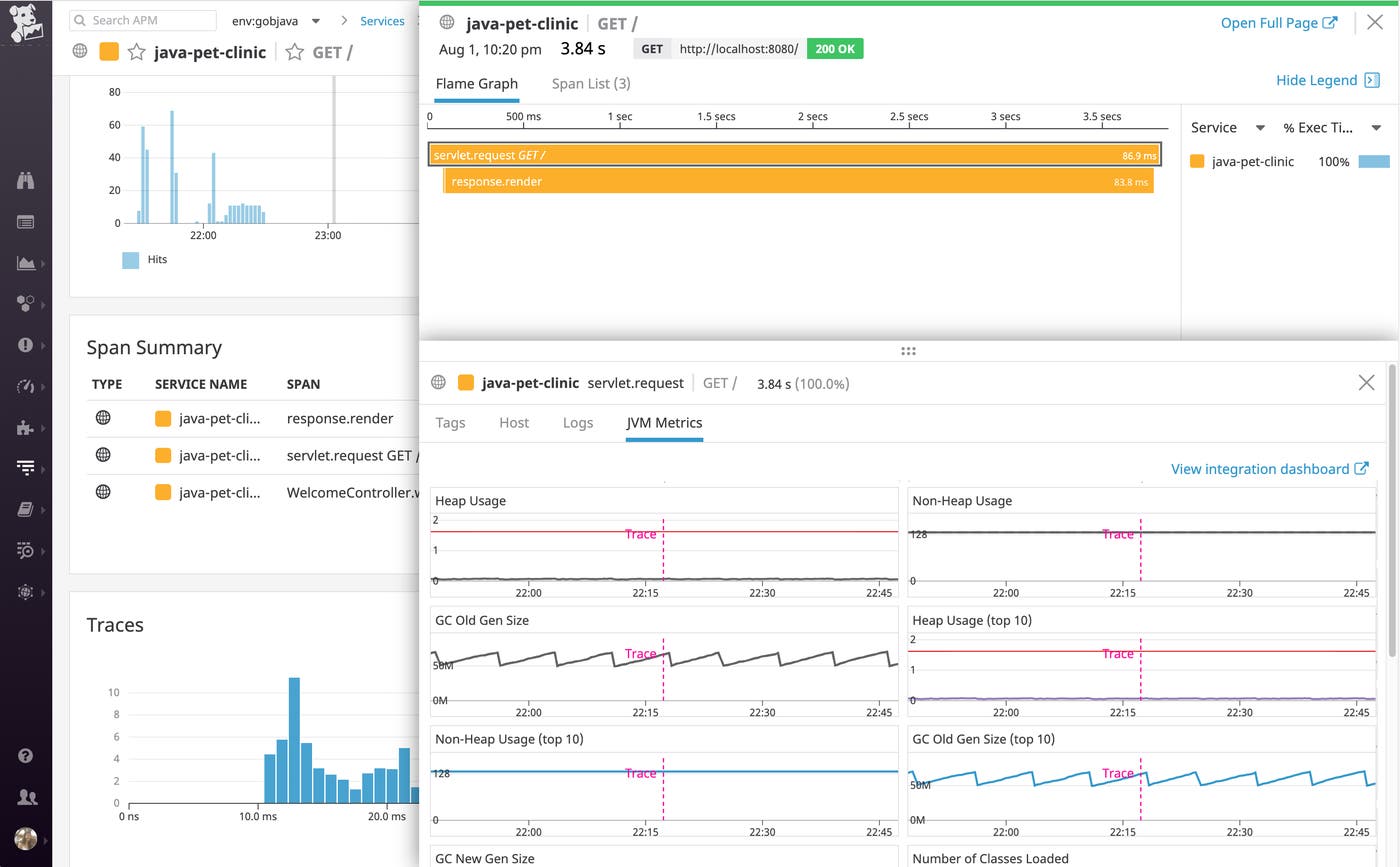
Next, we’ll cover a few key JVM metric trends that can help you detect memory management issues.
Average heap usage after each garbage collection is steadily rising
If you notice that the baseline heap usage is consistently increasing after each garbage collection, it may indicate that your application’s memory requirements are growing, or that you have a memory leak (the application is neglecting to release references to objects that are no longer needed, unintentionally preventing them from getting garbage collected). In either case, you’ll want to investigate and either allocate more heap memory to your application (and/or refactor your application logic to allocate fewer objects), or debug the leak with a utility like VisualVM or Mission Control.
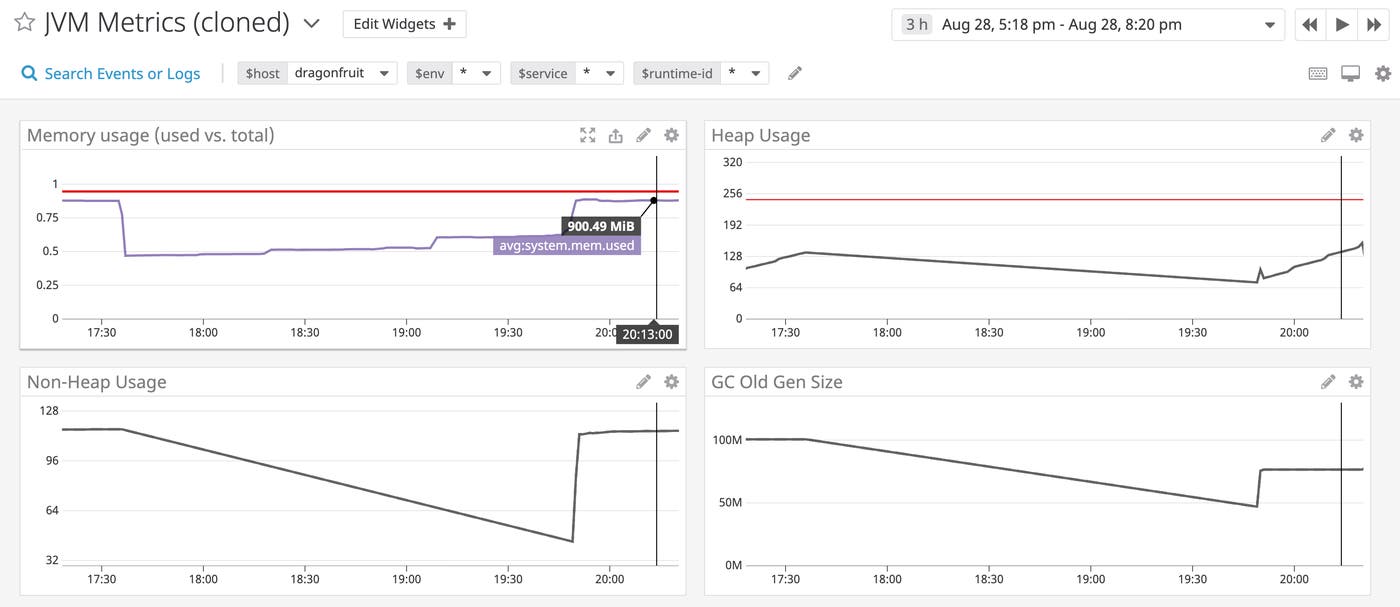
If you need to increase the heap size, you can look at a few other metrics to determine a reasonable setting that won’t overshoot your host’s available resources. Keep in mind that the JVM also carries some overhead (e.g., it stores the code cache in non-heap memory). The java.lang:type=Memory MBean exposes metrics for HeapMemoryUsage and NonHeapMemoryUsage so you can account for the JVM’s combined heap and non-heap memory usage. You can also compare your physical server’s system-level memory usage with JVM heap and non-heap usage by graphing these metrics on the same dashboard.
Old generation size is increasing
The JVM exposes a Usage.used metric via the java.lang:name=G1 Old Gen,type=MemoryPool MBean, which measures the amount of memory allocated to old-generation objects (note that this includes live and dead objects that have yet to be garbage collected). This metric should stay flat under normal circumstances. If you see an unexpected increase in this metric, it could signal that your Java application is creating long-lived objects (as objects age, the garbage collector evacuates them to regions in the old generation), or creating more humongous objects (which automatically get allocated to regions in the old generation).
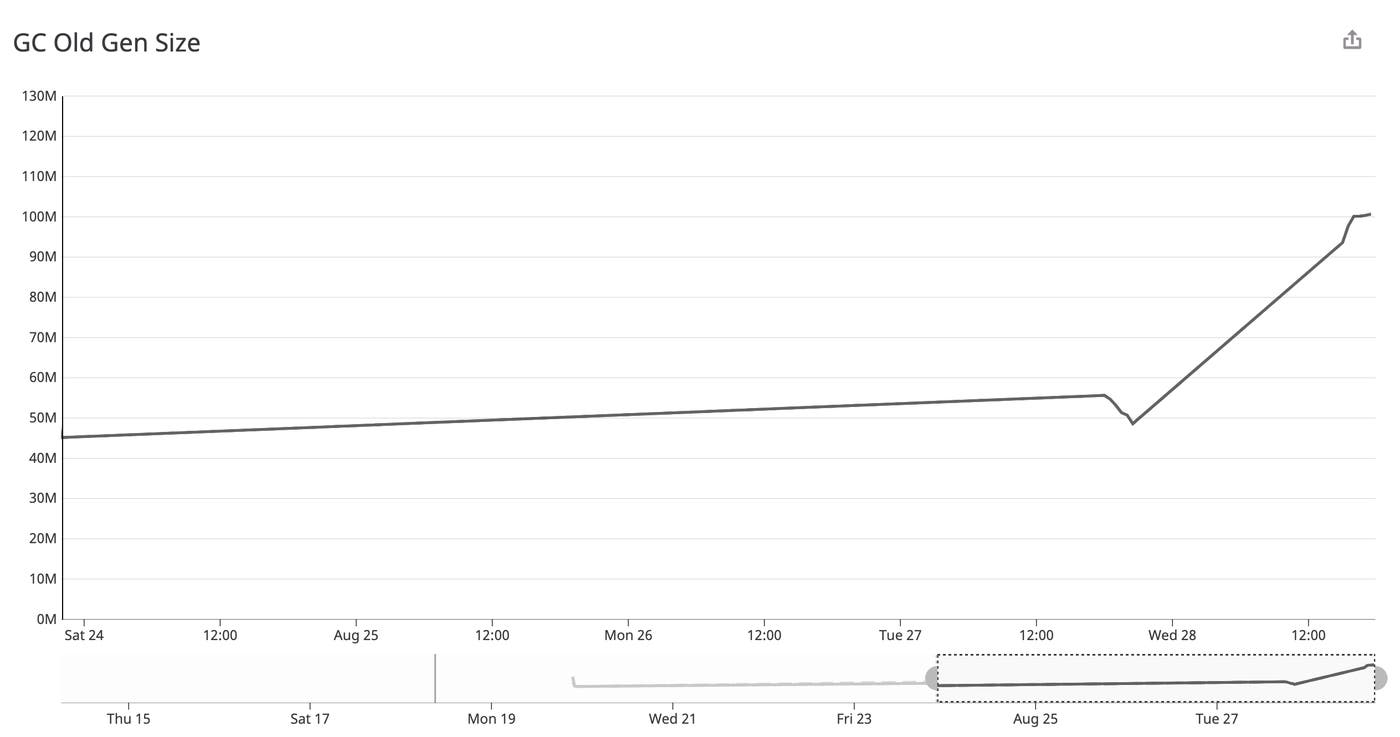
Percent of time spent in garbage collection
By default, the G1 collector attempts to spend about 8 percent of the time running garbage collection (configurable via the XX:GCTimeRatio setting). But similar to the pause time goal mentioned above, the JVM cannot guarantee that it will be able to meet this projection.
You can track the amount of time spent in each phase of garbage collection by querying the CollectionTime metric from three MBeans, which will expose the young-only, mixed, and old (full) garbage collection time in milliseconds:
java.lang:type=GarbageCollector,name=G1 Young Generationjava.lang:type=GarbageCollector,name=G1 Mixed Generationjava.lang:type=GarbageCollector,name=G1 Old Generation
To estimate the proportion of time spent in garbage collection, you can use a monitoring service to automatically query this metric, convert it to seconds, and calculate the per-second rate.
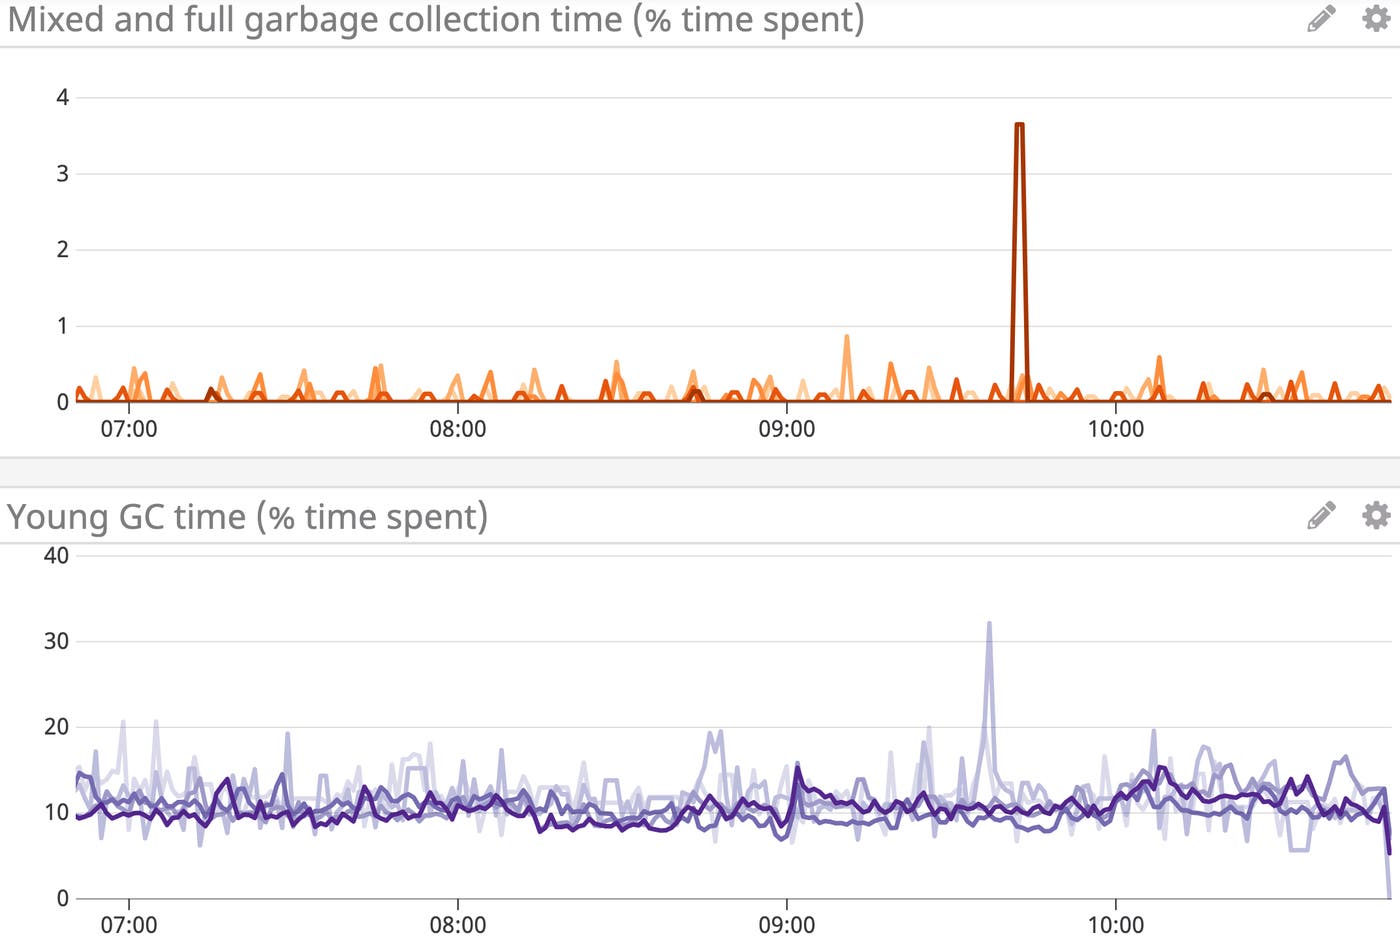
Above, we’ve graphed the percentage of time spent in mixed and full collections in the top graph, and percentage of time spent in young garbage collection in the lower graph. You can also correlate the percentage of time spent in garbage collection with heap usage by graphing them on the same dashboard, as shown below.
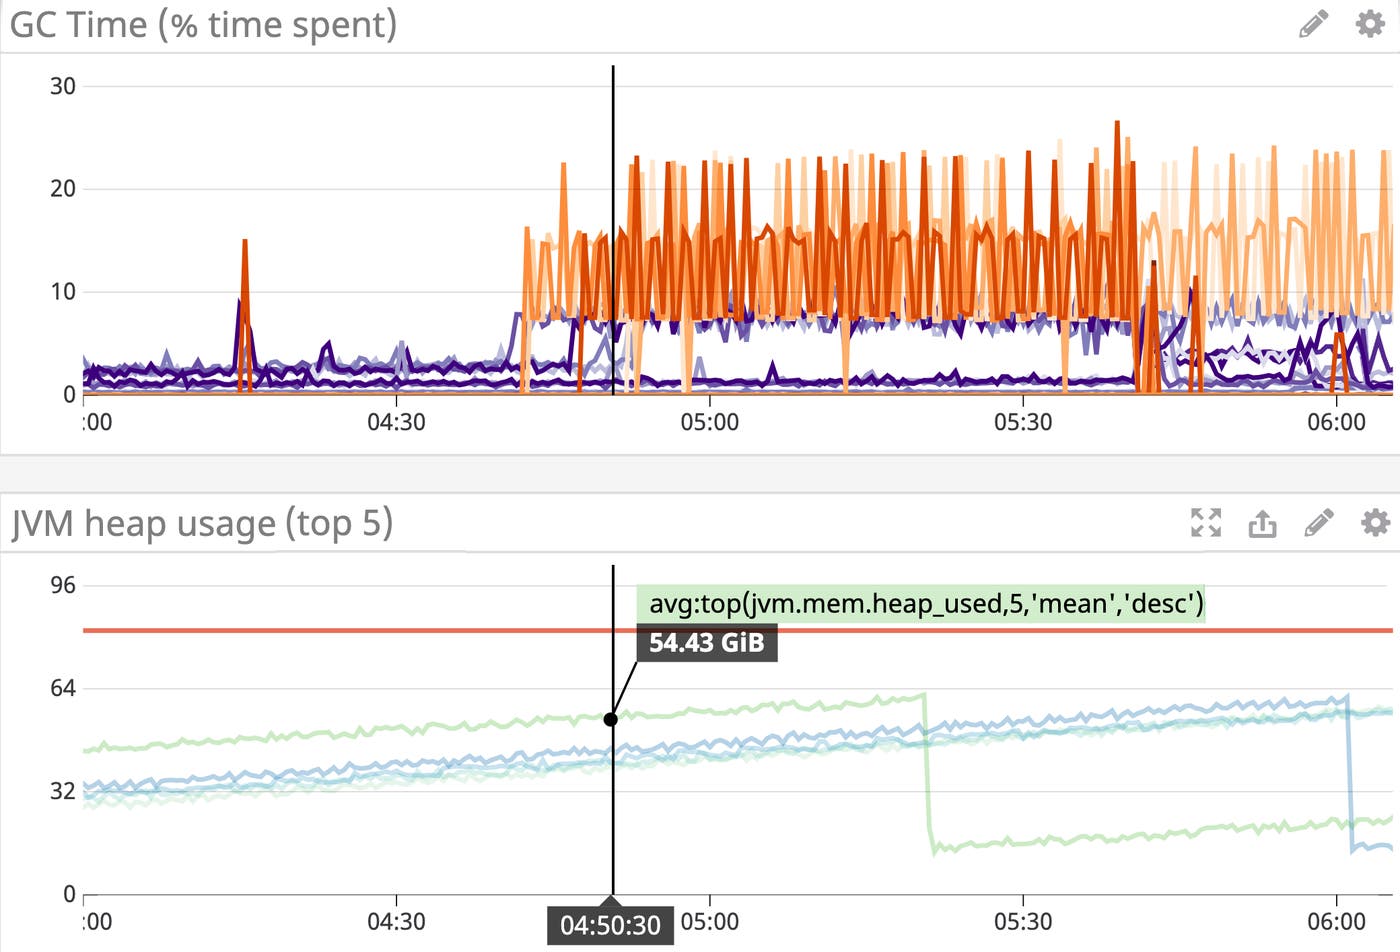
Although metrics give you a general idea of garbage collection frequency and duration, they don’t always provide the level of detail that you need to debug issues. If you notice that your application is spending more time in garbage collection, or heap usage is continually rising even after each garbage collection, you can consult the logs for more information.
Garbage collection logs
Logs provide more granular details about the individual stages of garbage collection. They also help provide more insight than JVM metrics alone when your application crashes due to an out-of-memory error—you can often get more information about what happened by looking at the logs around the time of the crash. Moreover, you can use logs to track the frequency and duration of various garbage collection–related processes: young-only collections, mixed collections, individual phases of the marking cycle, and full garbage collections. Logs can also tell you how much memory was freed as a result of each garbage collection process.
The -verbose:gc flag configures the JVM to log these details about each garbage collection process. As of Java 9, the JVM Unified Logging Framework uses a different flag format to generate verbose garbage collection log output: -Xlog:gc* (though -verbose:gc still works as well). See the documentation for details about converting pre-Java 9.x garbage collection logging flags to the new Xlog flags.
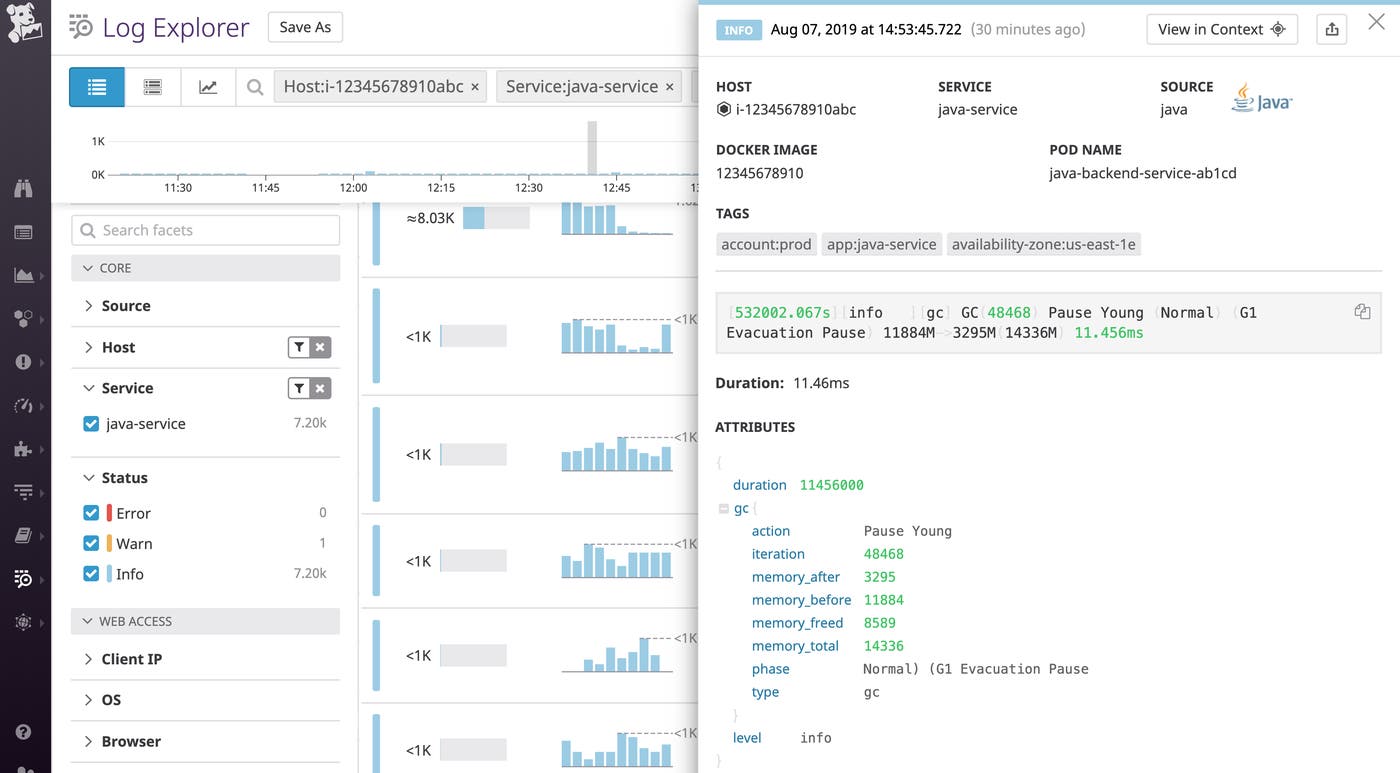
In the screenshot above, you can see an example of a verbose garbage collection log. The first field shows the time since the JVM last started or restarted (532,002.067 seconds), followed by the status level of the log (info). The output also indicates that the G1 collector ran a young-only garbage collection, which introduced a stop-the-world pause as it evacuated objects to other regions. The garbage collector reduced heap usage from 11,884 MB (gc.memory_before) to 3,295 MB (gc.memory_after). The next field (gc.memory_total) states the heap size: 14,336 MB. Finally, duration lists the amount of time this garbage collection took: 11.456 ms.
A log management service can automatically parse attributes from your logs, including the duration of the collection. It can also calculate the difference between the memory_before and memory_after values to help you track the amount of memory freed (gc.memory_freed in the processed log above) by each process, allowing you to analyze how efficiently your garbage collector frees memory over time. You can then compare it with JVM metrics like the percentage of time spent in garbage collection.
If your application is spending a large percentage of time in garbage collection, but the collector is able to successfully free memory, you could be creating a lot of short-lived allocations (frequently creating objects and then releasing references to them). To reduce the amount of time spent in garbage collection, you may want to reduce the number of allocations your application requires by looking at the allocations it’s currently making with the help of a tool like VisualVM.
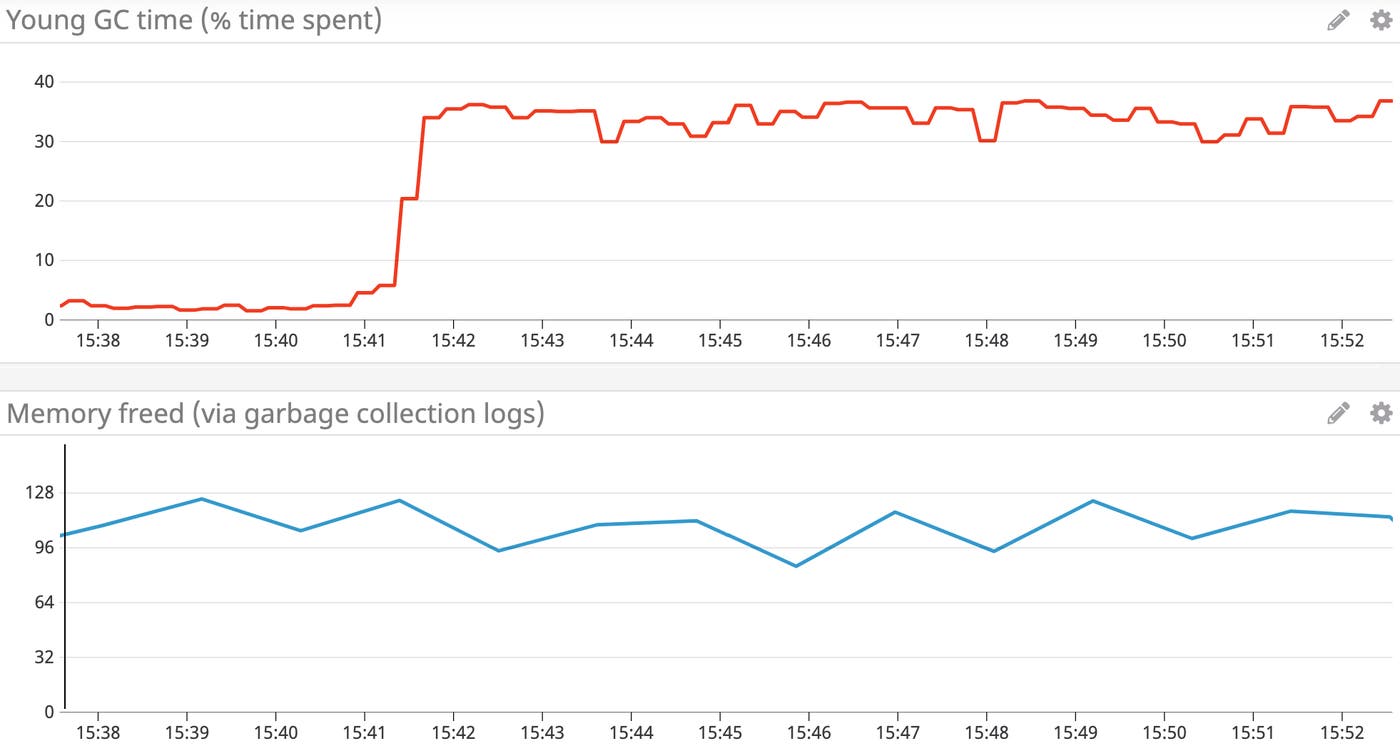
On the other hand, if your application is spending more time in garbage collection and those garbage collections are freeing less memory over time, this may indicate that you are creating more long-lived objects (objects that reside in the heap for long periods of time and therefore cannot be garbage collected). If this is the case, you can either try to reduce the amount of memory your application requires or increase the size of the heap to avoid triggering an out-of-memory error.
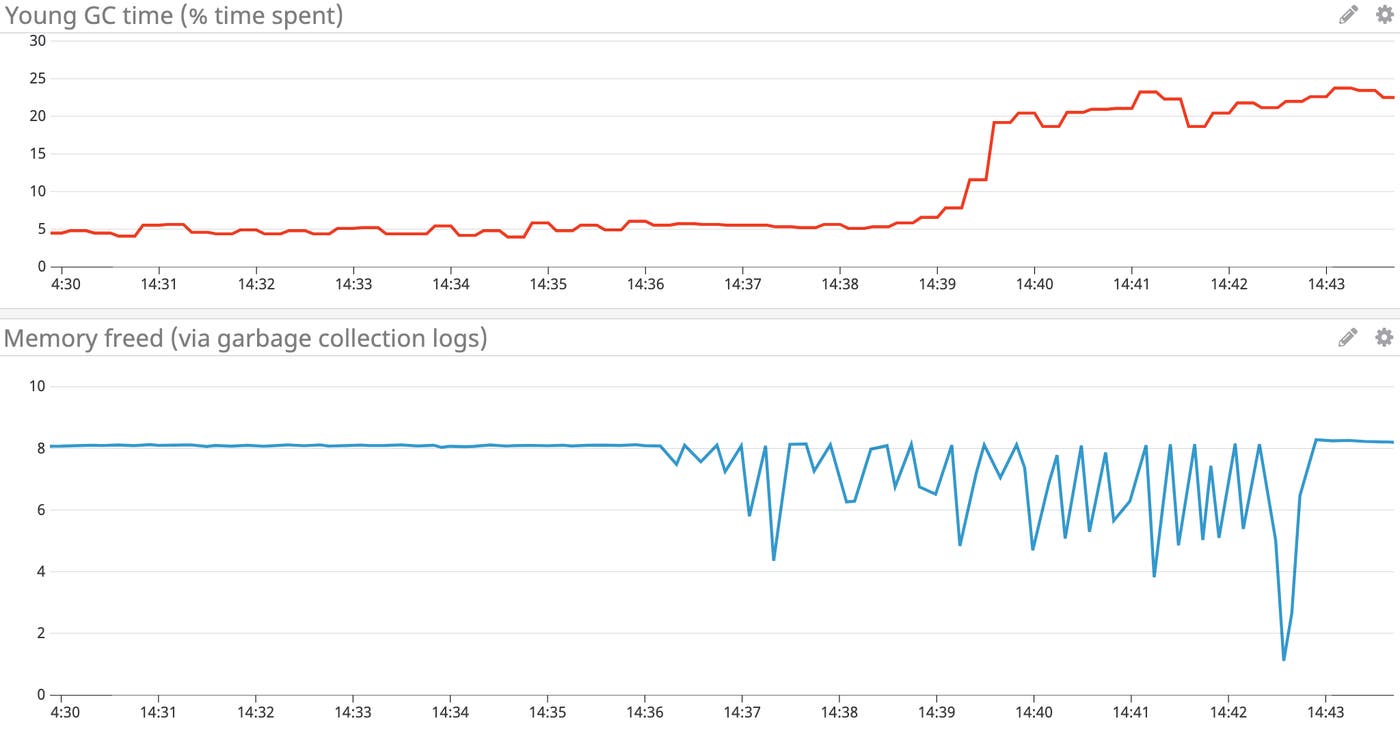
In addition to using logs to track the efficiency and frequency of garbage collection processes, you can also keep an eye out for logs that indicate that your JVM is struggling to keep up with your application’s memory requirements. Below, we’ll explore two noteworthy logs in detail:
- “To-space exhausted”
- Full GC, or full garbage collections
To-space exhausted
If your heap is under pressure, and garbage collection isn’t able to recover memory quickly enough to keep up with your application’s needs, you may see “To-space exhausted” appear in your logs. This indicates that the garbage collector does not have enough “to-space,” or free space to evacuate objects to other regions. If you see this log, it usually indicates that the collector will need to run a full garbage collection soon.

Full garbage collections
The G1 collector occasionally needs to run a full garbage collection if it can’t keep up with your application’s memory requirements. Other types of collections strategically target specific regions in an attempt to meet a pause time goal. By contrast, full garbage collections typically take longer (leading to longer pauses in application activity) because they require the G1 collector to free memory across the entire heap.
In the log below, you can see that this full garbage collection was able to free 2,620 MB of memory, but it also took almost five seconds (duration). During this time the application was unable to perform any work, leading to high request latency and poor performance.
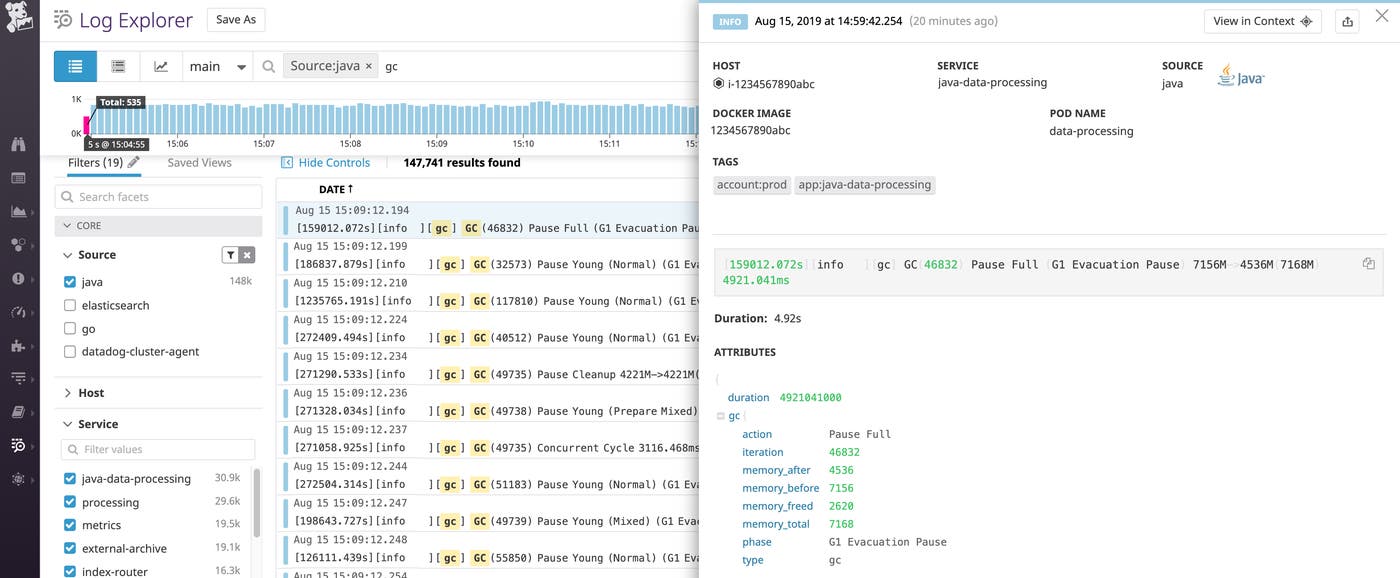
A full garbage collection typically occurs when the collector does not have enough memory to complete a phase of the marking cycle. If this happens, you may see a [GC concurrent-mark-start] log that indicates the start of the concurrent marking phase of the marking cycle, followed by a Full GC (Allocation Failure) log that kicks off a full garbage collection because the marking cycle did not have enough memory to proceed. Shortly after that, you’ll see a [GC concurrent-mark-abort] log that confirms that the collector was forced to abandon the marking cycle:
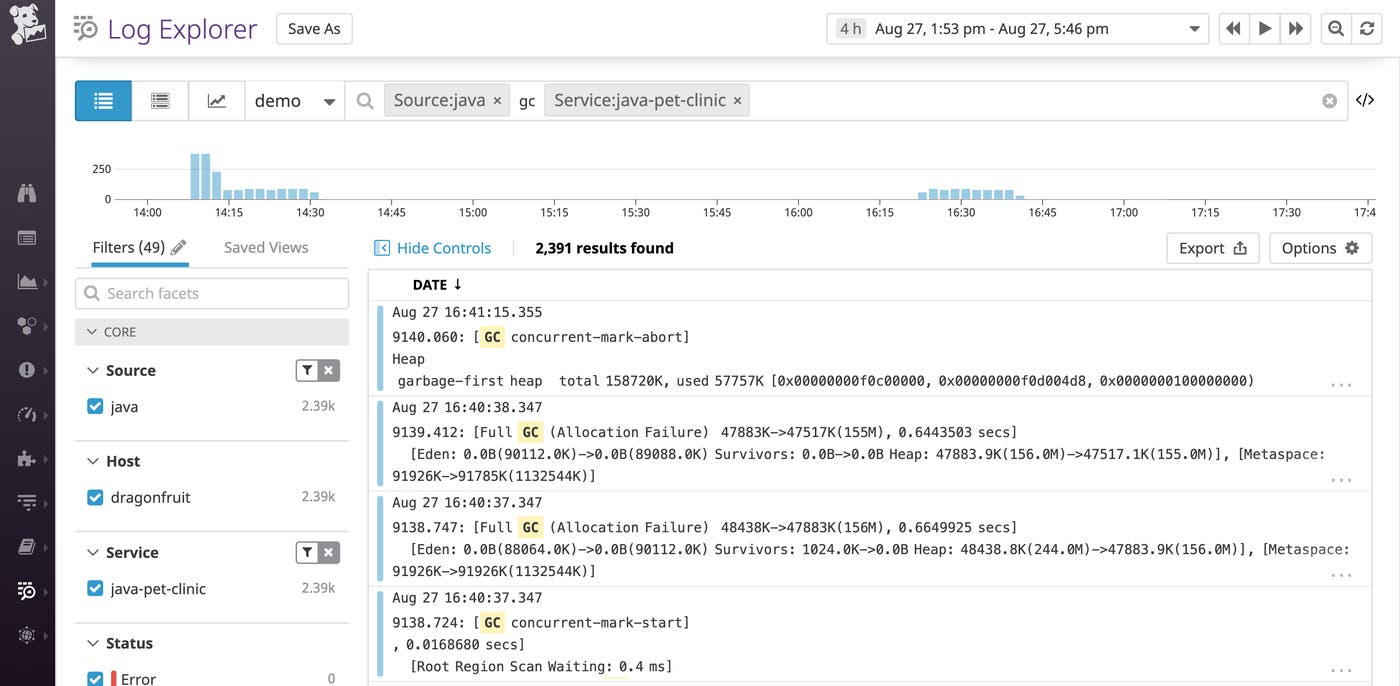
Another contributing factor to full garbage collections is humongous object allocation. Humongous objects get allocated directly to the old generation and take up more memory than normal objects. If your application requests memory allocations for humongous objects, it increases the likelihood that the G1 collector will need to run a full garbage collection.
Humongous objects can sometimes require more than one region’s worth of memory, which means that the collector needs to allocate memory from neighboring regions. This can lead the JVM to run a full garbage collection (even if it has enough memory to allocate across disparate regions) if that is the only way it can free up the necessary number of continuous regions for storing each humongous object.
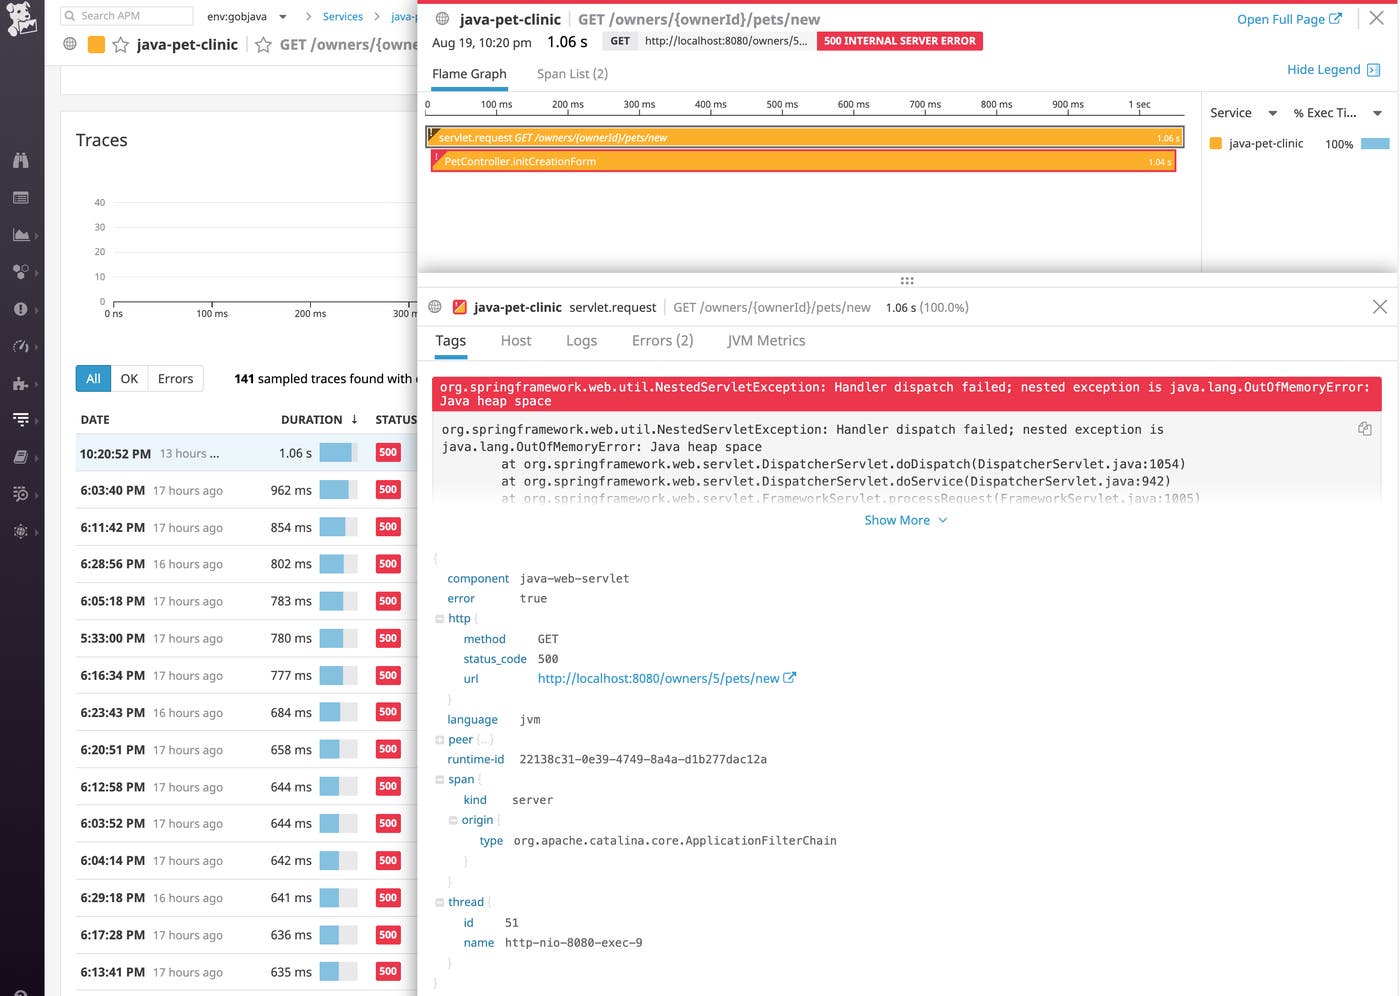
If you notice that your application is running more full garbage collections, it signals that the JVM is facing high memory pressure, and the application could be in danger of hitting an out-of-memory error if the garbage collector cannot recover enough memory to serve its needs. An application performance monitoring service like Datadog can help you investigate out-of-memory errors by letting you view the full stack trace in the request trace (as shown below), and navigate to related logs and runtime metrics for more information.
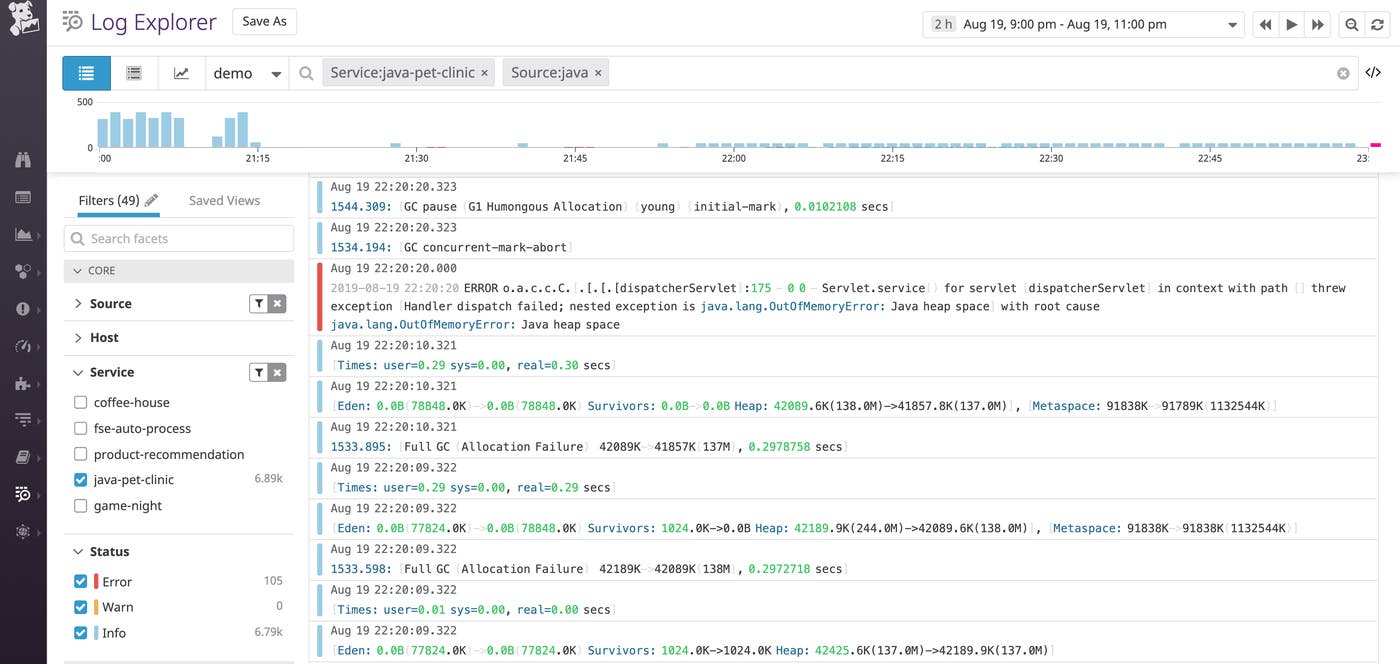
Collecting and correlating application logs and garbage collection logs in the same platform allows you to see if out-of-memory errors occurred around the same time as full garbage collections. In the log stream below, it looks like the G1 garbage collector did not have enough heap memory available to continue the marking cycle (concurrent-mark-abort), so it had to run a full garbage collection (Full GC Allocation Failure). The application also generated an out-of-memory error (java.lang.OutOfMemoryError: Java heap space) around this time, indicating that this heap memory pressure was affecting application performance.
Monitoring the JVM’s ability to efficiently manage and allocate memory on a regular basis is crucial for ensuring that your Java applications run smoothly. In the next section, we’ll walk through how you can set up alerts to automatically keep tabs on JVM memory management issues and application performance.
Alerts for JVM memory management issues
An abnormal rise in heap usage indicates that garbage collection isn’t able to keep up with your application’s memory requirements, which can lead to user-facing application latency and out-of-memory errors. In Datadog, you can set up a threshold alert to automatically get notified when average heap usage has crossed 80 percent of maximum heap size.
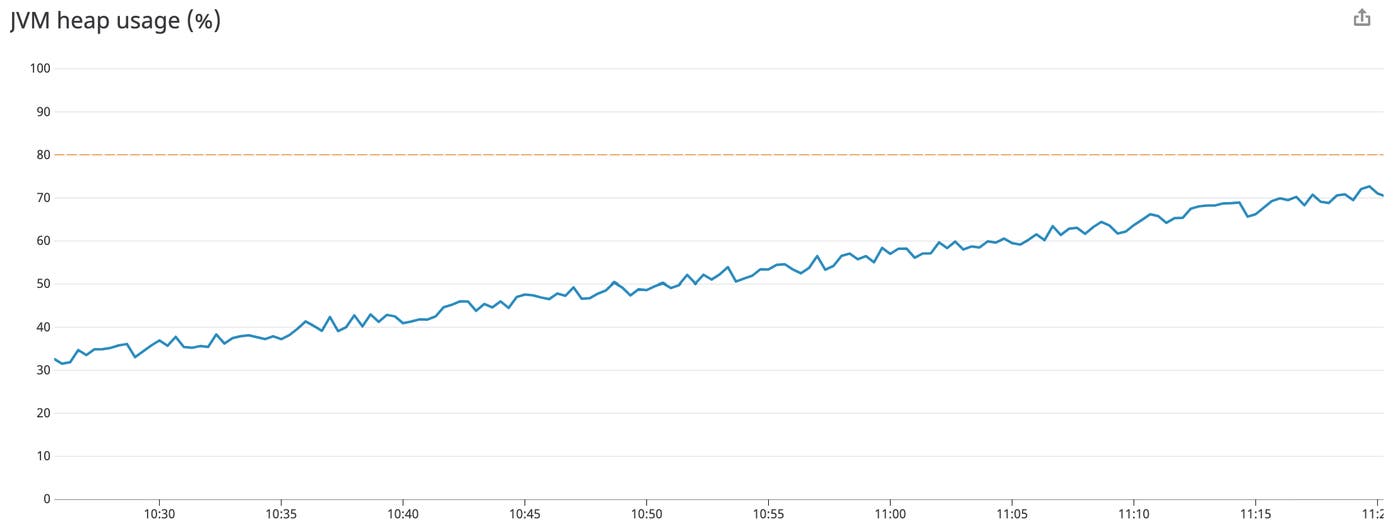
If you receive this notification, you can try increasing the maximum heap size, or investigate if you can revise your application logic to allocate fewer long-lived objects.
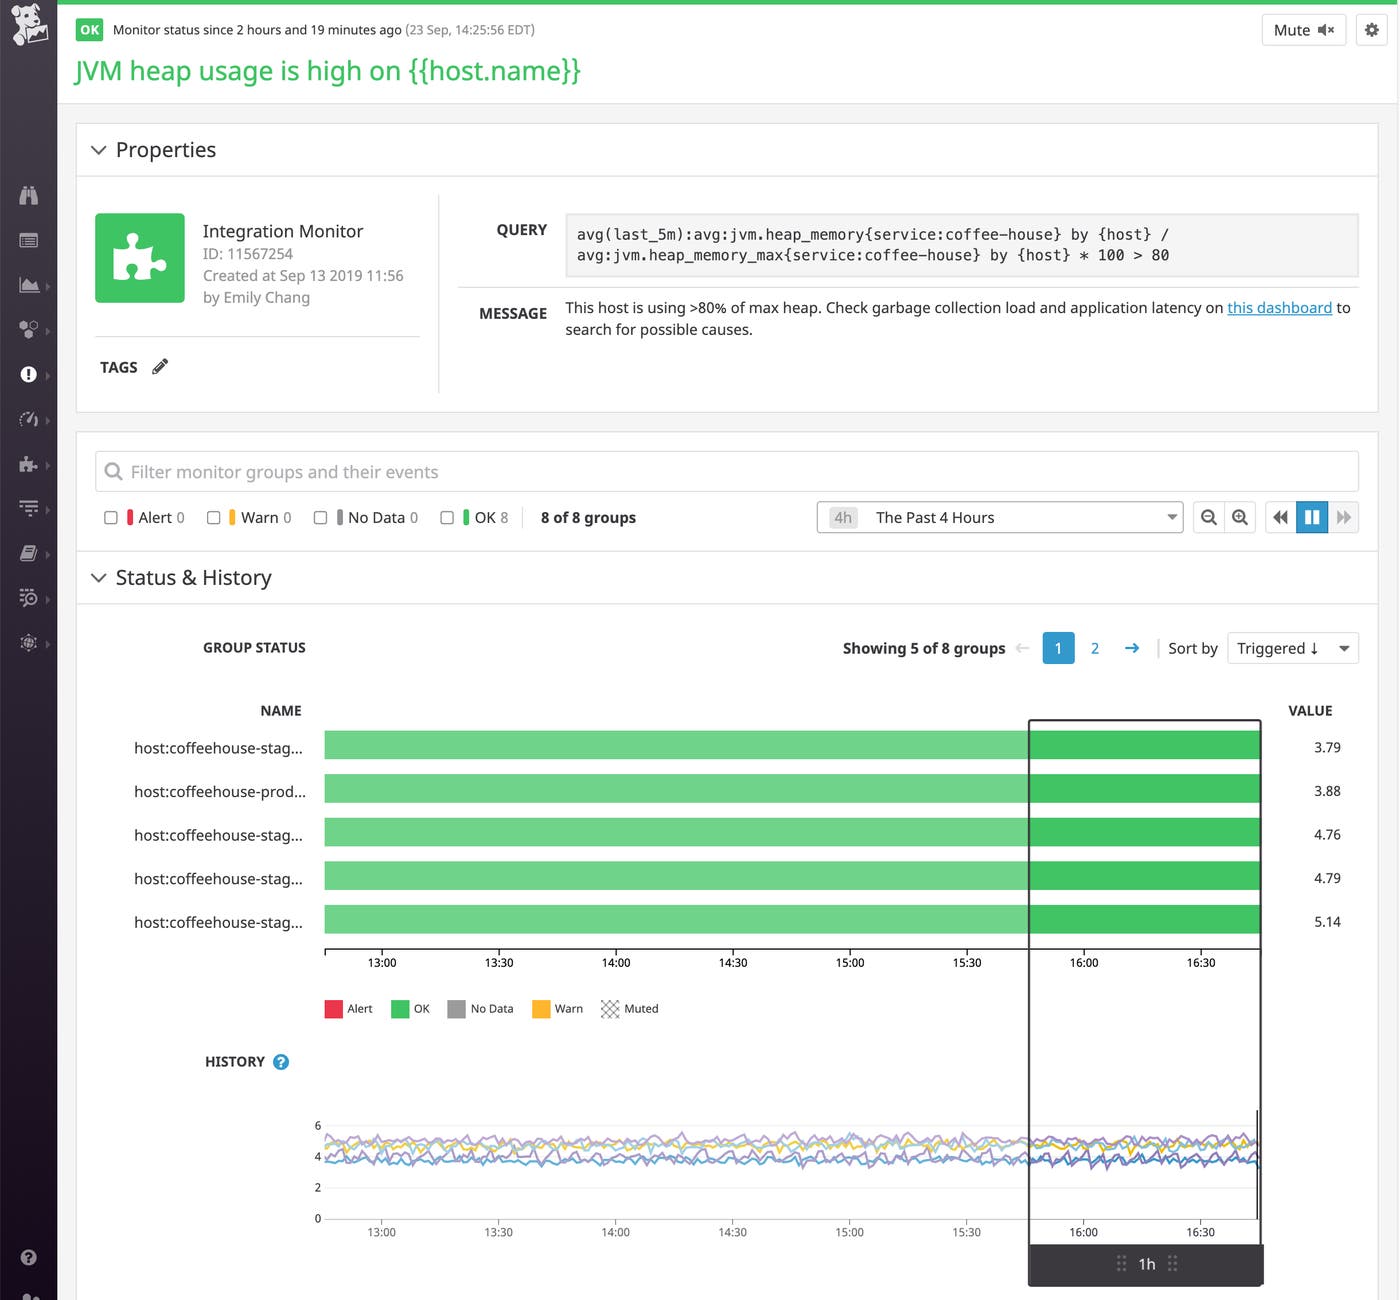
Since the G1 collector conducts some of its work concurrently, a higher rate of garbage collection activity isn’t necessarily a problem unless it introduces lengthy stop-the-world pauses that correlate with user-facing application latency. Datadog APM provides alerts that you can enable with the click of a button if you’d like to automatically track certain key metrics right away. For example, you can enable a suggested alert that notifies you when the 90th-percentile latency for user requests to your Java application (service:java-pet-clinic in this case) exceeds a threshold, or when the error rate increases.

If you get alerted, you can navigate to slow traces in APM and correlate them with JVM metrics (such as the percentage of time spent in garbage collection) to see if latency may be related to JVM memory management issues.

Monitor Java memory management and app performance
The JVM automatically works in the background to reclaim memory and allocate it efficiently for your application’s changing resource requirements. Garbage collection algorithms have become more efficient about reducing stop-the-world pauses in application activity, but they can’t guarantee protection against out-of-memory errors. You need comprehensive visibility across your application and its JVM runtime environment in order to effectively troubleshoot out-of-memory errors—and to detect memory management–related issues before those errors even occur.
If you’re using Datadog APM to monitor the performance of your Java application, you can correlate application performance data, request traces, JVM runtime metrics, and garbage collection logs to investigate if a spike in latency is related to a memory management issue (e.g., do you need to increase the heap or revise your application to allocate fewer objects?) or a different type of bottleneck.
The Datadog Agent’s built-in JMXFetch utility queries MBeans for key metrics like heap usage, garbage collection time, and old generation size. And Datadog APM’s Java client provides deep visibility into application performance by automatically tracing requests across frameworks and libraries in the Java ecosystem, including Tomcat, Spring, and database connections via JDBC.
To learn more about Datadog’s Java monitoring features, check out the documentation. If you’re new to Datadog and would like to monitor the health and performance of your Java applications, sign up for a free trial to get started.


