
David M. Lentz
SAP HANA is a data analytics platform that uses an in-memory, column-oriented data store to efficiently execute transactional (OLTP) and analytical (OLAP) queries. It can perform these queries against its own tables, or against data that resides in remote, non-SAP databases like Hadoop or SQL Server. SAP HANA also serves as the database behind SAP’s S/4HANA ERP platform. Datadog’s new integration helps you better understand the health and performance of your SAP HANA systems. Our out-of-the-box SAP HANA dashboard makes it easy to see key resource metrics, including memory usage of your databases and disk space usage for data and log storage.
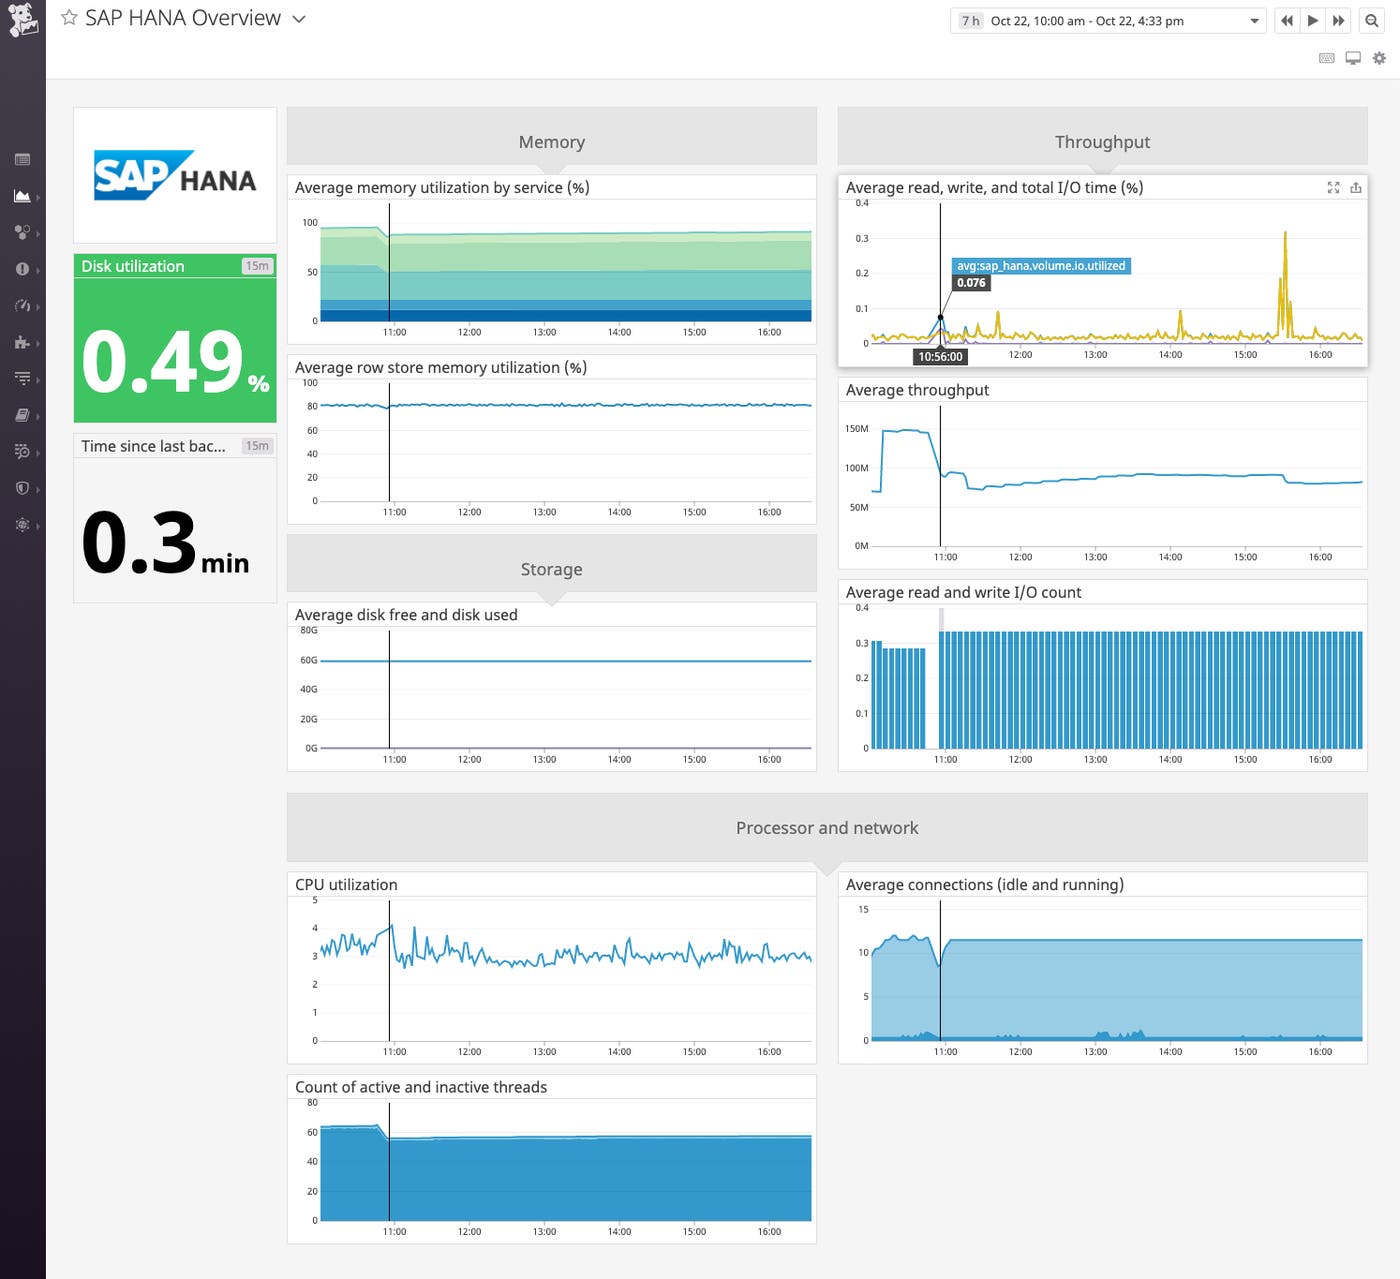
Visualize your memory usage
SAP HANA stores data in memory, which allows it to read and write data much faster than a disk-based database can. Because of this, monitoring SAP HANA’s memory usage is critical to understanding its performance and ensuring that it will meet the needs of your users. If SAP HANA exhausts its available memory, it has to unload column table data from memory to process new queries. This can slow down query execution, resulting in increased latency for end-users.
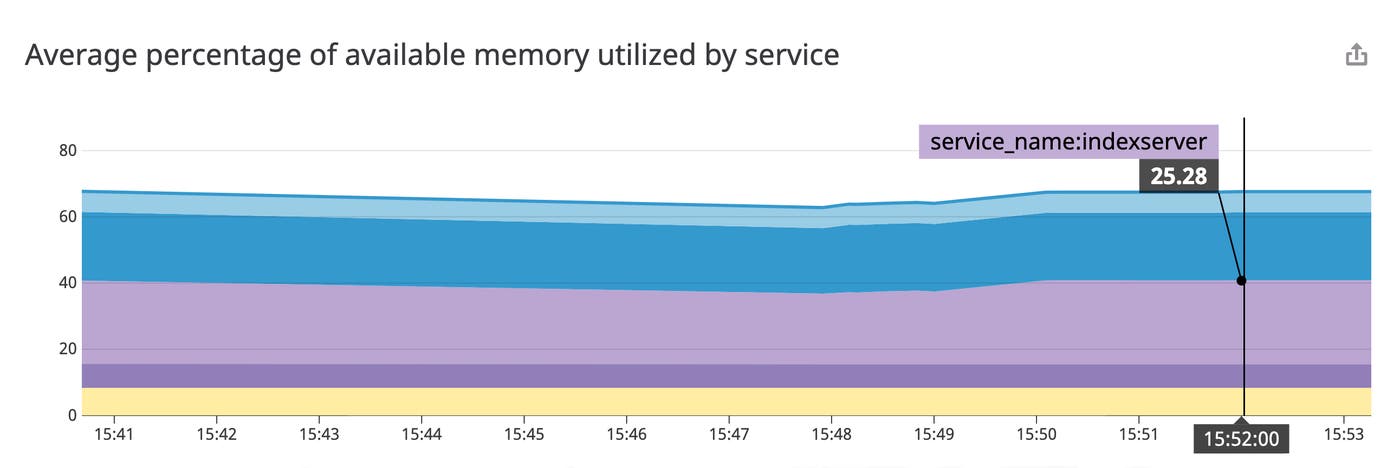
SAP HANA exposes several metrics that track memory utilization across its different services. The total memory usage of a SAP HANA system is the memory, in bytes, across all server components required to hold program code and in-memory data, as well as to compute query results. Tracking a metric like sap_hana.memory.service.overall.utilized, which monitors the percentage of available memory that your SAP HANA system is using, can help you determine if you’re in danger of running out of memory.
The graph below visualizes total overall memory utilization and also shows a breakdown of how memory utilization is distributed across SAP HANA components, which can help reveal if your SAP HANA services experience any unexpected increases or decreases in memory usage.
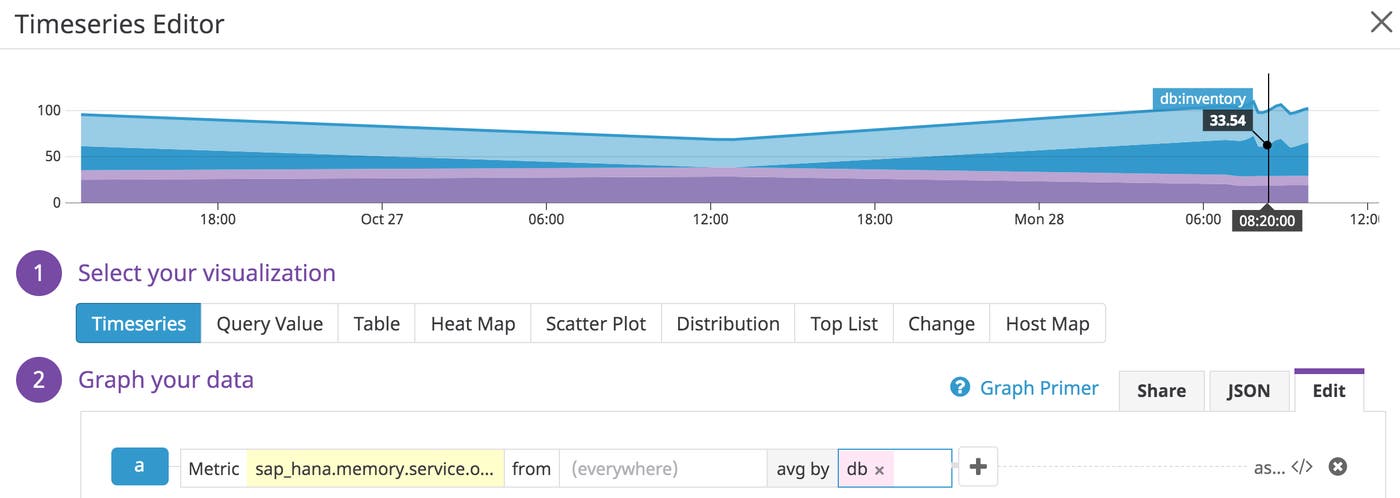
You can also track memory usage by database to show, for example, which databases are using the most memory. This can help you with capacity planning and may inform how you use workload classes to balance resource usage across your databases. The screenshot below shows how you can create a graph using the same sap_hana.memory.service.overall.utilized metric used in the previous example, now aggregated by db, to display the average memory utilization for each database.
Alert on your available storage
SAP HANA is an in-memory data store, but it periodically updates a persistent copy of the data on disk. Snapshots of the data, called savepoints, are written to disk every five minutes by default. Between savepoints, SAP HANA writes redo logs to disk to record the changes made to the in-memory data. If it needs to recover from a failure, SAP HANA can load the data from the most recent savepoint into memory, and then replay the logs to return the database to its previous state. SAP HANA creates separate data volumes to store each database’s savepoints, and log volumes to store their redo logs.
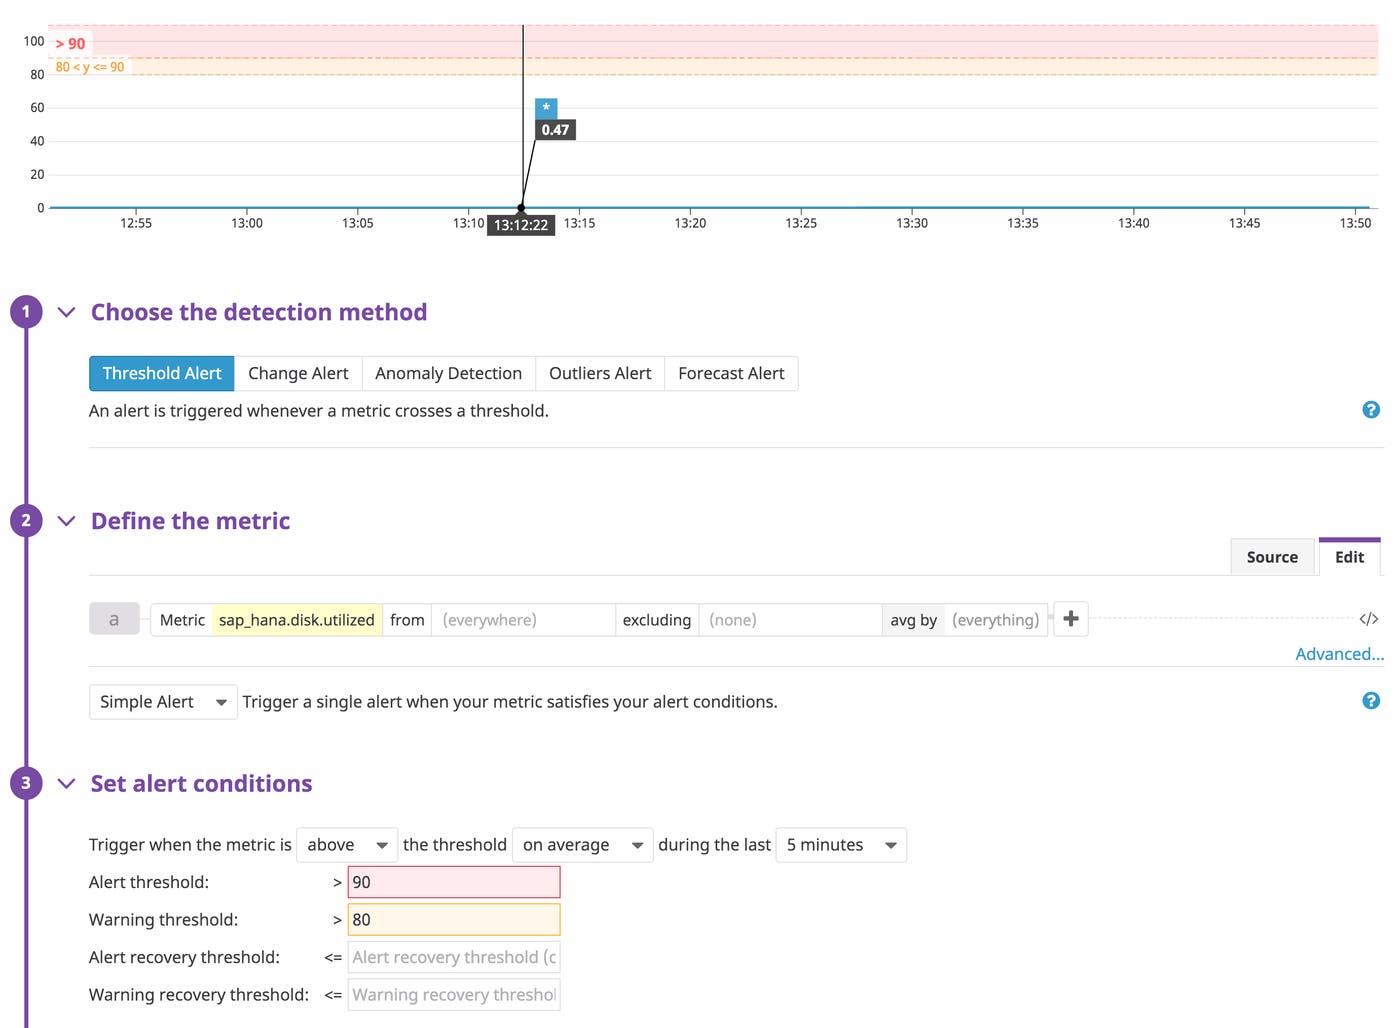
If you run out of disk space to store your data or logs, SAP HANA will experience a disk-full event and stop working, so it’s important to monitor the amount of disk space available. The screenshot below illustrates how you can create a threshold alert based on the sap_hana.disk.utilized metric to warn you if more than 80 percent of overall available disk space is in use. This should give you enough time to resolve the issue (by, for example, removing unnecessary log files) before SAP HANA stops working.
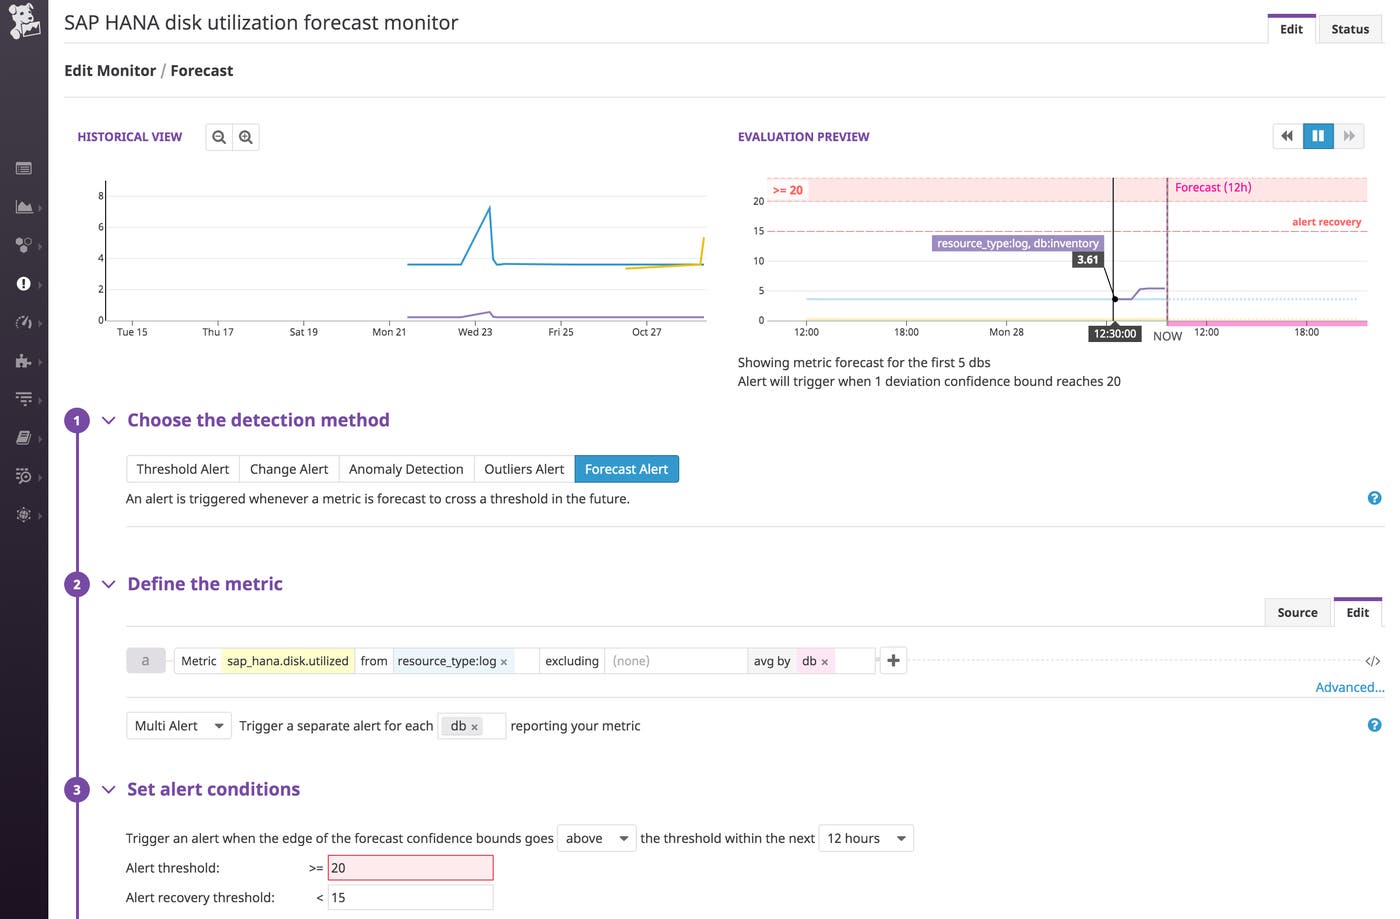
Monitoring disk usage by data or log volumes can help you track growth for a single database. This can, for example, help you decide when to move a growing database onto its own host. The screenshot below shows how to create a forecast alert that will automatically notify you if any database’s log volume is on track to use more than 20 percent of available disk space.
Start monitoring SAP HANA
Enable Datadog’s SAP HANA integration to monitor your database’s performance and ensure that your workloads are running smoothly. You can monitor SAP HANA alongside data sources like Oracle, Hadoop, and IBM DB2—and any of our other more than 1,000 integrations—all in a single platform. If you’re not already using Datadog, you can start today with a free 14-day trial.


