Kai Xin Tai
Hazelcast is a distributed, in-memory computing platform for processing large data sets with extremely low latency. Its in-memory data grid (IMDG) sits entirely in random access memory, which provides significantly faster access to data than disk-based databases. And with high availability and scalability, Hazelcast IMDG is ideal for use cases like fraud detection, payment processing, and IoT applications. Together with the open source community, Hazelcast has created clients for a number of popular languages, including Java, .NET, and Python.
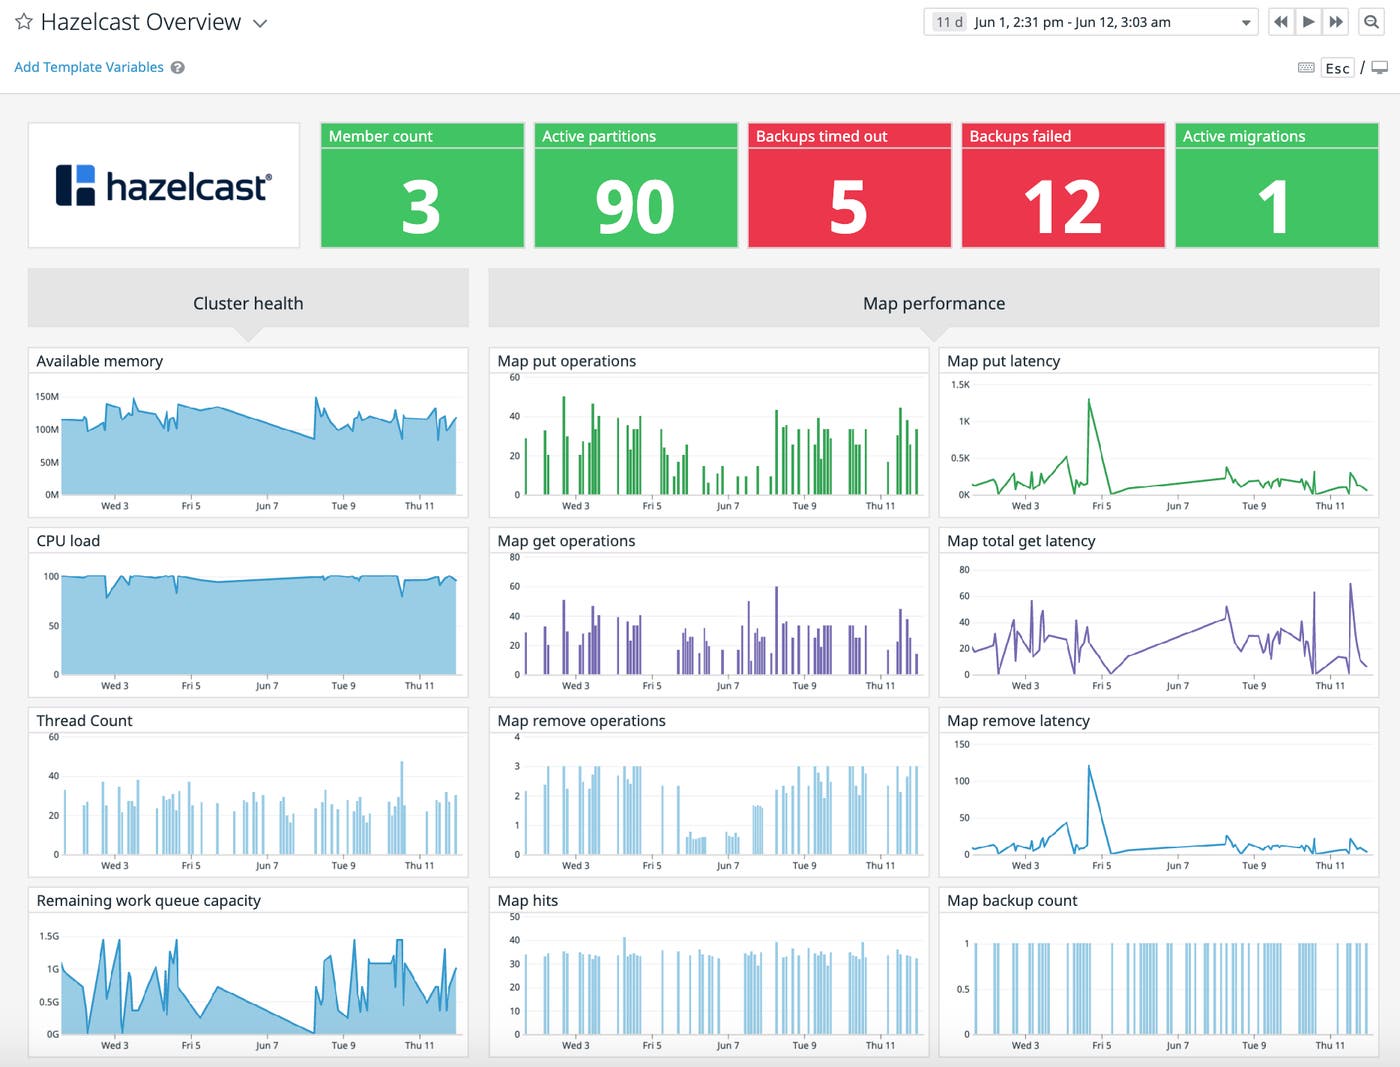
We’re excited to announce that our integration with Hazelcast IMDG can help you monitor the health of your data grid—and ensure that cluster members have sufficient resources to maintain high performance. Within minutes of setting up the integration, you can start visualizing key metrics like cluster size, memory usage, and map operations on our out-of-the-box dashboard. And if you forward logs to Datadog, you can correlate them with metrics to get even more context around an issue.

Get high-level insights on Hazelcast cluster health and availability
Hazelcast stores data in partitions and distributes them equally among the members in a cluster. It also replicates each partition, with one replica designated as the primary replica and the rest as backups. Without a single point of failure, Hazelcast is able to continue normal operations in the event of a member failure. But when your cluster is in a state other than ACTIVE, it might not be allowed to accept new members, replicate backups, or rebalance partitions.
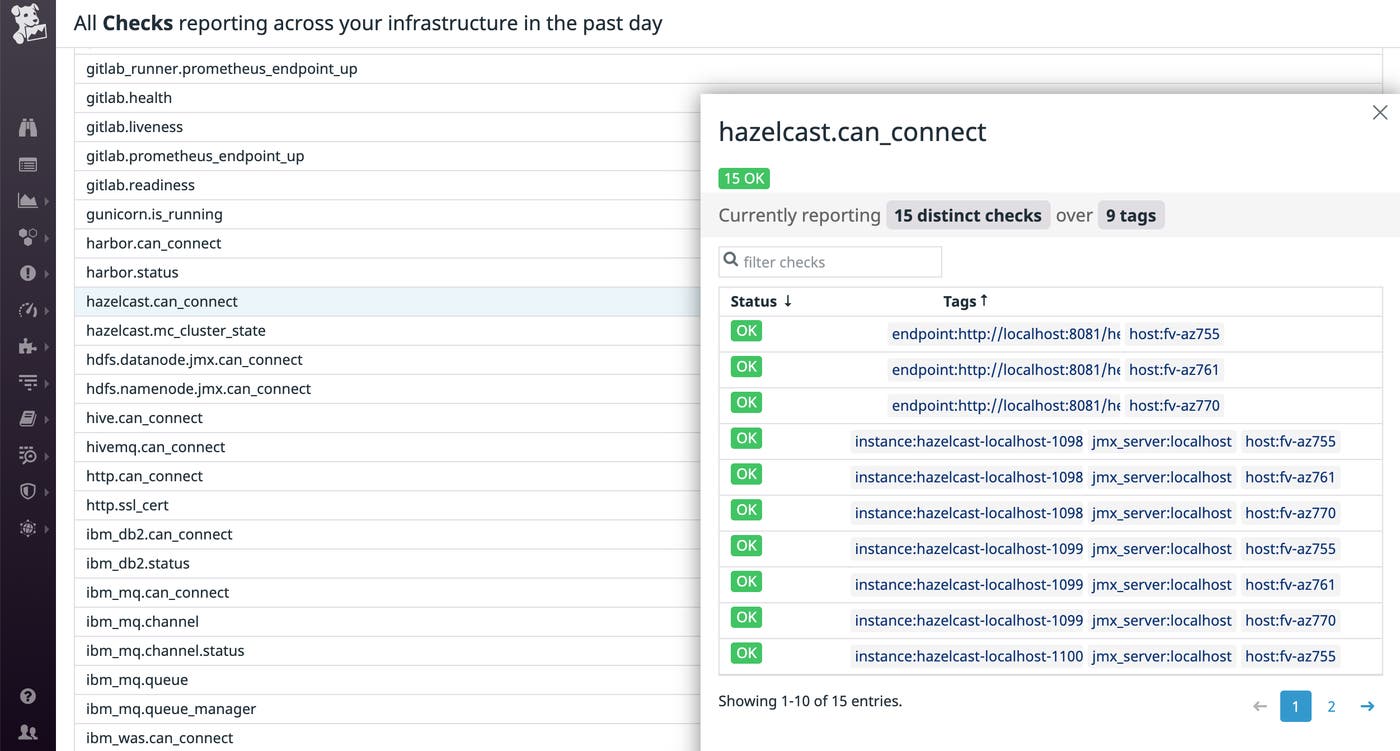
Our integration comes with built-in service checks that let you know at a glance whether the cluster is in its expected state (hazelcast.mc_cluster_state) and if the Datadog Agent is able to connect to it (hazelcast.can_connect). You can also monitor the health of your cluster with high-level statistics—such as cluster size, partition count, and backup count—to ensure that it is properly scaled and configured to suit your use case.

Catch unexpected changes in map query throughput
Map (Imap)—an implementation of the Java interface java.util.concurrent.ConcurrentMap—is one of the most commonly used data structures in Hazelcast IMDG. You can use operations like map.get() and map.put() to make remote calls to read and write data. Visualizing map query throughput on our out-of-the-box dashboard can help you understand your data grid’s activity levels—and ensure that your members have sufficient resources to maintain optimal performance.

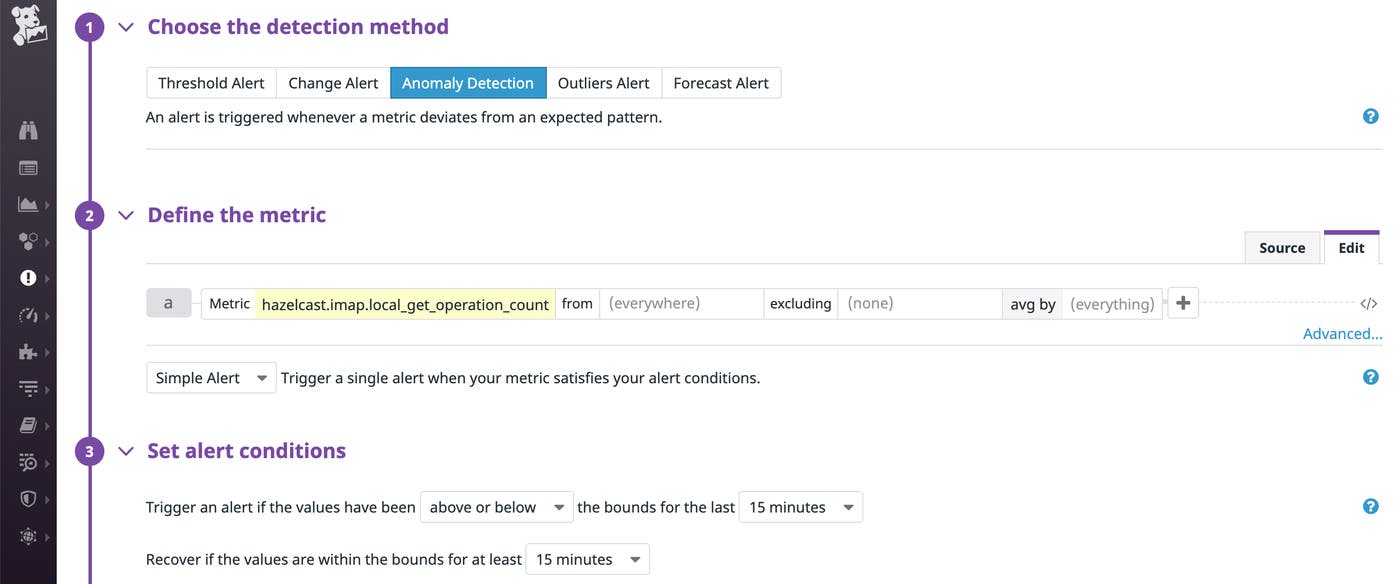
If, for instance, asynchronous calls start to accumulate, you might run into out-of-memory errors. In this case, you could consider enabling back pressure to limit the number of concurrent requests and to instruct Hazelcast to perform asynchronous backup syncs. You can also set up an alert to automatically notify you when throughput deviates from normal levels so that you’re able to make the necessary adjustments to your deployment.

Optimize the performance of your Hazelcast cluster
Given the time-sensitive nature of the services that rely on Hazelcast, tracking the latency of operations and troubleshooting any slowdowns as soon as possible is of utmost importance. In Hazelcast, tasks are added to work queues, which operation threads consume from. If you notice that the latency of map operations is increasing—and work queues are starting to grow—you can dive into your Hazelcast logs for more context around the issue.

For instance, your threads might be blocked by slow operations and causing your system to overload with events. Datadog automatically enriches your data grid logs with useful metadata, such as host and cluster name, so you can easily group your logs and analyze trends over time to see if this is a recurring issue.
By default, Hazelcast determines the number of operation threads based on your machine’s core count. But if you are processing a heavy workload—and you have sufficient cores—you might want to increase your thread count to enable a greater degree of parallelism and avoid thread blocking. Otherwise, you can consider increasing the number of nodes or cores for better performance in the long term.
Start monitoring Hazelcast IMDG
With Datadog, you can get comprehensive visibility into the health and performance of Hazelcast IMDG, alongside more than 1,000 other technologies in your environment. If you’re already using Datadog, check out our documentation to learn how to start monitoring Hazelcast right away. Otherwise, sign up for a 14-day free trial today.


