
Jean-Mathieu Saponaro
This post is part 1 of a 3-part series about monitoring MongoDB performance with the WiredTiger storage engine. Part 2 explains the different ways to collect MongoDB metrics, and Part 3 details how to monitor its performance with Datadog.
If you are using the MMAPv1 storage engine, visit the companion article “Monitoring MongoDB performance metrics (MMAP)”.
What is MongoDB?
There are different types of NoSQL databases:
- Key-value stores like Redis where each item is stored and retrieved with its name (key)
- Wide column stores such as Cassandra used to quickly aggregate large datasets, and for which columns can vary from one row to another
- Graph databases, like Neo4j or Titan, which use graph structures to store networks of data
- Document-oriented databases which store data as documents thus offering a more flexible structure than other databases: fields can store arrays, or two records can have different fields for example. MongoDB is a document-oriented database, as are CouchDB and Amazon DynamoDB.
MongoDB is cross-platform and represents its documents in a binary-encoded JSON format called BSON (Binary JSON). The lightweight binary format adds speed to the flexibility of the JSON format, along with more data types. Fields inside MongoDB documents can be indexed.
MongoDB ensures high availability thanks to its replication mechanisms, horizontal scalability allowed by sharding, and is currently the most widely adopted document store. It is used by companies such as Facebook, eBay, Foursquare, Squarespace, Expedia, and Electronic Arts.
Key MongoDB performance metrics to monitor
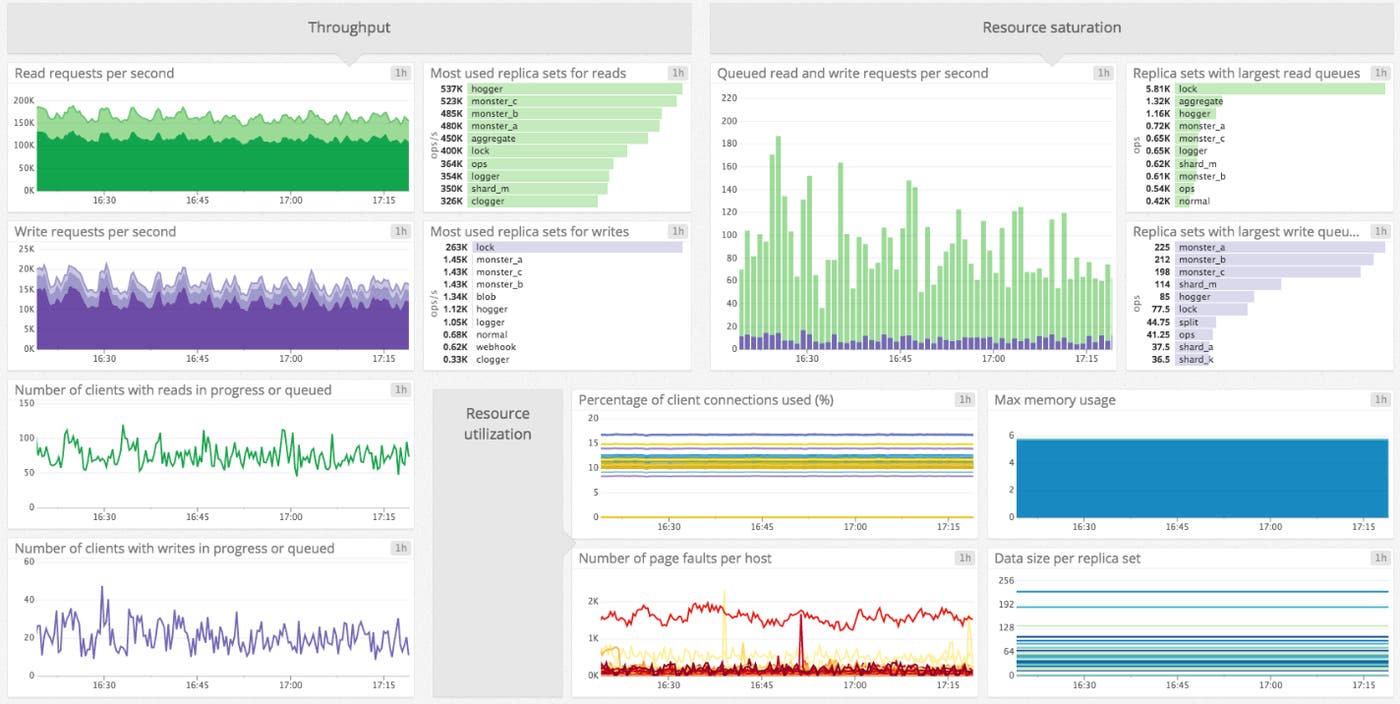
By properly monitoring MongoDB you can quickly spot slowdowns, hiccups, or pressing resource limitations, and know which actions to take to correct these issues before there are user-facing consequences. Here are the key areas you will want to track and analyze metrics.
In this article, we focus on the metrics available in MongoDB when using WiredTiger, which was introduced with MongoDB 3.0 and is now the default storage engine. All the metric names correspond to the one available in MongoDB 3.2.
However, many companies still run earlier versions of MongoDB which use the MMAPv1 storage engine. If that’s your case, here is the companion article you should read.
This article references metric types terminology introduced in our Monitoring 101 series, which provides a framework for metric collection and alerting.
All these metrics are accessible using a variety of tools, including MongoDB’s utilities, commands (indicated in this article for each metric presented), or dedicated monitoring tools. For details on metrics collection using any of these methods, see Part 2 of this series.
Throughput metrics

Throughput metrics are crucial and most of your alerts should be set on these metrics in order to avoid any performance issue, resource saturation, or errors. The majority of the metrics presented in the other sections are typically used to investigate problems.
Read and Write operations
To get a high-level view of your cluster’s activity levels, the most important metrics to monitor are the number of clients making read and write requests to MongoDB, and the number of operations they are generating. Understanding how, and how much, your cluster is being used will help you optimize MongoDB’s performance and avoid overloading your database. For instance, your strategy to scale up or out (see corresponding section at the end of this article) should take into account the type of workload your database is receiving.
| Metric Description | Name | Metric Type | Availability |
|---|---|---|---|
| Number of read requests received during the selected time period (query, getmore) | opcounters.query, opcounters.getmore | Work: Throughput | serverStatus |
| Number of write requests received during the selected time period (insert, delete, update) | opcounters.insert, opcounters.update, opcounters.delete | Work: Throughput | serverStatus |
| Number of clients with read operations in progress or queued | globalLock.activeClients.readers | Work: Throughput | serverStatus |
| Number of clients with write operations in progress or queued | globalLock.activeClients.writers | Work: Throughput | serverStatus |
NOTE: A getmore is the operation the cursor executes to get additional data from a query.
Metrics to alert on:
By properly monitoring the number of read and write requests you can prevent resource saturation, spot bottlenecks, quickly find the cause of potential overloads, and know when to scale up or out. The currentQueue metrics (presented in the section about Resource Saturation) will confirm if requests are accumulating faster than they are being processed. Look also at activeClients.readers or activeClients.writers to check if the number of active clients explains the requests load. These two activeClients metrics are reported under “globalLock” even if they are not really related to global lock.
In order to be able to quickly spot the potential causes of abnormal changes in traffic, you should break down your graphs by operation type: query and getmore for read requests, insert, update, and delete for write requests.
Database performance

Operational latencies and scanned objects
Operational latency and scanned object metrics help to provide a high-level picture of database performance by measuring operation execution and querying efficiency.
Operational latency metrics track the overall latencies for read and write operations throughout your entire MongoDB instance. Scanned object metrics measure the number of documents and index items scanned during queries and query-evaluation plan, providing insights that may help you make strategic decisions about indexing and more.
| Metric Description | Name | Metric Type | Availability |
|---|---|---|---|
| Total latency statistics for read requests per second | mongodb.oplatencies.reads.latencyps | Work: Performance | serverStatus |
| Total latency statistics for write operations per second | mongodb.oplatencies.writes.latencyps | Work: Performance | serverStatus |
| Number of documents scanned per second during queries and query-plan evaluation | mongodb.metrics.queryexecutor.scannedobjectsps | Work: Throughput | serverStatus |
| Number of index items scanned per second during queries and query-plan evaluation | mongodb.metrics.queryexecutor.scannedps | Work: Throughput | serverStatus |
Replication and Oplog
The metrics presented in this paragraph matter only if you use a replica set, which you should do if you run MongoDB in production in order to ensure high data availability.
The oplog (operations log) constitutes the basis of MongoDB’s replication mechanism. It’s a limited-size collection stored on primary and secondary nodes that keeps track of all the write operations. Write operations are applied on the primary node itself and then recorded on its oplog. Right after secondary nodes copy and apply these changes asynchronously. But if the primary node fails before the copy to the secondary is made, data might not be replicated.
Each replica contains its own oplog, corresponding to its view of the data at this point in time based on what it saw the most recently from the primary.
| Metric Description | Name | Metric Type | Availability |
|---|---|---|---|
| Size of the oplog (MB) | logSizeMB | Other | getReplicationInfo |
| Oplog window (seconds) | timeDiff | Other | getReplicationInfo |
| Replication Lag: delay between a write operation on the primary and its copy to a secondary (milliseconds) | members.optimeDate[primary] - members.optimeDate[secondary member] ** | Work: Performance | replSetGetStatus |
| Replication headroom: difference between the primary’s oplog window and the replication lag of the secondary (milliseconds) | getReplicationInfo.timeDiff x 1000 - (replSetGetStatus.members.optimeDate[primary] - replSetGetStatus.members.optimeDate[secondary member]) | Work: Performance | getReplicationInfo and replSetGetStatus |
| Replica set member state | members.state | Resource: Availability | replSetGetStatus |
** For the calculation of Replication Lag, optimeDate values are provided with the isoDate format (YYYY-MM-DD HH:MM.SS.ms) so the difference will be in milliseconds.
Metrics to alert on:
Replication lag represents how far a secondary is behind the primary. Obviously you want to keep a replication lag as small as possible. It’s especially true if yours is the rare case where your secondary nodes address reads (usually not advised, see sections about scaling MongoDB) since you want to avoid serving stale data. Ideally, replication lag is equal to zero, which should be the case if you don’t have load issues. If it gets too high for all secondary nodes, the integrity of your data set might be compromised in case of failover (secondary member taking over as the new primary because the current primary is unavailable). Indeed write operations happening during the delay are not immediately propagated to secondaries and related changes might be lost if the primary fails.
You might want to set up a warning notification for any lag higher than 60 seconds. A high priority alert can be set for lags exceeding 240 seconds. With a healthy replica set, you shouldn’t get false positive with this threshold.
A high replication lag can be due to:
- Networking issue between the primary and secondary making nodes unreachable: check
members.stateto spot unreachable nodes - A secondary node applying data slower than the primary
- Insufficient write capacity in which case you should add more shards: check queued write requests (see section about resource saturation)
- Slow operations on the primary node blocking replication. You can spot slow queries with the db.getProfilingStatus() command or through the Visual Query Profiler in MongoDB Ops Manager if you are using it: level 1 corresponds to slow operations (taking longer than the threshold defined by the
operationProfiling.slowOpThresholdMsparameter set to 100 ms by default). It can be due to heavy write operations on the primary node or an under-provisioned secondary. You can prevent the latter by scaling up the secondary to match the primary capacity. You can use “majority” write concern to make sure writes are not getting ahead of replication.
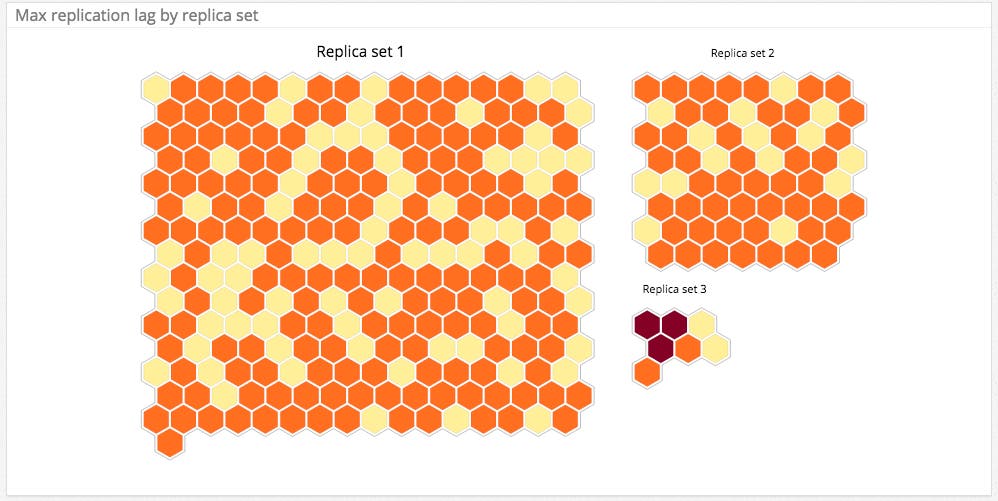
The oplog window represents the interval of time between the oldest and the latest entries in the oplog, which usually corresponds to the approximate amount of time available in the primary’s replication oplog. So if a secondary is down longer than this oplog window, it won’t be able to catch up unless it completely resyncs all data from the primary. The amount of time it takes to fill the oplog varies: during heavy traffic times, it will shrink since the oplog will receive more operations per second. If the oplog window for a primary node is getting too short you should consider increasing the size of your oplog. MongoDB advises to send a warning notification if the oplog windows is 25% below its usual value during traffic peaks, and a high priority alert under 50%.
If the replication headroom is rapidly shrinking and is about to become negative, that means that the replication lag is getting higher than the oplog window. In that case, write operations recorded in the oplog will be overwritten before secondary nodes have time to replicate them. MongoDB will constantly have to resync the entire data set on this secondary which takes much longer than just fetching new changes from the oplog. Properly monitoring and alerting on Replication Lag and oplog window should allow you to prevent this.
The replica set member state is an integer indicating the current status of a node in a replica set. You should alert on error state changes so you can quickly react if a host is having issues. Here are potentially problematic states:
- Recovering (state = 3): the members is performing startup self-checks, or just completed a rollback or a resync. A Recovering state can be fine if it’s intentional (for example when resyncing a secondary) but if it’s unexpected, you should find the root cause of this issue in order to maintain a healthy replica set.
- Unknown (state = 6): the member doesn’t communicate any status information to the replica set.
- Down (state = 8): the member lost its connection with the replica set. This is critical if there is no replica to address requests to the node that went down.
- Rollback (state = 9): when a secondary member takes over as the new primary before writes were totally replicated to it, the old primary reverts these changes. If you don’t use “majority” write concern, you should trigger a paging alert in case a node shows a Rollback state since you might lose data changes from write operations. Rollbacks of acknowledged data should be avoided.
- Removed (state = 10): the member has been removed from the replica set.
You can find all the member states here.
Journaling
While oplog stores recent write operations for replication, journaling is a write-ahead process. It is enabled by default since v2.0 and you shouldn’t turn it off, especially when using MongoDB in production.
The purpose and underlying mechanisms of journaling with the MMAPv1 storage engine are different than with WiredTiger, and available metrics won’t be the same.
With WiredTiger, data integrity is not impacted if the process stops unexpectedly like it can be with MMAPv1. So the journaling purpose is mainly to ensure maximum data recovery after an unclean shutdown.
To understand journaling with the WiredTiger engine, we need to first discuss checkpoints which are database snapshots that are persisted to disk. Checkpoints can act as recovery points even if journaling is disabled. MongoDB creates a checkpoint only every 60 seconds, which means that, without journaling turned on, a failure may cause data loss of up to 60 seconds of history. With journaling enabled, MongoDB can replay the journal and recover the transactions that occurred during the missing seconds. Among other purposes, Journaling essentially narrows the interval of time between the moment when data is applied to memory and when data is made durable on the node. That’s why you shouldn’t turn off journaling, especially in production.
For both storage engines, the frequency of committing/syncing the journal to disk is defined by the parameter storage.journal.commitIntervalMs (100 ms by default with WiredTiger) which can be tuned. Decreasing its value reduces the chances of data loss since writes will be recorded more frequently but may increase the latency of write operations.
| Metric Description | Name | Metric Type | Availability |
|---|---|---|---|
| Count of transactions that have been written to the journal in the last journal group commit interval. | dur.commits | Resource: Utilization | serverStatus |
| Volume of data written to the journal as part of the last journal group commit interval (MB) | dur.journaledMB | Resource: Utilization | serverStatus |
Tracking the number of transactions and the amount of data written to the journal provides insights on load. This can be useful when troubleshooting.
Concurrent operations management: Locking performance
In order to support simultaneous queries while avoiding write conflicts and inconsistent reads, MongoDB has an internal locking system. Suboptimal indexes, and poor schema design patterns can lead to locks being held longer than necessary.
Compared to MMAPv1, you are significantly less likely to experience locking issue with WiredTiger. Indeed this storage engine uses document-level concurrency which drastically improved concurrent operations compared to the MMAPv1 engine. Now simultaneous writes to a same collection will only block each other if they are made to the same document, which explains why locking shouldn’t be an issue anymore.
The WiredTiger engine uses a ticketing system that aims to control the number of threads in use since they can starve each other of CPU. Tickets are an internal representation for thread management. They correspond to the number of concurrent read / write operations allowed into the WiredTiger storage engine.
| Metric Description | Name | Metric Type | Availability |
|---|---|---|---|
| Number of read tickets in use | wiredTiger.concurrentTransactions.read.out | Resource: Utilization | serverStatus |
| Number of write tickets in use | wiredTiger.concurrentTransactions.write.out | Resource: Utilization | serverStatus |
| Number of available read tickets remaining | wiredTiger.concurrentTransactions.read.available | Resource: Utilization | serverStatus |
| Number of available write tickets remaining | wiredTiger.concurrentTransactions.write.available | Resource: Utilization | serverStatus |
Metrics to alert on:
When the number of available read or write tickets remaining reaches zero, new read or write requests will be queued until a new read or write ticket is available. The maximums of concurrent read and write operations are respectively defined by the parameters wiredTigerConcurrentReadTransactions and wiredTigerConcurrentWriteTransactions. Both are equal to 128 by default. However be careful when increasing it: if the number of simultaneous operations gets too high, you might run out of system resources (CPU in particular). Scaling horizontally by adding more shards can help to support high throughputs (see section about scaling MongoDB).
Cursors
When a read query is received, MongoDB returns a cursor which represents a pointer to the data set of the answer. To access all the documents resulted by the query, clients can then iterate over the cursor.
| Metric Description | Name | Metric Type | Availability |
|---|---|---|---|
| Number of cursors currently opened by MongoDB for clients | metrics.cursor.open.total | Work: Throughput | serverStatus |
| Number of cursors that have timed out during the selected time period | metrics.cursor.timedOut | Work: Throughput | serverStatus |
| The number of open cursors with timeout disabled | metrics.cursor.open.noTimeout | Other | serverStatus |
Metrics to alert on:
A gradual increase in the number of open cursors without a corresponding growth of traffic is often symptomatic of poorly indexed queries. It can also be the result of long running queries due to large result sets. You should take a look to see how you could optimize them.
cursor.timedOut is incremented when a client connection has died without having gracefully closed the cursor. This cursor remains open on the server, consuming memory. By default MongoDB reaps these cursors after 10 minutes of inactivity. You should check if you have a large amount of memory being consumed from non-active cursors. A high number of timed out cursors can be related to application issues.
This also explains why cursors with no timeout should be avoided: they can prevent resources to be freed as it should and slow down internal system processes. Indeed the DBQuery.Option.noTimeout flag (until v3.0) or the cursor.noCursorTimeout() method can be used to prevent the server to timeout cursors after a period of inactivity (idle cursors). You can make sure that there are no cursors with no timeout by checking if the cursor.open.noTimeout metric which count their number is always equal to zero.
Resource Utilization

Connections
Abnormal traffic loads can lead to performance issues. That’s why the number of client connections should be closely monitored.
| Metric Description | Name | Metric Type | Availability |
|---|---|---|---|
| Number of clients currently connected to the database server | connections.current | Resource: Utilization | serverStatus |
| Number of unused connections available for new clients | connections.available | Resource: Utilization | serverStatus |
Metric to alert on:
Unexpected changes in the current number of client connections can be due to errors on your application or driver. All the officially supported MongoDB drivers use pools of connections in order to efficiently re-use them. If the number of client connections is getting very high, it should be related to a rise in the number of real client requests in which case you can scale to support this increasing load. If this growth is not expected, it often indicates a driver or configuration issue. Knowing how many connections you should expect under low, normal, and peak traffics allows you to appropriately set your alerts. You might want to send a warning notification if there the number of connections is 50% higher than the number you usually see at peak, and a high priority alert if it exceeds twice this usual number at peak.
If MongoDB runs low on connections, in may not be able to handle incoming requests in a timely manner. That’s why you should also alert on the percentage of connections used: 100 x current / (current + available).
This number of incoming connections is constrained but the limit can be changed except on older versions prior to 2.6. Since MongoDB 2.6, on Unix-based systems, the limit is simply defined by the maxIncomingConnections parameter, set by default to 1 million connections on v2.6 and 65,536 connections since v3.0. This value is configurable. connections.current should never get too close to this limit.
NOTE: the connections.current metrics also counts connections from shell and from other hosts like replicas or mongos instances.
Storage metrics
Understanding MongoDB’s storage structure and statistics
In MongoDB, data is stored in documents using the BSON format.
Documents (usually with similar or related purpose) are grouped into collections. A collection can be seen as the equivalent of a table in a relational database. For example, the database “users” can contain the two collections “purchase” and “profile”. In that case, you could access those collections with the namespaces users.purchase and users.profile.
With WiredTiger, there is one data file per collection (data) and one data file per index.
Storage size metrics (from dbStats) for WiredTiger:
With the WiredTiger engine, for every update, MongoDB rewrites the whole document. Thus there is no concept of “padding” like with MMAPv1.
Here are the different storage metrics you should know:
dataSizemeasures the space taken by all the documents (data) in the database.indexSizereturns the size of all indexes created on the database.storageSizemeasures the size of all the data extents in the database. WiredTiger has compression enabled by default, so storageSize can be lower than dataSize for large collections, but it can also sometimes be higher than dataSize for very small collections.
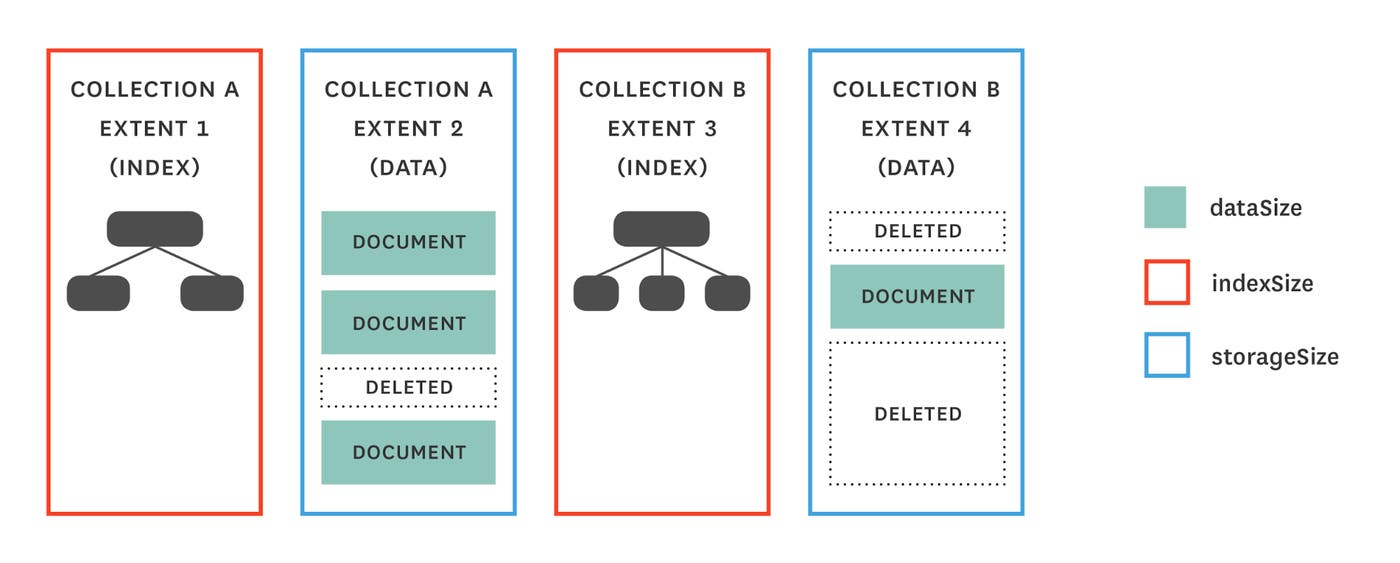
Metrics to monitor
| Metric Description | Name | Metric Type | Availability |
|---|---|---|---|
| Number of objects (documents) among all the collections | objects | Resource: Utilization | dbStats |
| Size of all documents (bytes) | dataSize | Resource: Utilization | dbStats |
| Size of all indexes (bytes) | indexSize | Resource: Utilization | dbStats |
| Size of all extents (bytes) | storageSize | Resource: Utilization | dbStats |
Metrics to alert on:
If memory space metrics (dataSize, indexSize, or storageSize) or the number of objects show a significant unexpected change while the database traffic remained within ordinary ranges, it can indicate a problem. A sudden drop of dataSize can be due to a large amount of data deletion, which should be quickly investigated if it was not expected.
Memory metrics
| Metric Description | Name | Metric Type | Availability |
|---|---|---|---|
| Virtual memory usage (MB) | mem.virtual | Resource: Utilization | serverStatus |
| Amount of memory used by the database process (MB) | mem.resident | Resource: Utilization | serverStatus |
| Number of times MongoDB had to request from disk (per second) | extra_info.page_faults | Other | serverStatus |
The resident memory usage usually approaches the amount of physical RAM available to the MongoDB server.
Metric to notify on:
Page faults indicate operations which required the MongoDB to fetch data from disk because it wasn’t available in active memory (“hard” page fault), or when the operation required in-memory page relocation (“soft” page fault). Requests which trigger page faults take more time to execute than requests that do not. Frequent page faults may indicate that your data set is too large for the allocated memory. However that’s not a big issue if the throughput remains healthy. Limited and occasional page faults do not necessarily indicate serious problems. In order to reduce the frequency of page faults, you can increase the size of your RAM or consider adding more shards to your deployments in order to better distribute incoming requests. Page faults can also be a sign of inefficient schema design, redundant or unnecessary indexes, or anything using available RAM unnecessarily.
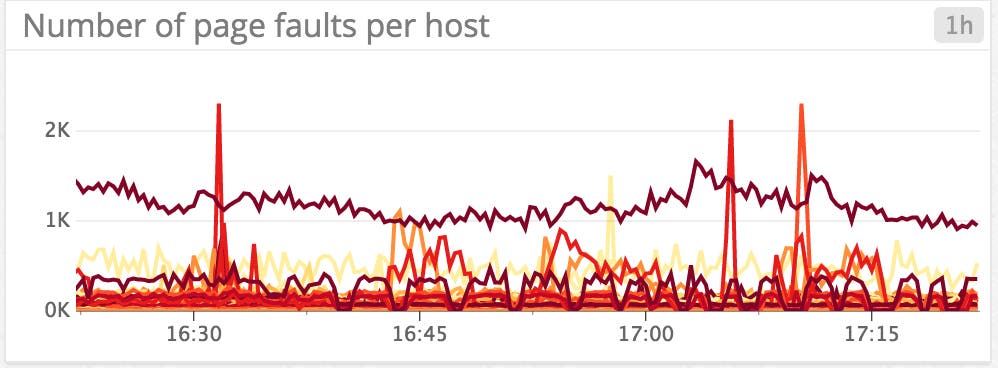
Cache metrics
With WiredTiger, MongoDB uses both the storage engine’s cache and the file system cache. You want your working set to fit in memory, which includes uncompressed data in the WiredTiger cache and compressed data in the file system cache (more info here). If your working set outgrows the available cache, page faults (see previous section) might cause performance issues.
| Metric Description | Name | Metric Type | Availability |
|---|---|---|---|
| Amount of space taken by cached data (bytes) | wiredTiger.cache.bytes currently in the cache | Resource: Utilization | serverStatus |
| Maximum cache size configured (bytes) | wiredTiger.cache.maximum bytes configured | Other | serverStatus |
| Amount of space taken by dirty data in the cache (bytes) | wiredTiger.cache.tracked dirty bytes in the cache | Resource: Utilization | serverStatus |
| Number of pages evicted from the cache | wiredTiger.cache.unmodified pages evicted + wiredTiger.cache.modified pages evicted | Resource: Saturation | serverStatus |
NOTE: WiredTiger’s cache metrics names are string values with spaces inside.
Dirty data designates data in the cache that has been modified but not yet applied (flushed) to disk. Growing amounts of dirty data could represent a bottleneck where data isn’t being written to disk fast enough. Scaling out by adding more shard will help you reduce the amount of dirty data. Note that the amount of dirty data is expected to grow until the next checkpoint.
The size limit of the WiredTiger cache defined by the engineConfig.cacheSizeGB parameter shouldn’t be increased above its default value. Indeed the remaining memory is used by the mongod process for its data processing and by the OS for filesystem cache which MongoDB benefits from.
In versions 3.2+, the cacheSizeGB parameter it is set by default to the greater of:
- 1 GB
- 60% of the RAM minus 1 GB
Other host-level metrics
You’ll also want to monitor system metrics of machines running MongoDB in order to investigate performance issues.
Disk space is one of the most important host-level metrics to alert on. You should trigger a high priority alert if it is getting close to full (for example a warning if 80% full, and an alert at 90% full).
If CPU utilization is increasing too much, it can lead to bottlenecks and may indirectly indicate inefficient queries, perhaps due to poor indexing.
When I/O utilization is getting close to 100% for lengthy periods of time, it means you are hitting the limit of the physical disk’s capacity. If it’s constantly high, you should upgrade your disk or add more shards in order to avoid performance issues such as slow queries or slow replication.
I/O wait limits throughput so a high value indicates high throughput. In that case you should consider scaling up by adding more shards (see section about scaling MongoDB), or increasing your disk I/O capacity (after verifying optimal schema and index design). RAM saturation might also be a cause of low I/O per second, especially if your system is not write-heavy. It can be due to the size of your working set being larger than the available memory for example.
Resource Saturation

| Metric Description | Name | Metric Type | Availability |
|---|---|---|---|
| Number of read requests currently queued | globalLock.currentQueue.readers | Resource: Saturation | serverStatus |
| Number of write requests currently queued | globalLock.currentQueue.writers | Resource: Saturation | serverStatus |
Metrics to notify on:
Queued read and writes requests are reported under “globalLock” even if they are not really related to global lock. If you see that the number of queued requests keeps growing during heavy read/write traffic, that means MongoDB is not addressing requests as fast as they are arriving. In order to avoid performance issues and make sure your database is able to keep up with the demand, you should increase your deployment capacity (see section about scaling MongoDB).
NOTE: Scaling up vertically by adding more capacity (CPU, memory, faster disks, more disks on each instance) is also an option, but this strategy can become cost-prohibitive, and the size of your instances might be limited by your IT department’s inventory, or by your cloud-infrastructure provider.
Errors: asserts

Asserts typically represent errors. MongoDB generates a document reporting on the number of each type of assertions that have been raised: message, warning, regular, and user. Assertions don’t occur often but should be investigated when they do.
| Metric Description | Name | Metric Type | Availability |
|---|---|---|---|
| Number of message assertions raised during the selected time period | asserts.msg | Resource: Error | serverStatus |
| Number of warning assertions raised during the selected time period | asserts.warning | Resource: Error | serverStatus |
| Number of regular assertions raised during the selected time period | asserts.regular | Resource: Error | serverStatus |
| Number of assertions corresponding to errors generated by users during the selected time period | asserts.user | Resource: Error | serverStatus |
NOTE: These counters will rollover to zero if the MongoDB’s process is restarted or after 2^30 assertions.
The MongoDB log files will give you more details about assert exception returned, which will help you find possible causes.
Metrics to notify on:
Message asserts indicate internal server exceptions.
Warning asserts are not as serious as errors. They just indicate things that might be worth checking like too low ulimit or readahead.
Regular asserts are per-operation invariants (e.g., “unexpected failure while reading a BSON document”).
User asserts are triggered as the result of user operations or commands generating an error like a full disk space, a duplicate key exception, or write errors (e.g., insert not properly formatted, or no access right). These errors are returned to the client so most of them won’t be logged into the mongod logs. However you should investigate potential problems with your application or deployment.
Both regular and user asserts will result in the corresponding operation failing.
Scaling MongoDB: sharding vs replication
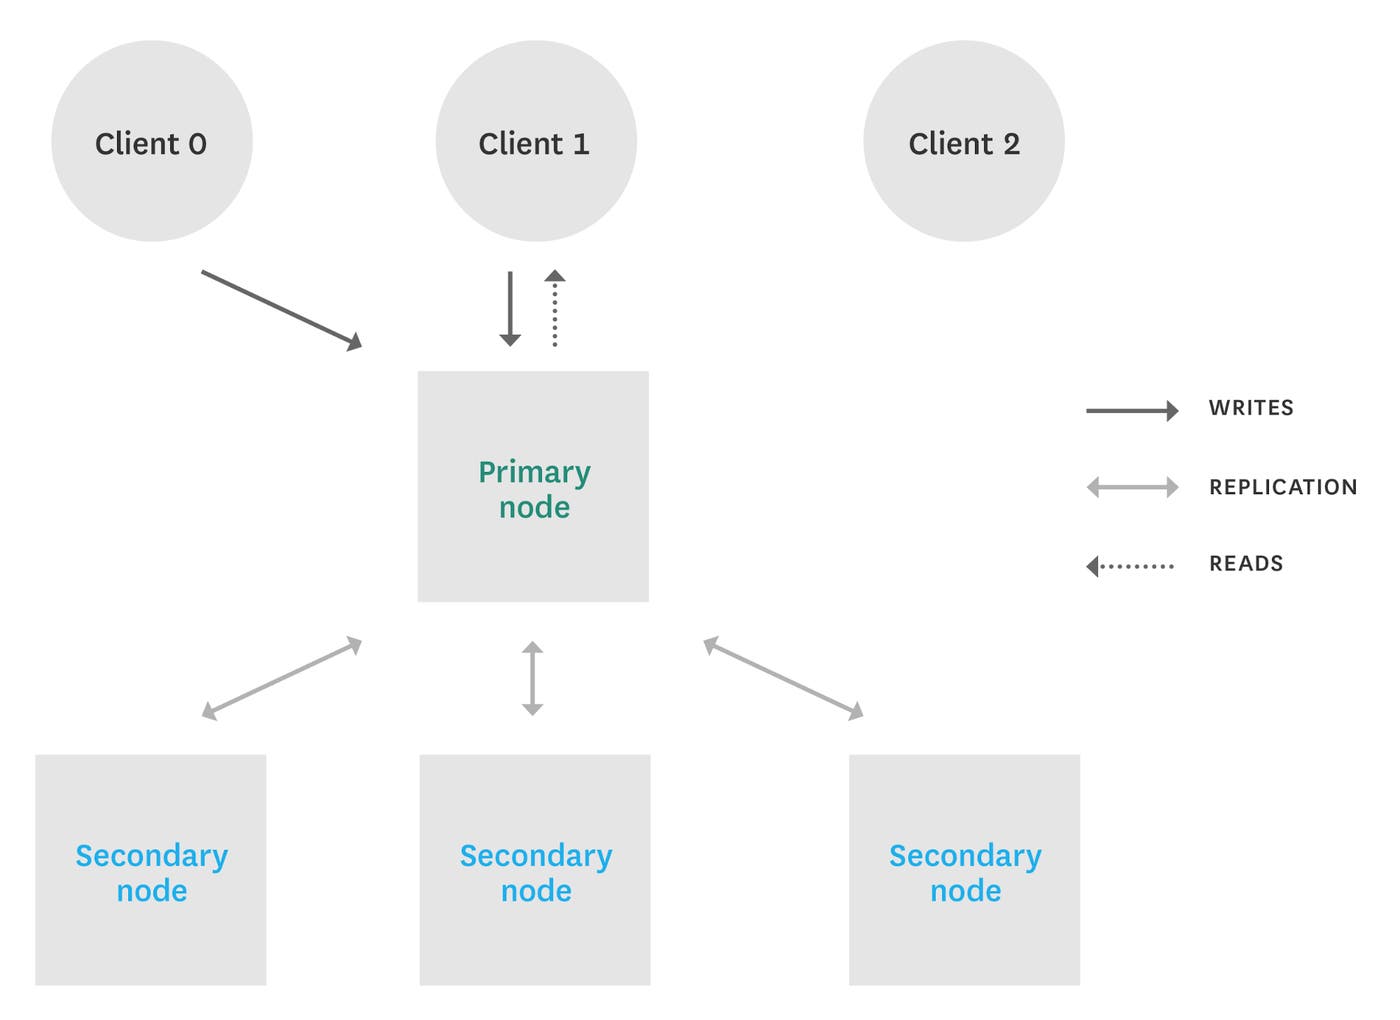
A replica set represents multiple servers running MongoDB, each one containing the exact same data. There is one primary node and the rest are secondary nodes. Replica sets provide fault-tolerance and high data availability. If the primary node becomes unavailable, one of the secondary nodes will be elected to take over as the new primary.
In order to increase your throughput capacity, you can scale horizontally by adding more shards to your cluster. Sharding splits data and distributes it among the shards (mongod instances) of a cluster according to a shard key defined for your collections. Incoming requests will be addressed by the corresponding shard(s) containing the requested data. Thus it allows to support more read and write throughputs. You can also upgrade the hardware on the cluster.
NOTE: For rare very specific cases where reads on secondaries can be acceptable (reads querying all the data for example), you can also consider adding more secondaries to your replica set and using them to support more read requests. But this is definitely not a general scaling tactic. Replica set members’ main purpose is to ensure high data availability, not to support read-heavy throughputs. The MongoDB’s documentation gives more details on why using more secondaries to provide extra read capacity shouldn’t be a scaling tactic most of the time.
Since write operations can only be directed to the primary node (they are then applied to secondaries), additional secondaries will not increase write-throughput capacity. If you need to support higher write throughput, you should use more shards instead.
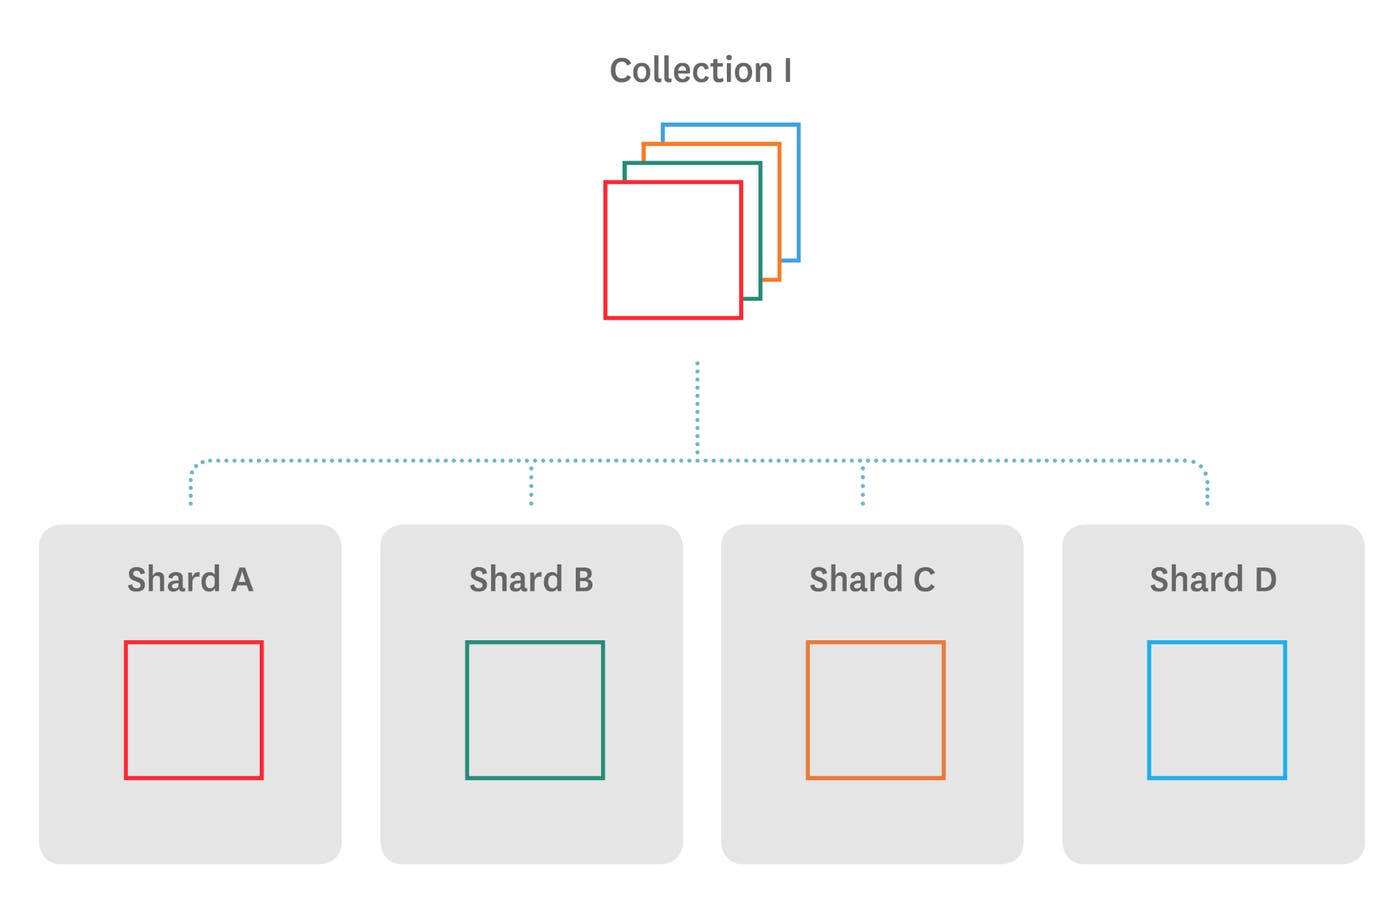
Adding more shards to a cluster increases read and write throughput capacities. In order to ensure high availability of all of your data even when a shard is down, each shard should be a replica set (especially in production).
Recap
In this post we’ve explored the metrics you should monitor to keep tabs on your MongoDB cluster. If you are just getting started with MongoDB, monitoring the metrics in the list below will provide visibility into your database’s health, performance, resource usage, and may help identify areas where tuning could provide significant benefits:

Closely tracking throughput metrics should give you a great overview of your database activity. Database performance, errors, resource utilization and resource saturation metrics will help you investigate issues and understand what to do to maintain good performance.
Eventually you will recognize additional, more specialized metrics that are particularly relevant to your own usage of MongoDB.
Part 2 will give you a comprehensive guide to collecting any of the metrics described in this article, or any other metric exposed by MongoDB.
Acknowledgments
Many thanks to the engineering team at MongoDB for reviewing this publication and suggesting improvements.
Source Markdown for this post is available on GitHub. Questions, corrections, additions, etc.? Please let us know.


