Jean-Mathieu Saponaro
This post is part 2 of a 3-part series about monitoring MongoDB performance. Part 1 presents the key performance metrics available from MongoDB: there is one post for the WiredTiger storage engine and one for MMAPv1. In Part 3 you will discover how to monitor MongoDB performance with Datadog.
If you’ve already read our guide to key MongoDB metrics in Part 1 of this series, you’ve seen that MongoDB provides a vast array of metrics on performance and resource utilization. This post covers the different options for collecting MongoDB metrics in order to monitor them. There are three ways to collect MongodDB metrics from your hosts:
- Using utilities offered by MongoDB to collect real-time activity statistics
- Using database commands to check the database’s current state
- Using a dedicated monitoring tool for more advanced monitoring features and graphing capabilities, which are essential for databases running in production
Utilities
Utilities provide real-time statistics on the current activity of your MongoDB cluster. They can be useful for ad hoc checks, but to get actionable insights and more advanced monitoring features, you should check the last section about dedicated monitoring tools.
The two main utilities line are mongostat and mongotop.
mongostat
mongostat is the most powerful utility. It reports real-time statistics about connections, inserts, queries, updates, deletes, queued reads and writes, flushes, memory usage, page faults, and much more. It can be useful to quickly spot-check database activity, see if values are not abnormally high, and make sure you have enough capacity.
However mongostat does not provide insights on metrics about Replication and oplog, cursors, storage, resource saturation, asserts, or host-level metrics. mongostat returns cache statistics only if you use the WiredTiger storage engine.

You can find in the MongoDB documentation the meaning of the different fields returned by mongostat along with the available options.
mongostat relies on the db.serverStatus() command (see below).
NOTE: Prior version 3.2, MongoDB offered an HTTP console displaying monitoring statistics on a web page, but this has been deprecated since v3.2.
mongotop
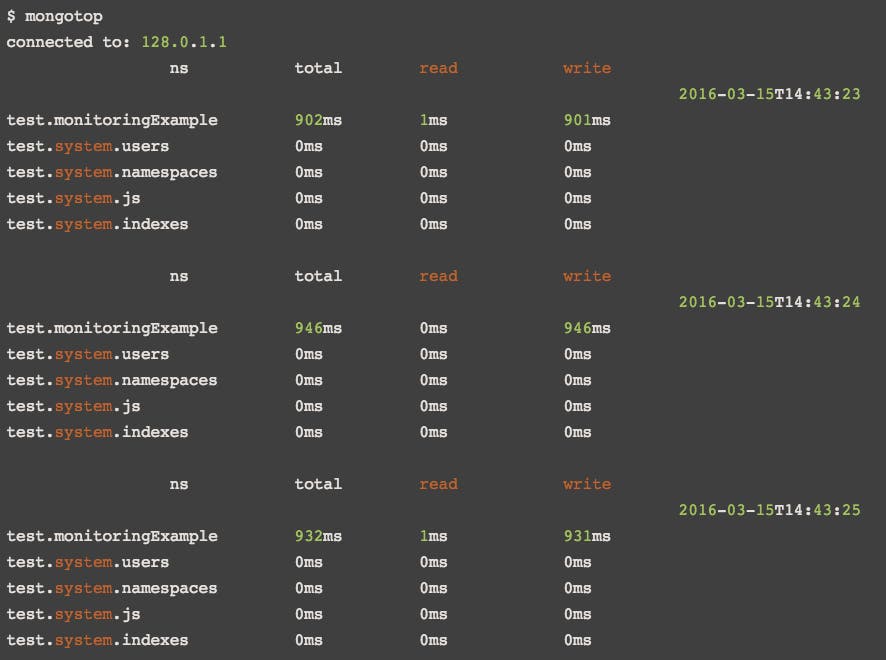
mongotop returns the amount of time a MongoDB instance spends performing read and write operations. It is broken down by collection (namespace). This allows you to make sure there is no unexpected activity and see where resources are consumed. All active namespaces are reported.

By default, values are printed every second but you can specify the frequency. For example if you want it to return every 20 seconds, you can run mongotop 20. Many other options are available as well.
Utilities are great for quick checks and ad hoc investigations, but for more detailed insights into the health and performance of your database, explore MongoDB commands discussed in the next section.
Commands
MongoDB provides several commands that can be used to collect the different metrics from your database presented in Part 1. Here are the most useful ones.
serverStatus
serverStatus (db.serverStatus() if run from the mongo shell) is the most complete native metrics-gathering command for MongoDB. It provides a document with statistics from most of the key metrics categories we talked about in Part 1: connections, operations, journaling, background flushing, locking, cursors, memory, asserts, etc. You can find the full list of metrics it can return here.
This command is used by most third party monitoring tools to collect MongoDB metrics along with the dbStats and replSetGetStatus commands that are still necessary to collect storage metrics and statistics about your replica sets (see next paragraphs).
dbStats
dbStats (db.stats() in the mongo shell) provides metrics about storage usage of the database: number of objects, or memory taken by documents and padding in the database (see memory metrics in Part 1 of this series). Here is the full list of metrics it returns.
collStats
collStats (db.collection.stats() in the shell) returns metrics similar to the dbStats output but for a specified collection: size of a collection, number of objects inside it, average size of objects, number of indexes in the collection, etc. See the full list here.
For example the following command runs collStats on the “movie” collection, with a scale of 1024 bytes:
db.runCommand( { collStats : "restaurant", scale: 1024 } )getReplicationInfo
getReplicationInfo (db.printReplicationInfo() in the shell) returns metrics about oplogs of the different members of a replica set like the oplog size or the oplog window. See the list of output fields here.
replSetGetStatus
replSetGetStatus (rs.status() from the shell) reports metrics about members of your replica set: state, metrics required to calculate replication lag. See Part 1 for more info about these metrics. This command is used to check the health of a replica set’s members and make sure replication is correctly configured. You can find the full list of metrics of the output here.
sh.status
Sh.status (sh.status() from the shell) provides metrics about sharding configuration and existing chunks (contiguous range of shard key values in a specific shard) for a sharded cluster. The full list of metrics of the output is available here.
getProfilingStatus
getProfilingStatus (db.getProfilingStatus() in the shell) returns the current profile level and the defined threshold above which the profiler considers a query slow (slowOpThresholdMs).
Production monitoring
The first two sections of this post cover built-in ways to manually access MongoDB metrics using simple lightweight tools. For databases running in production, you will likely want a more comprehensive monitoring system that ingests MongoDB metrics as well as metrics from other technologies in your stack.
MongoDB’s own tools
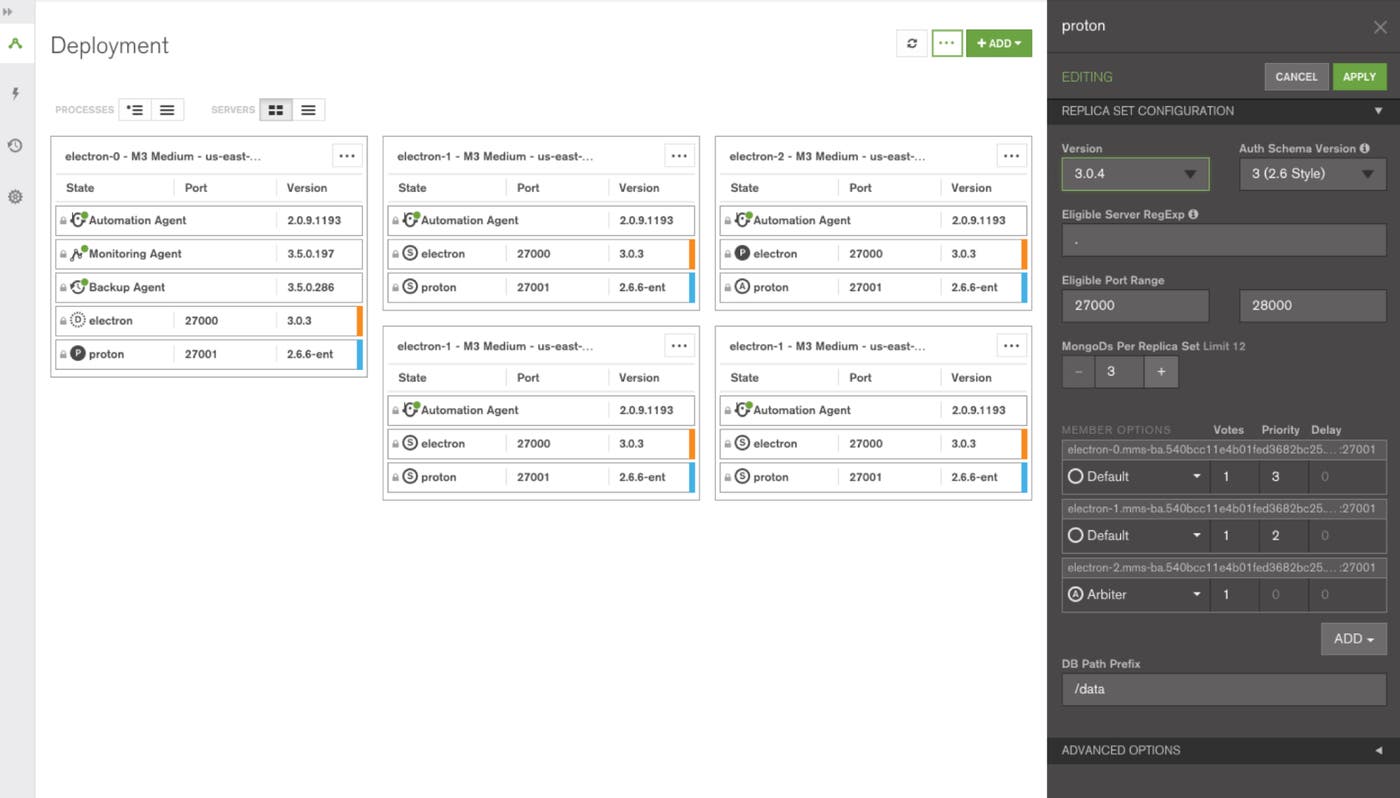
With MongoDB Enterprise Advanced, you will be able to collect performance metrics, automate, and backup your deployment through MongoDB’s management tools:
- Ops Manager is the easiest way to manage MongoDB from your own data center
- Cloud Manager allows you to manage your MongoDB deployment through MongoDB’s cloud service

If you have it, MongoDB Ops Manager will likely be your go-to place to take actions to monitor, prevent or resolve MongoDB performance issues.
Visibility into all your infrastructure with Datadog
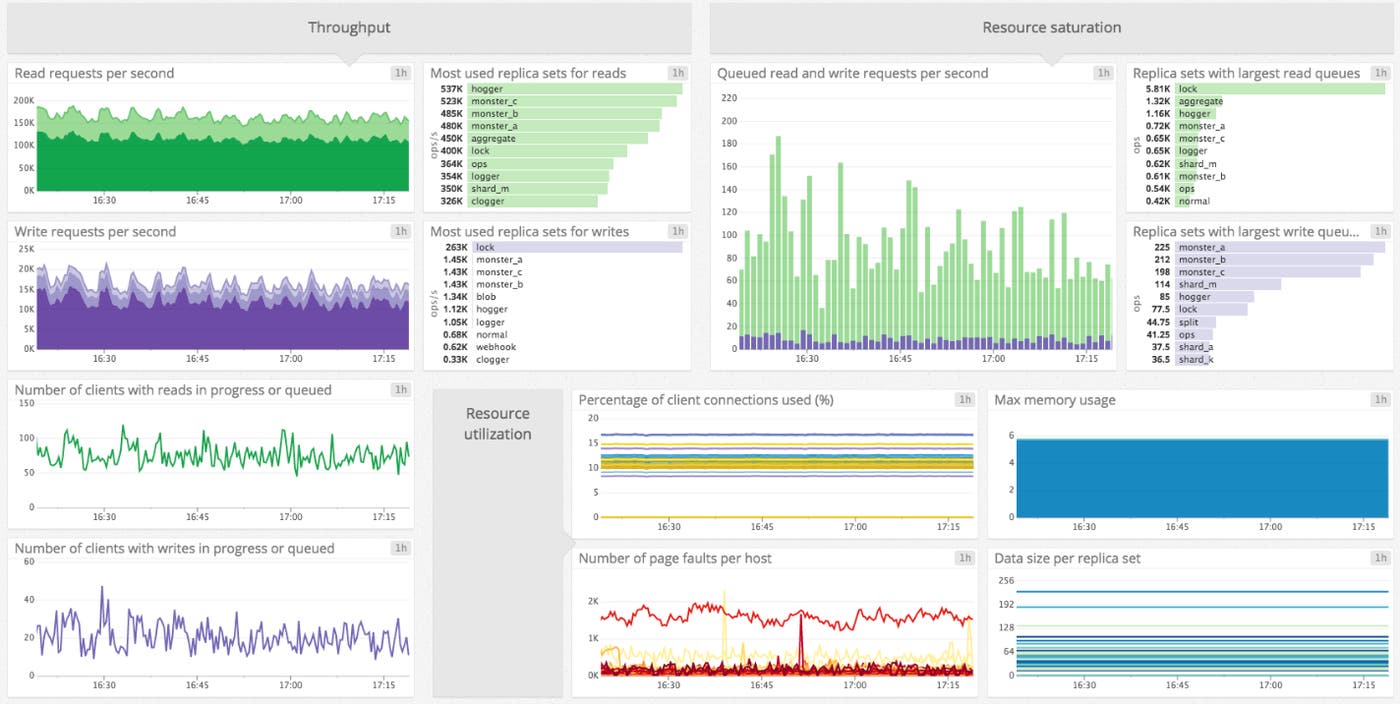
At Datadog, we worked with MongoDB’s team to develop a strong integration. Using Datadog you can start collecting, graphing, and monitoring all MongoDB metrics from your instances with a minimum of overhead, and immediately correlate what’s happening in MongoDB with the rest of your stack
Datadog offers extended monitoring functionality, such as:
- Dynamic slicing, aggregation, and filters on metrics
- Historical data access
- Advanced alerting mechanisms

For more details, check out our guide to monitoring MongoDB metrics with Datadog in the third and last part of this series.
Source Markdown for this post is available on GitHub. Questions, corrections, additions, etc.? Please let us know.


