


Paul Gottschling
ClickHouse is an open source database management system, and was originally developed as a backend for Yandex’s Metrica analytics platform. ClickHouse is column oriented, meaning that it can quickly scan through ranges of values in a single column without touching irrelevant values in other columns. This makes ClickHouse well suited for online analytical processing (OLAP).
When running ClickHouse, you’ll want to make sure that you are getting the best performance you can out of your queries while keeping your database instances healthy. We are pleased to announce that Datadog integrates with ClickHouse, giving you full visibility into your big data analytics jobs.
Optimize your ClickHouse queries
ClickHouse was designed for large-scale data analysis jobs, and achieves the best performance with a maximum of 100 queries per second on a single instance and a minimum of 1,000 rows for each INSERT query.
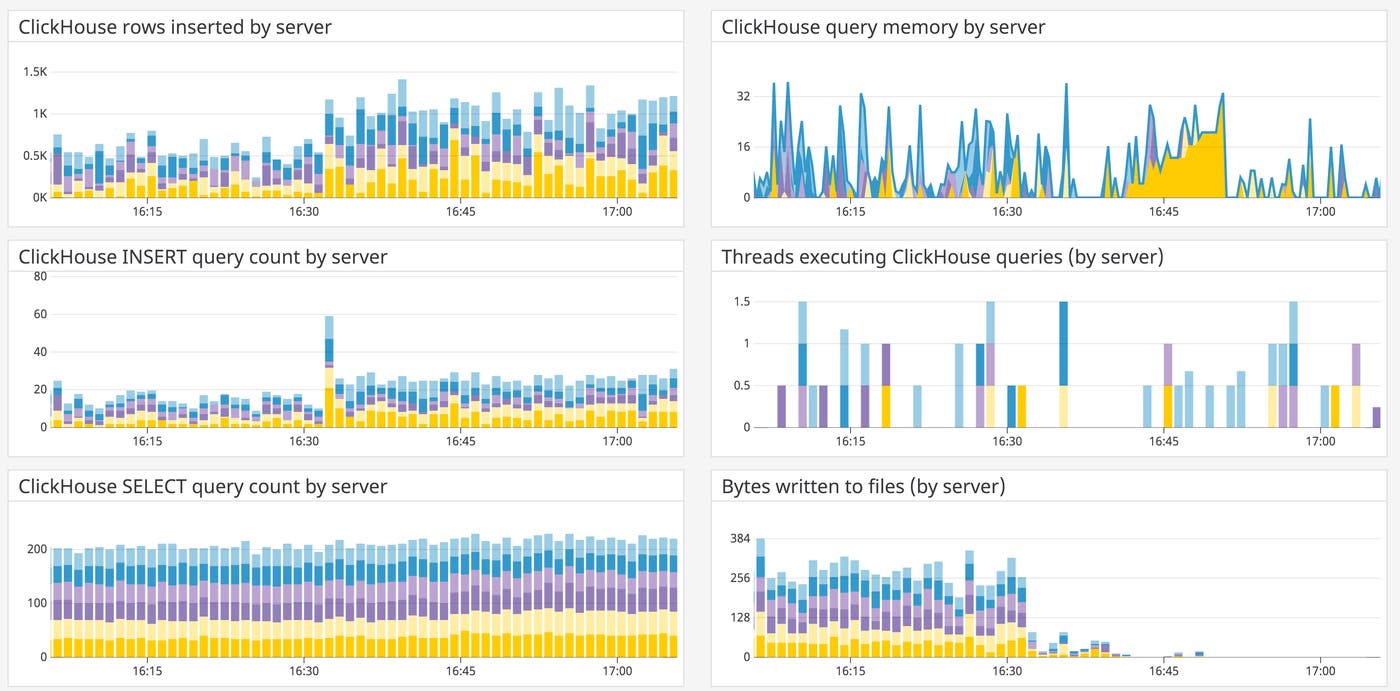
Datadog’s ClickHouse integration gives you the metrics you need to track read and write performance over time. You can track the rate of INSERT and SELECT queries per ClickHouse instance, as well as the number of rows written per query.
You can then compare query throughput with query resource usage (e.g., clickhouse.query.memory), helping you design your queries for maximum performance and minimum drag on your system. Datadog tags your ClickHouse metrics with the name of the server, port, and database, so you can easily locate performance issues and areas of improvement.
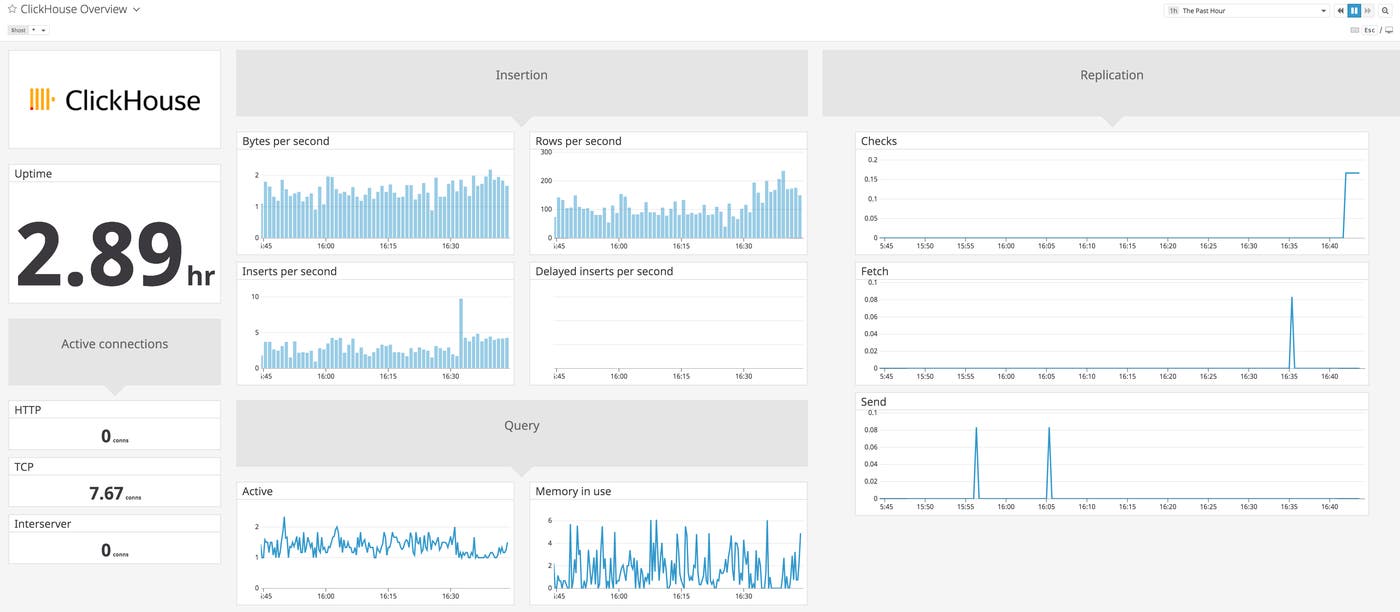
For an overview of ClickHouse’s health and performance, you can use the out-of-the-box dashboard that comes with the integration, which gives you insights into read and write throughput, resource utilization, and replication activity.
Ensure a healthy ZooKeeper connection
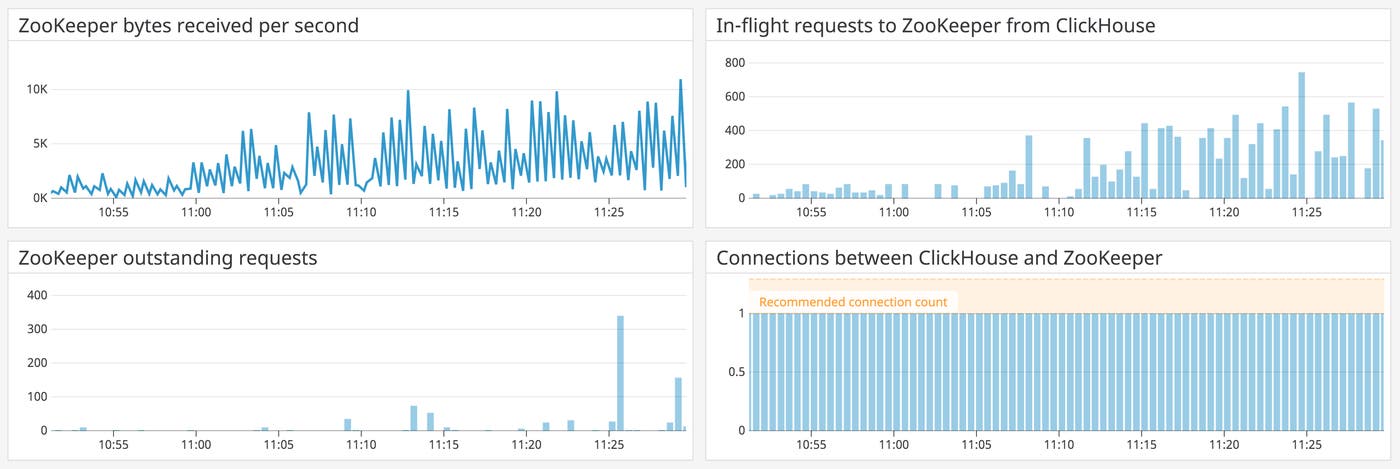
ClickHouse can replicate certain kinds of tables across servers for load balancing and fault tolerance, and uses ZooKeeper to store metadata about each replica. If ZooKeeper becomes unavailable, replicated tables become read-only. Datadog enables you to correlate ClickHouse monitoring data with ZooKeeper metrics to help you keep your data analysis cluster running.
Datadog’s ClickHouse integration tells you how your database is using ZooKeeper, with metrics for the number of ClickHouse nodes ZooKeeper is managing, in-flight requests to ZooKeeper, and connections between ZooKeeper and ClickHouse (which should remain at one per ClickHouse instance to avoid consistency issues). You can use Datadog’s ZooKeeper integration to see how much of ZooKeeper’s resource utilization is attributable to your ClickHouse deployment, giving you even more context into your ClickHouse cluster.
Find the query logs that count
When running infrequent but high-throughput read and write operations, you’ll want to make each job count. While ClickHouse’s logs are valuable for troubleshooting, running a clustered database can make it difficult to search all of your logs for the information you need.
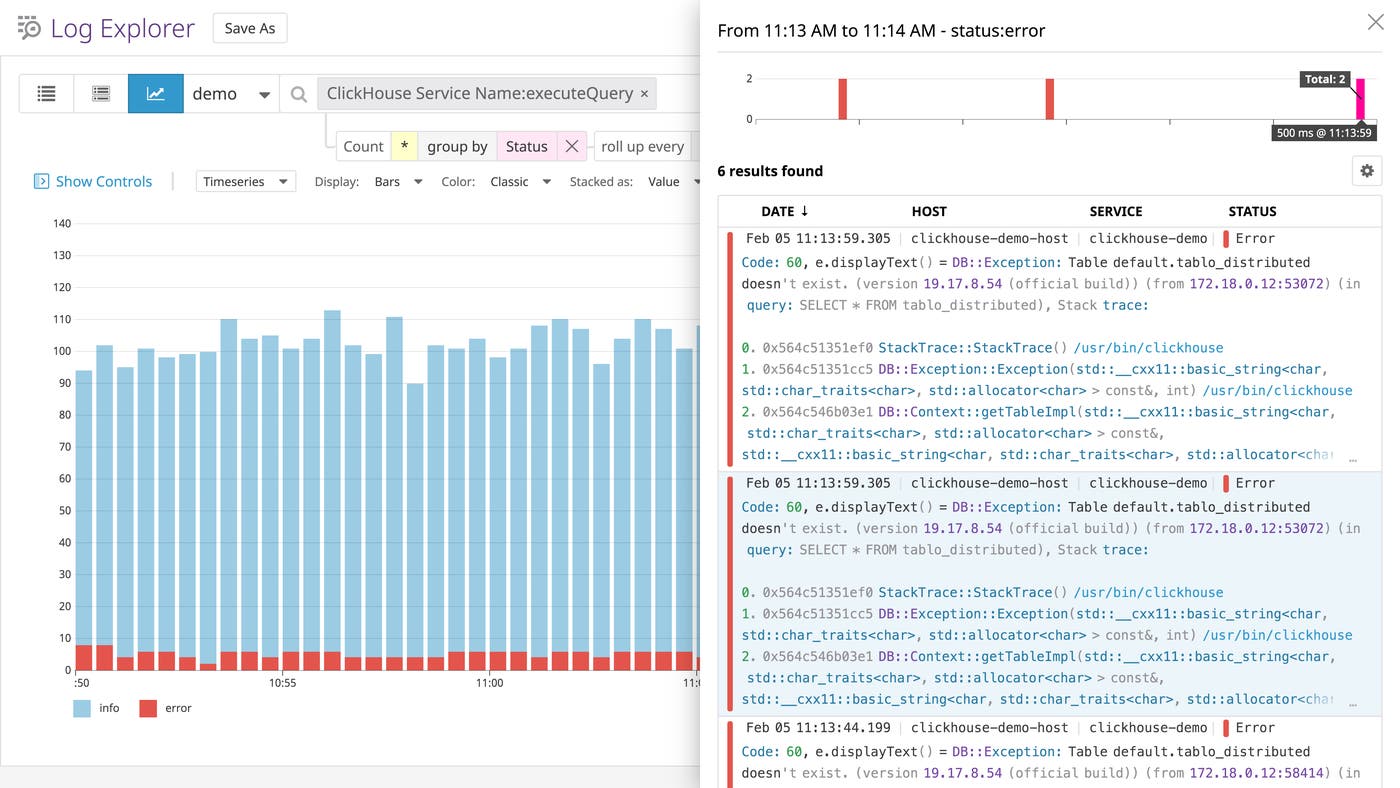
You can ship logs to Datadog from all of your ClickHouse instances to respond to errors in your queries more quickly. Datadog automatically enriches your database logs with metadata, such as the level of the log and pid of the running ClickHouse process, that you can use to group and filter your logs and plot trends over time. This enables you to identify unusual volumes of error messages, see which queries caused them, and determine where to take action.
Below, we’re using the clickhouse.service attribute—which indicates the component of ClickHouse that generated the log—to plot the count of all logs involved in executing queries, grouped by log status. We can see right away that some queries are consistently returning errors. We can then click on the graph, see the error messages, and find out what went wrong.
And if your metrics suggest something is wrong—perhaps the number of rows written (clickhouse.table.insert.row.count) stays flat during an INSERT query—you can pivot to view relevant logs by clicking on a timeseries graph.
Datadog is house trained
Now that Datadog integrates with ClickHouse, you can get comprehensive visibility into your distributed analytics jobs alongside ZooKeeper, data pipeline components like Apache Kafka, and more than 1,000 other technologies. If you’re not yet using Datadog, sign up for a free trial.


