Jordan Obey
VoltDB is an ACID-compliant, in-memory relational database designed to support real-time analytics. VoltDB’s in-memory storage, stored procedures, and shared-nothing architecture make it specifically optimized for quickly processing massive streams of data. This means VoltDB is tailored for use cases like online gaming, telecommunication, and financial applications, which require fast data processing.
Datadog’s new VoltDB integration provides you with full visibility into key database metrics and logs you can monitor and alert on to help you ensure that your VoltDB clusters remain available, have enough resources to handle demand, and are executing stored procedures as expected. After you set up the integration, you will have immediate access to a customizable out-of-the-box dashboard.

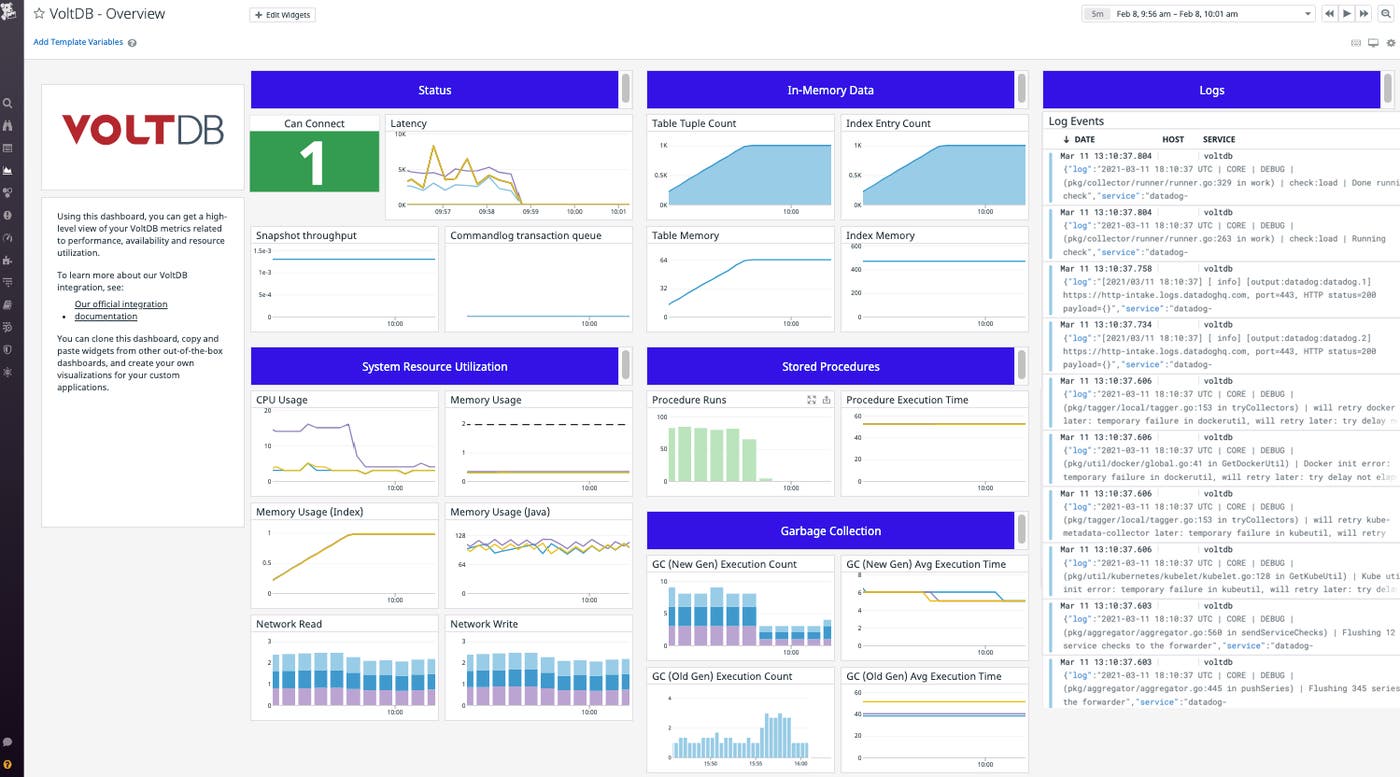
Datadog’s VoltDB dashboard provides you with a complete overview of the health and performance of your databases, giving you insight into metrics that track available memory, query latency, stored procedure performance, and table resource usage. The dashboard also provides a log stream, so you can correlate metrics with logs related to garbage collection, client authentication, and SQL execution events. This gives you greater context around any performance or capacity issues, enabling you to start troubleshooting as soon as a problem occurs and deciding, for example, if your database needs resizing.
Get a full view of your tables
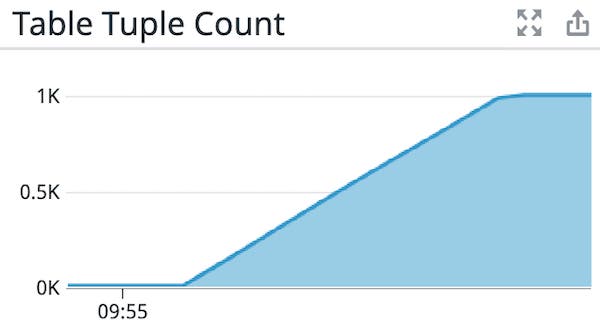
In order to speed up query processing, VoltDB automatically partitions database tables based on a specified partitioning column. Though partitioning helps optimize performance, it’s still important to make sure you understand the state of your tables, including how much data they’re currently storing and how that data is distributed. For example, you can see how many rows have been stored in a table (voltdb.table.tuple_count) and, if you have a row limit set, what percentage of that limit has been used (voltdb.table.percent_full). This will help you determine if and when you should adjust your row limit settings or scale your database by expanding system resources or adding more nodes to your cluster. Datadog automatically tags incoming metrics by table and partition so that you can see whether a specific partition of a table is approaching a row limit, which would prevent more data from being written to it.

Ensure stored procedures maintain high performance
In addition to partitioning tables, VoltDB can also partition stored procedures. This means that certain stored procedures only query specific partitions of your database, which helps SQL queries process quickly. Because VoltDB relies on stored procedures to perform optimally, monitoring their behavior is crucial to understanding the performance of your database. Monitoring how often procedures are invoked (voltdb.procedure.invocations) and their average execution times (voltdb.procedure.avg_execution_time) lets you track the performance of your stored procedures and ensure that they’re executing successfully and as quickly as you expect.

You can also compare the count of stored procedures’ successes (voltdb.procedure.successes) to their failures (voltdb.procedure.failures). If you notice a spike in procedures failing, examining VoltDB logs can provide you with insight into possible causes like failed client authentications or constraint violations.
Start monitoring your VoltDB database today
Datadog’s new integration provides you with full visibility into your VoltDB databases, enabling you to visualize and alert on key metrics and logs. If you already have a Datadog account, visit our documentation to get started. If you are not already using Datadog, get started today with a 14-day free trial.


