Jordan Obey
Presto is an open source SQL query engine that runs analytics on large datasets queried from a range of sources, including Hadoop and Cassandra. Presto was originally developed by Facebook to run queries on its large Apache Hadoop data warehouse and is now used as an interactive analytics tool at companies like Airbnb, Uber, and Netflix.
As Presto’s distributed worker nodes execute queries by combining data from a variety of sources, it can be difficult to investigate bottlenecks and to know when it’s time to scale your cluster up or down. With Datadog’s new integration, you can get comprehensive visibility into Presto query performance and resource usage alongside the rest of your distributed architecture.

Investigate and alert on Presto query performance issues
Unlike its predecessor, Apache Hive, Presto executes all of its queries in memory, and does not write in-progress query results to disk by default. Although this helps improve speed, it also means that memory-intensive queries run the risk of entering a BLOCKED state (which means they won’t execute until more memory becomes available). Although you can configure Presto to attempt to spill queries to disk if they require more memory than the query–or node–level limits, this approach is I/O-intensive, and can impair query execution time.
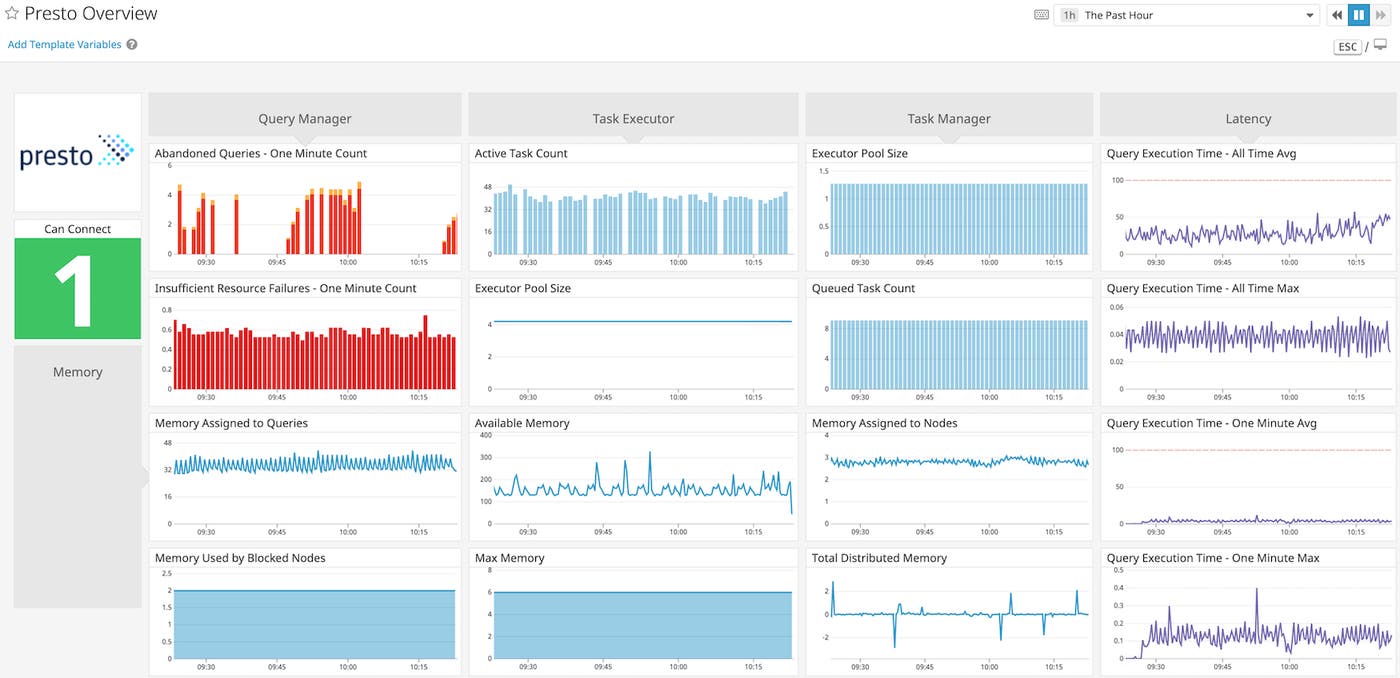
Datadog’s customizable dashboards allow you to compare and correlate Presto query execution latency with memory metrics collected from across your cluster, so you can investigate performance issues in real time.

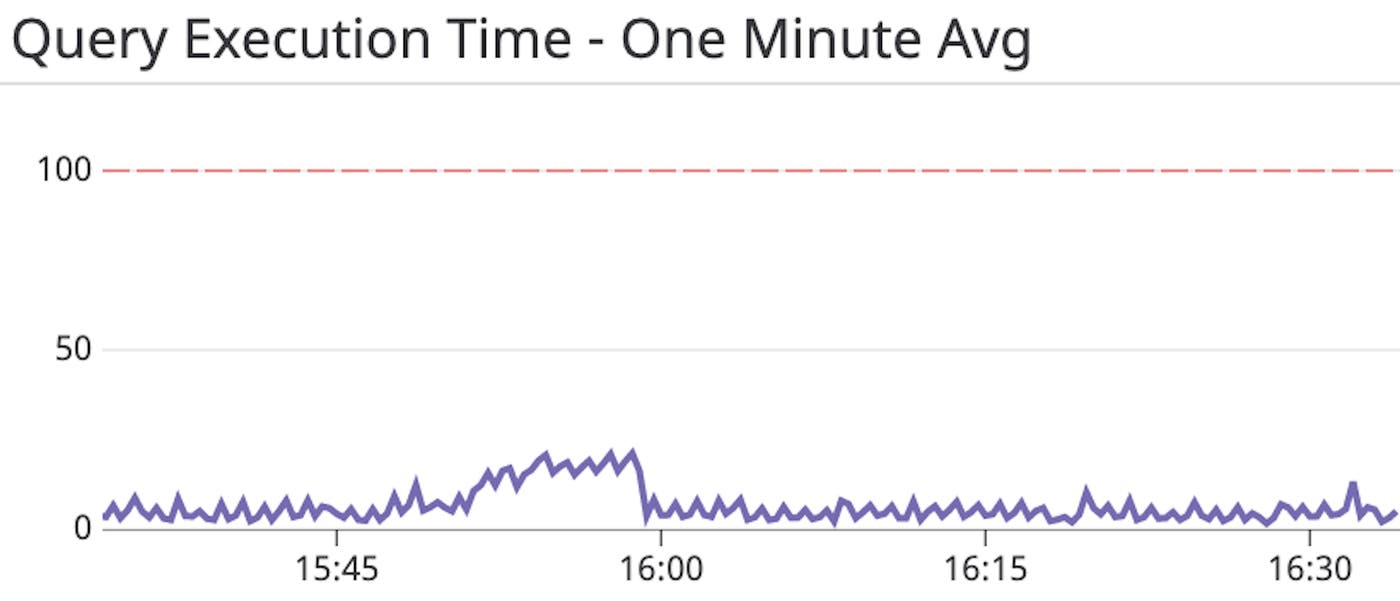
As shown in the image above, you can add a query execution time graph to your dashboard to establish a baseline, and you can then set up an alert to notify you when the average latency over the past minute (presto.execution.execution_time.one_minute.avg) exceeds a set threshold. If the alert triggers, you can investigate by correlating latency with memory usage and other resource metrics. If slow execution times are related to memory constraints, you may need to modify Presto’s default configuration to assign more memory to your cluster. You can also identify potential query bottlenecks by running a Presto EXPLAIN ANALYZE command.
Determine when and why queries fail with alerts and logs
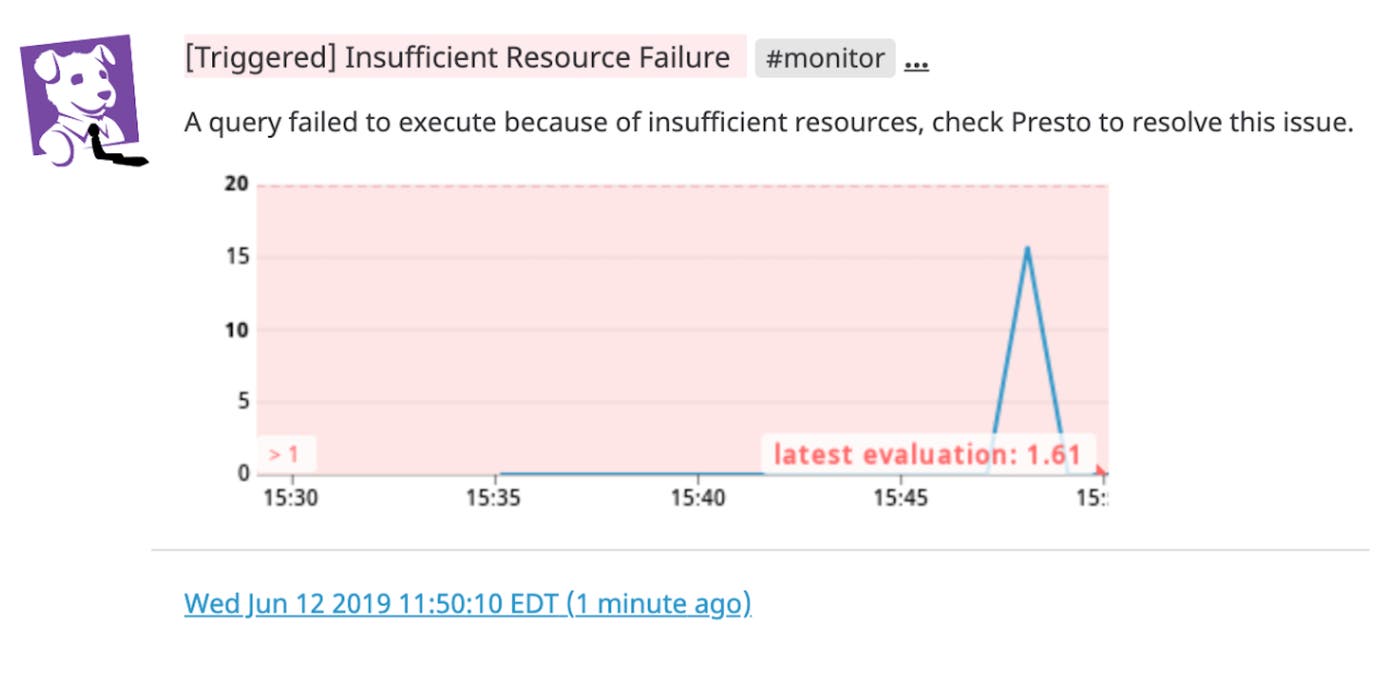
If your team relies on Presto as an interactive analysis tool to get quick insights into distributed data, it’s important to find out as soon as possible when queries fail so you can troubleshoot immediately. With Datadog, teams can visualize and alert on different types of query failures with metrics specifically for user, internal, external, or insufficient resource failures.
You can debug failures by correlating them with other metrics on your Presto dashboard. For example, an increased rate of “insufficient resource” failures has many possible causes, such as a deficit in memory or an overloaded CPU. To determine the source of the resource constraint, you can check your Presto worker nodes’ memory and CPU metrics and scale the appropriate resource as needed. You can also set up an alert to automatically get notified of any query failures.

To provide further context around incoming metrics, the Datadog integration also collects and processes Presto logs. Once the integration is enabled, Datadog automatically collects logs from Presto’s /var/log directory to provide granular details about your query engine. You can add a stream of Presto logs to your dashboard to quickly visualize comprehensive server and query log data, including query runtime and HTTP status updates, side-by-side with the rest of your Presto metrics, including server activity and query failures.
Monitor Presto alongside the rest of your infrastructure
We are pleased to include Presto alongside Datadog’s 1,000+ other integrations. With our new integration, you can easily monitor more than 100 Presto performance and resource usage metrics alongside metrics from data stores like HDFS, AWS S3, and Cassandra. Datadog brings together metrics, logs, and distributed tracing for a comprehensive view of Presto and the rest of your infrastructure.
If you aren’t already using Datadog, get started with a 14-day free trial.


