
Rishabh Moudgil

Paul Gottschling
Datadog Technical Content Writer
We've shown in Part 3 of this series how Datadog can help you monitor your SQL Server databases within the context of your application. In this post, we'll show you how to go one step further by collecting custom SQL Server metrics that let you choose the exact functionality you want to monitor and improve. You can configure the Agent to collect custom metrics and report them every time it runs its built-in SQL Server check.
We'll show you two ways to collect and monitor custom metrics:
Specifying performance counters beyond those the SQL Server integration queries by default
Using the Windows Management Instrumentation (WMI) integration
Custom Datadog metrics with the performance counters view
Although the Agent already collects a number of important metrics from the performance counters dynamic management view, you might be interested in monitoring additional performance objects such as page lookups per second, log flushes per second, or queued requests. You can see a list of all the performance counters you can monitor by running the following query:
SELECT counter_name, instance_name, cntr_value FROM sys.dm_os_performance_counters;You'll see something resembling the following:
counter_name instance_name cntr_value--------------------------------------------------------Page lookups/sec 30617439Log Flushes/sec tempdb 5664Log Flushes/sec model 7Log Flushes/sec demo_db 15152Queued requests internal 0To collect metrics automatically from specific performance counters, edit the SQL Server configuration file, which the Agent looks for within C:\ProgramData\Datadog\conf.d\sqlserver.d. Create an entry under custom_metrics for each metric you want to collect. For example, we can collect the metrics "Page lookups/sec," "Queued Requests," and "Log Flushes/sec," plus "Index Searches/sec," by adding the configuration below:
# ... custom_metrics: - name: sqlserver.buffer.page_lookups counter_name: Page lookups/sec
- name: sqlserver.workload.queued_requests counter_name: Queued Requests instance_name: internal
- name: sqlserver.databases.log_flushes counter_name: Log Flushes/sec instance_name: ALL tag_by: db
- name: sqlserver.index_searches counter_name: Index Searches/sec # ...For each entry, you must specify values for name and counter_name. The name value will be the name of the metric as you want it to appear in Datadog, whereas the counter_name maps to the counter_name column of sys.dm_os_performance_counters. In the case of "Page lookups/sec," the configuration above will cause the metric to appear in Datadog as sqlserver.buffer.page_lookups.
Some performance objects are associated with multiple instances within SQL Server, and you can identify these with the instance_name column of sys.dm_os_performance_counters. You'll want to check the documentation for the performance objects you're interested in to see what instance_name means in that context. In our example above, Log Flushes/sec is a counter within the object SQLServer:Databases. There's a separate instance of the object (and its counters) for each database. The resource pool performance object has a separate instance for each resource pool. Other performance objects, like the Buffer Manager object where you'll find Page lookups/sec, always have a single instance.
If a performance counter has multiple instances, you have two options for sending metrics to Datadog. One is to collect metrics from a single instance, by specifying instance_name in the custom_metrics section. In our example above, we've edited the item for Queued Requests to gather metrics only from the internal instance.
If you want to collect metrics associated with every instance, set the value of instance_name to ALL. Then add a tag_by line, which creates a key-value tag pair for each instance of a performance counter. If the metric Log Flushes/sec is reported for instances tempdb, model, and demo_db, for example, a tag_by prefix of db will create the tags db:tempdb, db:model, and db:demo_db. While you can name the prefix anything you'd like, you may want to name it after the object that each instance represents (a database, a resource pool, etc.).
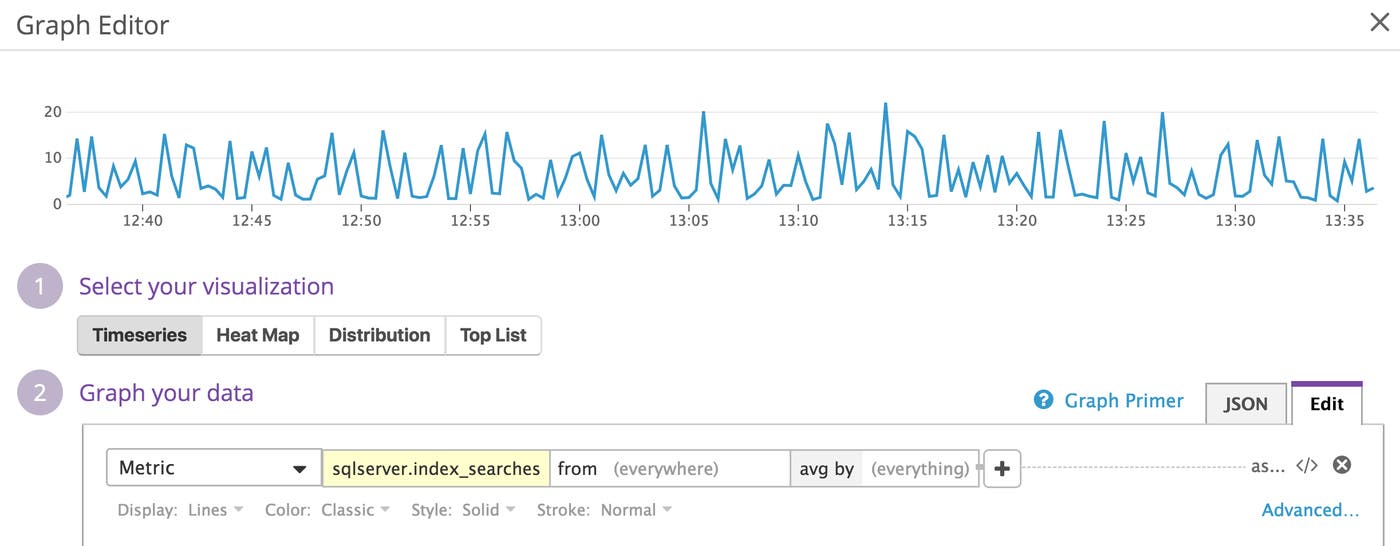
After restarting the Agent, you'll be able to add your custom metrics to dashboards and alerts, just like any other metric in Datadog. Below, we're graphing the custom metric sqlserver.index_searches, which we've named from the counter Index Searches/sec within the Access Methods performance object (see above).
Custom Datadog metrics from Windows Management Instrumentation
If you’re running SQL Server on Windows, you can also collect custom metrics by using Windows Management Instrumentation (WMI). WMI is a core feature of the Microsoft Windows operating system that allows applications to broadcast and receive data. Applications commonly use WMI to communicate information about resources, such as drivers, disks, or processes, including SQL Server. Datadog's WMI integration can monitor the hundreds of WMI classes you'll find in a Windows environment, making this is a convenient way to add custom metrics for SQL Server.
To configure the Agent to send metrics from WMI, you'll need to edit the WMI integration's configuration file. Under instances, list the names of the WMI classes from which you want to gather metrics. Under the item for each class, you'll list metrics as arrays with three elements: the name of a property of the WMI class, the name of the metric you'd like to report to Datadog, and the metric type.
You can collect the number of failed SQL Server jobs with the following configuration, for example:
instances: - class: Win32_PerfRawData_SQLSERVERAGENT_SQLAgentJobs metrics: - [Failedjobs, sqlserver.jobs.failed_jobs, gauge] # ...Then enable the WMI integration by restarting the Agent.
Click here to see all of the WMI classes that report data from SQL Server.
SQL Server metrics for tailored monitoring
In this series, we've surveyed metrics that can expose SQL Server's core functionality, and have shown you how to use a number of monitoring tools to get real-time views and detailed reports. We've demonstrated how you can combine live observation and on-demand insights by adding distributed tracing and log management, all with Datadog.
With custom metrics, it's possible to monitor every metric SQL Server collects internally, and to use this as a basis for optimizing your databases. With Datadog, you can correlate these metrics with others from SQL Server and the rest of your stack, making it clear where performance issues are originating or where you should focus your optimization efforts.
If you are not using Datadog and want to gain visibility into the health and performance of SQL Server and more than 1,000 other supported technologies, you can get started by signing up for a 14-day free trial.
