

Paul Gottschling
Datadog Technical Content Writer

Addie Beach
Technical Content Writer

Anjali Thatte
Product Manager
What is RabbitMQ?
RabbitMQ is a message broker, a tool for implementing a messaging architecture. Some parts of your application publish messages, others consume them, and RabbitMQ routes them between producers and consumers. The broker is well suited for loosely coupled microservices. If no service or part of the application can handle a given message, RabbitMQ keeps the message in a queue until it can be delivered. RabbitMQ leaves it to your application to define the details of routing and queuing, which depend on the relationships of objects in the broker: exchanges, queues, and bindings.
If your application is built around RabbitMQ messaging, then comprehensive monitoring requires gaining visibility into the broker itself. RabbitMQ exposes metrics for all of its main components, giving you insight into your message traffic and how it affects the rest of your system.
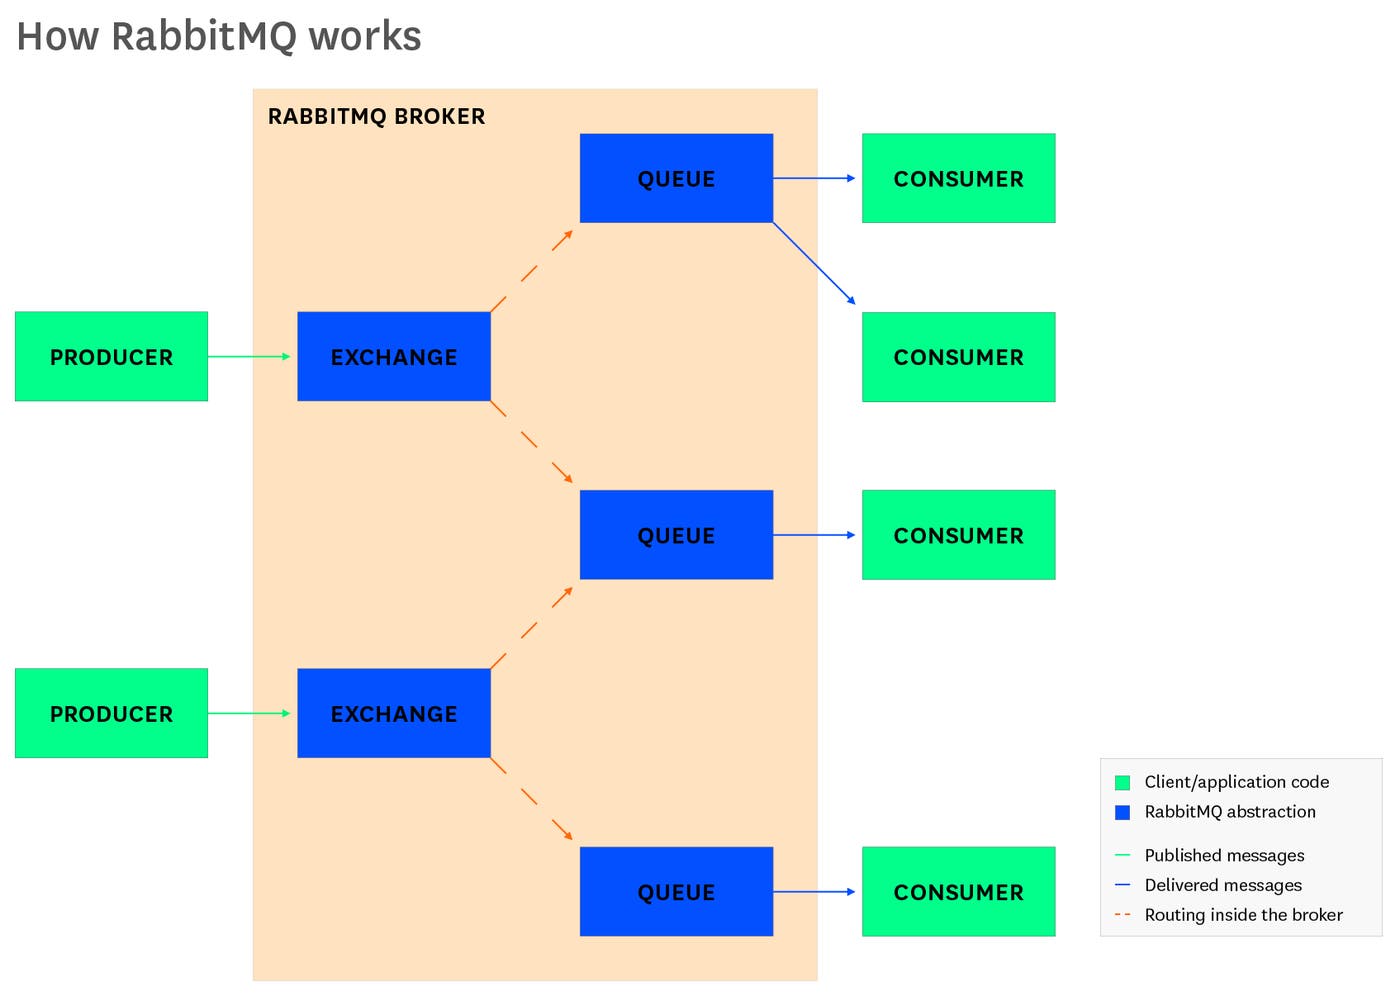
How RabbitMQ works
RabbitMQ runs as an Erlang runtime, called a node. A RabbitMQ server can include one or more nodes, and a cluster of nodes can operate across one machine or several. Connections to RabbitMQ take place through TCP, making RabbitMQ suitable for a distributed setup. While RabbitMQ supports a number of protocols, it implements AMQP (Advanced Message Queuing Protocol) and extends some of its concepts.
At the heart of RabbitMQ is the message. Messages feature a set of headers and a binary payload. Any sort of data can make up a message. It is up to your application to parse the headers and use this information to interpret the payload.
The parts of your application that join up with the RabbitMQ server are called producers and consumers. A producer is anything that publishes a message, which RabbitMQ then routes to another part of your application: the consumer. RabbitMQ clients are available in a range of languages, letting you implement messaging in most applications.
RabbitMQ passes messages through abstractions within the server called exchanges and queues. When your application publishes a message, it publishes to an exchange. An exchange routes a message to a queue. Queues wait for a consumer to be available, then deliver the message.
You'll notice that a message going from a producer to a consumer moves through two intermediary points, an exchange and a queue. This separation lets you specify the logic of routing messages. There can be multiple exchanges per queue, multiple queues per exchange, or a one-to-one mapping of queues and exchanges. Which queue an exchange delivers to depends on the type of the exchange. While RabbitMQ defines the basic behaviors of topics and exchanges, how they relate is up to the needs of your application.
There are many possible design patterns. You might use work queues, a publish/subscribe pattern, or a Remote Procedure Call (as seen in OpenStack Nova), just to name examples from the official tutorial. The design of your RabbitMQ setup depends on how you configure its application objects (nodes, queues, exchanges...). RabbitMQ exposes metrics for each of these, letting you measure message traffic, resource use, and more.
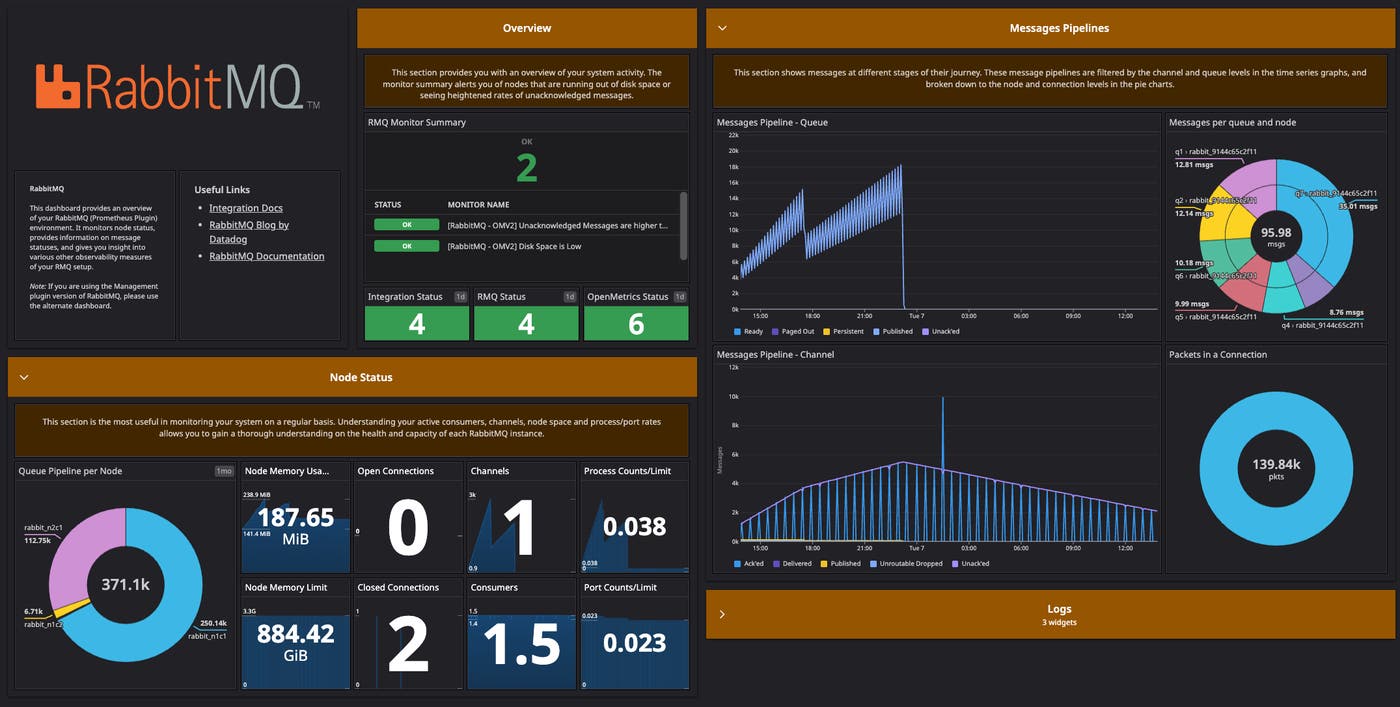
Key RabbitMQ metrics
With so many moving parts within the RabbitMQ server, and so much room for configuration, you'll want to make sure your messaging setup is working as efficiently as possible. As we've seen, RabbitMQ has a whole cast of abstractions, and each has its own metrics. These include:
This post, the first in the series, is a tour through these metrics. In some cases, the metrics have to do with RabbitMQ-specific abstractions, such as queues and exchanges. Other components of a RabbitMQ application demand attention to the same metrics that you'd monitor in the rest of your infrastructure, such as storage and memory resources.
You can gather RabbitMQ metrics through a set of plugins and built-in tools. One is rabbitmqctl, a RabbitMQ command line interface that lists queues, exchanges, and so on, along with various metrics. Another is a management plugin that reports metrics from a local web server, as well as a Prometheus plugin that can transmit metrics in the OpenMetrics format. Several tools report events. We'll tell you how to use these tools in Part 2.
Exchange performance
Exchanges tell your messages where to go. Monitoring exchanges lets you see whether messages are being routed as expected.
Name | Description | Metric type | Availability
:--|:---|:--|:--|
Messages published in | Messages published to an exchange | Work: Throughput | both plugins
Messages unroutable | Count of messages not routed to a queue | Work: Errors | both plugins
Metric to alert on: Messages unroutable
In RabbitMQ, you specify how a message will move from an exchange to a queue by defining bindings. If a message falls outside the rules of your bindings, it is considered unroutable. In some cases, such as a Publish/Subscribe pattern, it may not be important for consumers to receive every message. In others, you may want to keep missed messages to a minimum. RabbitMQ's implementation of AMQP includes a way to detect unroutable messages, sending them to a dedicated ('Alternative') exchange. In either of the plugins (see Part 2), capture the unroutable returns metric, constraining the count to a given time interval. If some messages have not been routed properly, the rate of publications into an exchange will also exceed the rate of publications out of the exchange, suggesting that some messages have been lost.
Nodes
RabbitMQ runs inside an Erlang runtime system called a node. For this reason the node is the primary reference point for observing the resource use of your RabbitMQ setup.
When use of certain resources reaches a threshold, RabbitMQ triggers an alarm and blocks connections. These connections appear as blocking in built-in monitoring tools, but it is left to the user to set up notifications (see Part 2). For this reason, monitoring resource use across your RabbitMQ system is necessary for ensuring availability.
Name | Description | Metric type | Availability
:--|:---|:--|:--|
| File descriptors used | Count of file descriptors used by RabbitMQ processes | Resource: Utilization | both plugins, rabbitmqctl |
| Network sockets | Count of how many network sockets are open by RabbitMQ | Resource: Utilization | both plugins, rabbitmqctl |
| Disk space used | Bytes of disk used by a RabbitMQ node | Resource: Utilization | both plugins, rabbitmqctl |
| Memory used | Bytes in RAM used by a RabbitMQ node (categorized by use) | Resource: Utilization | both plugins, rabbitmqctl |
Metrics to alert on: File descriptors used, file descriptors used as sockets
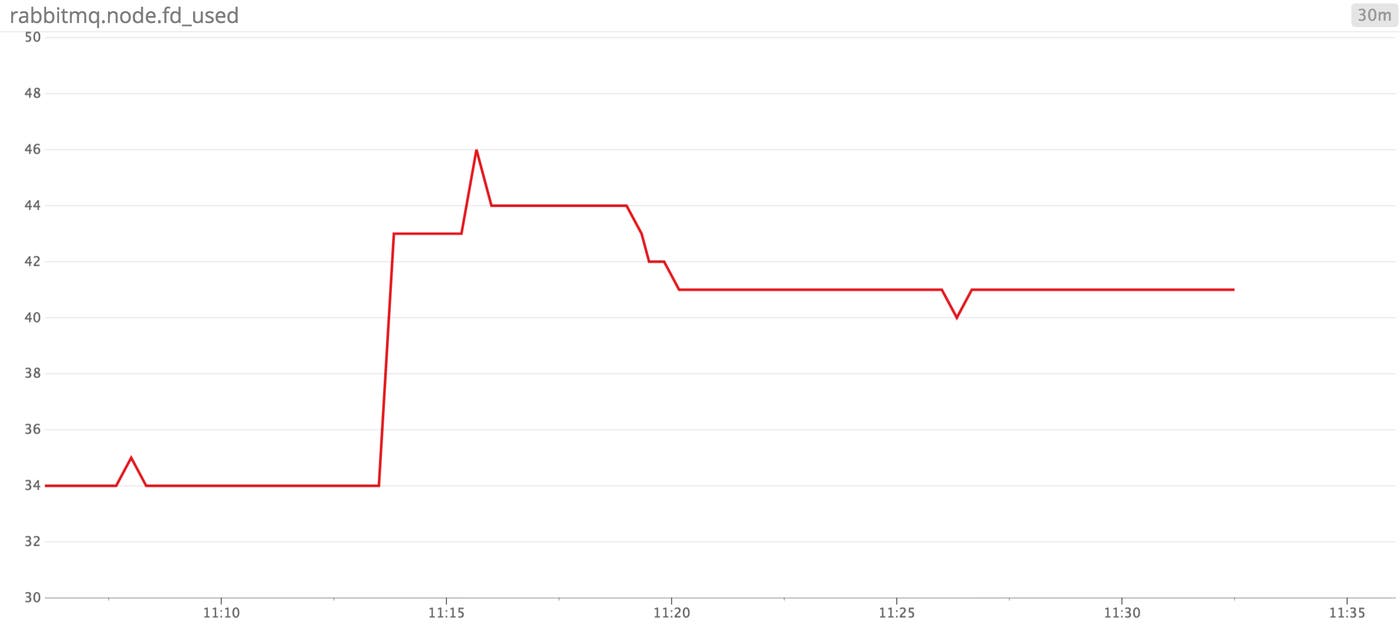
As you increase the number of connections to your RabbitMQ server, RabbitMQ uses a greater number of file descriptors and network sockets. Since RabbitMQ will block new connections for nodes that have reached their file descriptor limit, monitoring the available number of file descriptors helps you keep your system running (configuring the file descriptor limit depends on your system, as seen in the context of Linux here). On the front page of the management plugin UI, you'll see a count of your file descriptors for each node. You can fetch this information through the HTTP API (see Part 2). This timeseries graph shows what happens to the count of file descriptors used when we add, then remove, connections to the RabbitMQ server.
Metrics to alert on: Disk space used
RabbitMQ goes into a state of alarm when the available disk space of a given node drops below a threshold. Alarms notify your application by passing an AMQP method, connection.blocked, which RabbitMQ clients handle differently (e.g. Ruby, Python). The default threshold is 50MB, and the number is configurable. RabbitMQ checks the storage of a given drive or partition every 10 seconds, and checks more frequently closer to the threshold. Disk alarms impact your whole cluster: once one node hits its threshold, the rest will stop accepting messages. By monitoring storage at the level of the node, you can make sure your RabbitMQ cluster remains available. If storage becomes an issue, you can check queue-level metrics and see which parts of your RabbitMQ setup demand the most disk space.
Metrics to alert on: Memory used
As with storage, RabbitMQ alerts on memory. Once a node's RAM utilization exceeds a threshold, RabbitMQ blocks all connections that are publishing messages. If your application requires a different threshold than the default of 40 percent, you can set the vm_memory_high_watermark in your RabbitMQ configuration file. Monitoring the memory your nodes consume can help you avoid surprise memory alarms and throttled connections.
The challenge for monitoring memory in RabbitMQ is that it's used across your setup, at different scales and different points within your architecture, for application-level abstractions such as queues as well as for dependencies like Mnesia, Erlang's internal database management system. A crucial step in monitoring memory is to break it down by use. In Part 2, we'll cover tools that let you list application objects by memory and visualize that data in a graph.
Connection performance
Any traffic in RabbitMQ flows through a TCP connection. Messages in RabbitMQ implement the structure of the AMQP frame: a set of headers for attributes like content type and routing key, as well as a binary payload that contains the content of the message. RabbitMQ is well suited for a distributed network, and even single-machine setups work through local TCP connections. Like monitoring exchanges, monitoring your connections helps you understand your application's messaging traffic. While exchange-level metrics are observable in terms of RabbitMQ-specific abstractions such as message rates, connection-level metrics are reported in terms of computational resources.
Name | Description | Metric type | Availability
:--|:---|:--|:--|
Data rates | Number of octets (management) or bytes (Prometheus) sent/received within a TCP connection per second | Resource: Utilization | both plugins |
Metrics to watch: Data rates
The logic of publishing, routing, queuing and subscribing is independent of a message's size. RabbitMQ messages are always first-in, first-out, and require a consumer to parse their content. From the perspective of a queue, all messages are equal.
One way to get insight into the payloads of your messages, then, is by monitoring the data that travels through a connection. If you're seeing a rise in memory or storage in your nodes, the messages moving to consumers through a connection may be holding a greater payload. Whether the messages use memory or storage depends on your persistence settings, which you can monitor along with your queues. A rise in the rate of sent octets may explain spikes in storage and memory use downstream.
Queue performance
Queues receive, push, and store messages. After the exchange, the queue is a message's final stop within the RabbitMQ server before it reaches your application. In addition to observing your exchanges, then, you will want to monitor your queues. Since the message is the top-level unit of work in RabbitMQ, monitoring queue traffic is one way of measuring your application's throughput and performance.
Name | Description | Metric type | Availability
:--|:---|:--|:--|
Queue depth | Count of all messages in the queue | Resource: Saturation | rabbitmqctl
Messages unacknowledged | Count of messages a queue has delivered without receiving acknowledgment from a consumer | Resource: Error | both plugins, rabbitmqctl
Messages ready | Count of messages available to consumer | Other | both plugins, rabbitmqctl
Messages persistent | Count of messages written to disk | Other | rabbitmqctl
Message bytes persistent/paged out | Sum in bytes of messages written to disk | Resource: Utilization | both plugins, rabbitmqctl
Message bytes RAM | Sum in bytes of messages stored in memory | Resource: Utilization | both plugins, rabbitmqctl
Number of consumers | Count of consumers for a given queue | Other | rabbitmqctl
Consumer utilization | Proportion of time that the queue can deliver messages to consumers | Resource: Availability | both plugins
Metrics to watch: Queue depth, messages unacknowledged, and messages ready
Queue depth, or the count of messages currently in the queue, tells you a lot and very little: a queue depth of zero can indicate that your consumers are behaving efficiently or that a producer has thrown an error. The usefulness of queue depth depends on your application's expected performance, which you can compare against queue depths for messages in specific states.
For instance, messages_ready indicates the number of messages that your queues have exposed to subscribing consumers. Meanwhile, messages_unacknowledged tracks messages that have been delivered but remain in a queue pending explicit acknowledgment (an ack) by a consumer. By comparing the values of messages, messages_ready and messages_unacknowledged, you can understand the extent to which queue depth is due to success or failure elsewhere.
Metrics to watch: Message rates
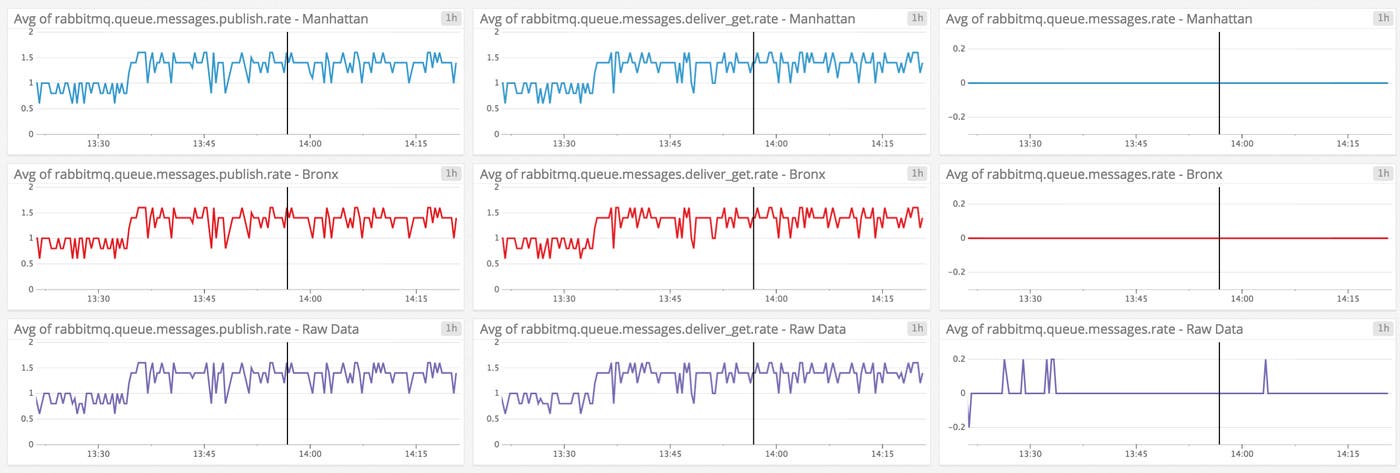
You can also retrieve rates for messages in different states of delivery. If your messages_unacknowledged rate is higher than usual, for example, there may be errors or performance issues downstream. If your deliveries per second are lower than usual, there may be issues with a producer, or your routing logic may have changed.
This dashboard shows message rates for three queues, all part of a test application that collects data about New York City.
Metric to watch: Messages persistent, message bytes persistent, and message bytes RAM
A queue may persist messages in memory or on disk, preserving them as pairs of keys and values in a message store. The way RabbitMQ stores messages depends on whether your queues and messages are configured to be, respectively, durable and persistent. Transient messages are written to disk in conditions of memory pressure. Since a queue consumes both storage and memory, and does so dynamically, it's important to keep track of your queues' resource metrics. For instance you can compare two metrics, message_bytes_persistent and message_bytes_ram, to understand how your queue is allocating messages between resources.
Metric to alert on: Number of consumers
Since you configure consumers manually, an application running as expected should have a stable consumer count. A lower-than-expected count of consumers can indicate failures or errors in your application.
Metric to alert on: Consumer utilization
A queue's consumers are not always able to receive messages. If you have configured a consumer to acknowledge messages manually, you can stop your queues from releasing more than a certain number at a time before they are consumed. This is your channel's prefetch setting. If a consumer encounters an error and terminates, the proportion of time in which it can receive messages will shrink. By measuring consumer utilization, which the management and Prometheus plugins (see Part 2) report as a percentage and as a decimal between 0 and 1, you can determine the availability of your consumers.
Get inside your messaging stack
Much of the work that takes place in your RabbitMQ setup is only observable in terms of abstractions within the server, such as exchanges and queues. RabbitMQ reports metrics on these abstractions in their own terms, for instance counting the messages that move through them. Abstractions you can monitor, and the metrics RabbitMQ reports for them, include:
Exchanges: Messages published in, messages published out, messages unroutable
Queues: Queue depth, messages unacknowledged, messages ready, messages persistent, message bytes persistent, message bytes RAM, number of consumers, consumer utilization
Monitoring your message traffic, you can make sure that the loosely coupled services within your application are communicating as intended.
You will also want to track the resources that your RabbitMQ setup consumes. Here you'll monitor:
Nodes: File descriptors used, file descriptors used as sockets, disk space used, memory used
Connections: Octets/bytes sent and received
In Part 2 of this series, we'll show you how to use a number of RabbitMQ monitoring tools. In Part 3, we'll introduce you to comprehensive RabbitMQ monitoring with Datadog, including the RabbitMQ integration.
Acknowledgments
We wish to thank our friends at Pivotal for their technical review of this series.
