

David M. Lentz
In Part 1 of this series, we looked at EFS metrics from several different categories—storage, latency, I/O, throughput, and client connections. In this post, we'll show you how you can collect those metrics—as well as EFS logs—using built-in and external tools. We'll look at how to:
view metrics in the EFS console
use the CloudWatch console and API
collect metrics with Linux tools
collect EFS logs with AWS logging services and Linux logging tools
Collect EFS metrics
Collecting and analyzing EFS metrics can help you understand your file systems' role in the health and performance of your applications. Because EFS is a managed service, some standard approaches to monitoring, such as monitoring server resource metrics, are not applicable. In this section, we'll look at some tools provided by AWS and some that are built into Linux that let you collect and visualize key EFS metrics.
The EFS console
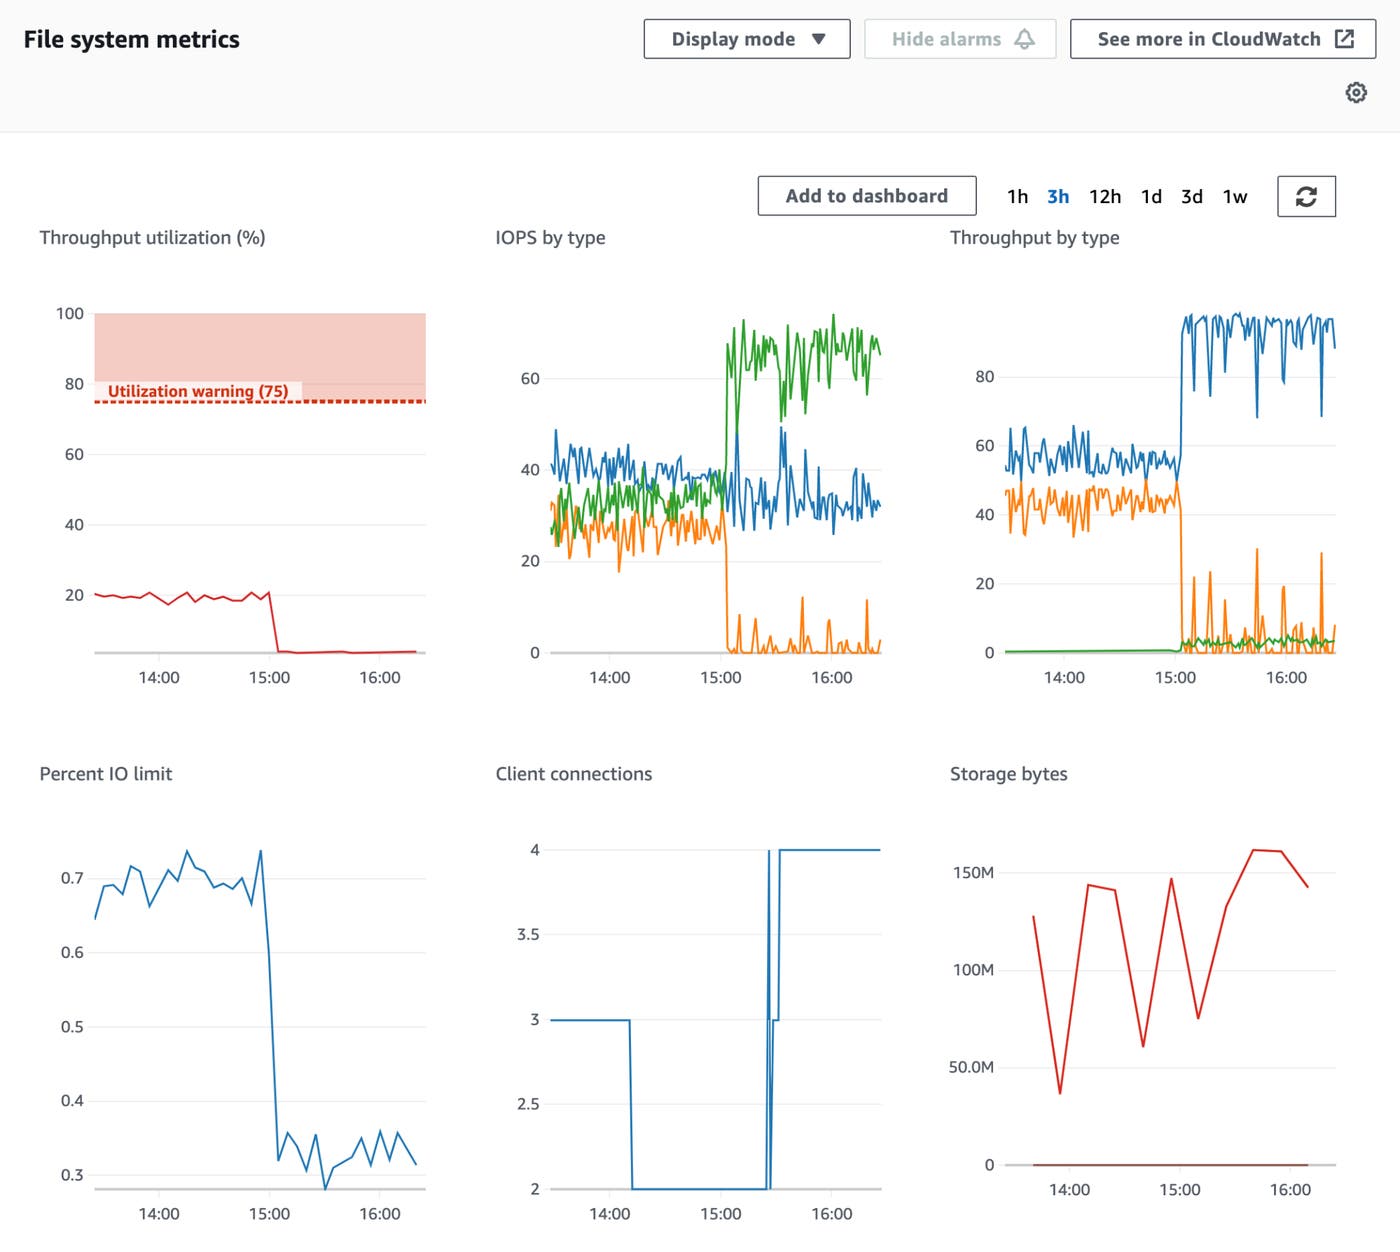
You can use the EFS console, which is available from within the AWS Management Console, to create and delete file systems, define their settings, and manage mount targets and access points. You can also see graphs of key metrics we looked at in Part 1 of this series, such as throughput, I/O, client connections, and storage, to visualize the performance of each file system over time.
CloudWatch
While the EFS console is a good way to quickly begin monitoring your EFS file systems, Amazon CloudWatch allows you to monitor, correlate, and alert on the performance of EFS and the other AWS services you use. In this section, we'll show you how to use the CloudWatch console to visualize the data that CloudWatch collects, and we'll introduce you to the CloudWatch API, which allows you to retrieve EFS metrics programmatically.
CloudWatch console
The CloudWatch console for EFS—shown in the screenshot below—includes a built-in dashboard that expands on the data shown in the EFS console and visualizes connections, IOPS, burst credits, and throughput data from multiple file systems at once.
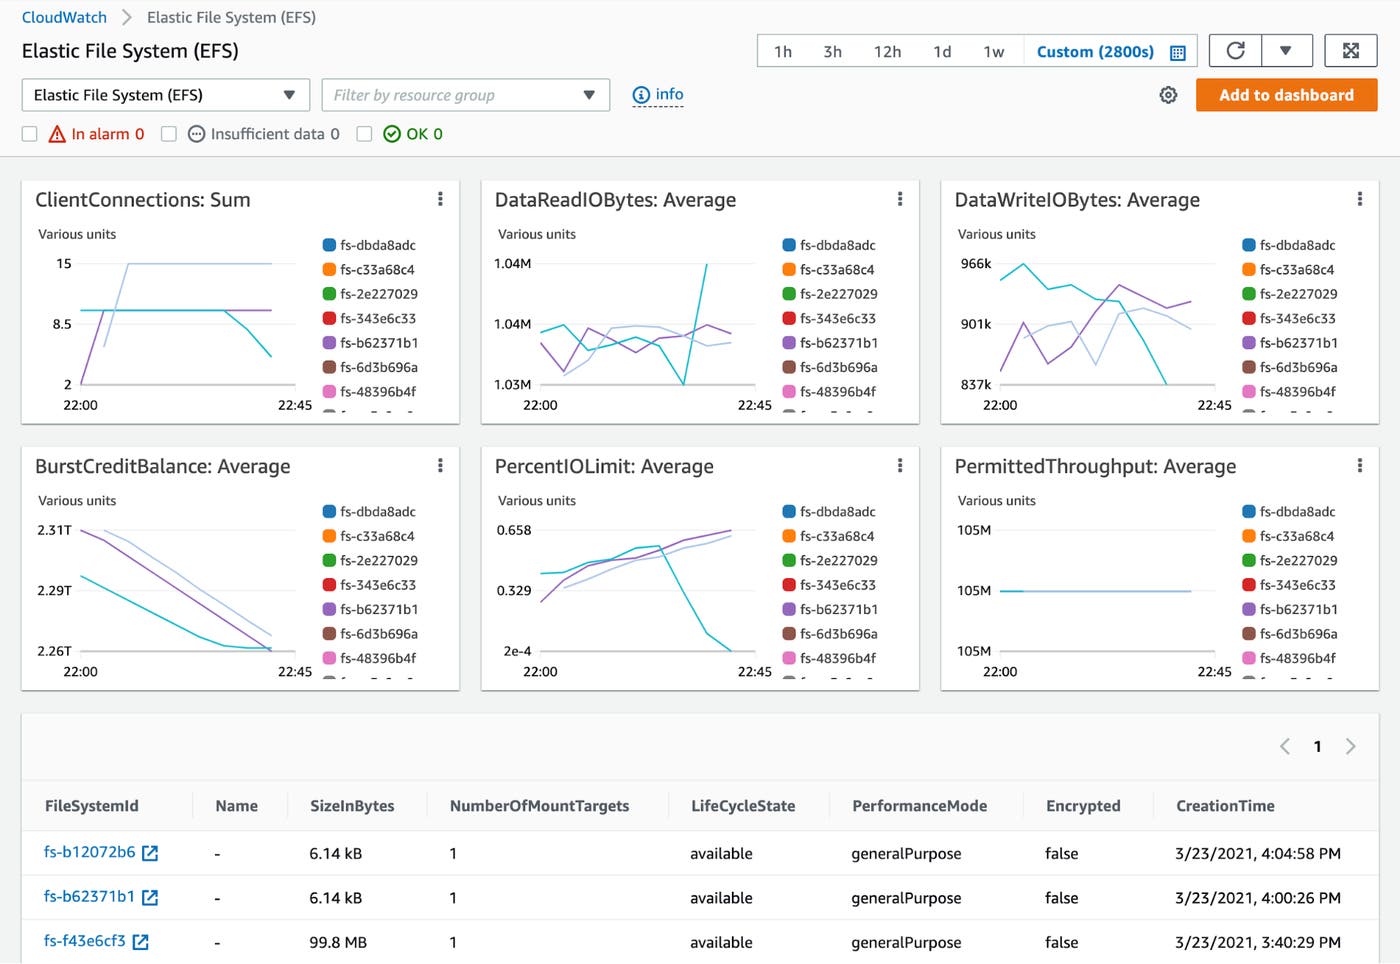
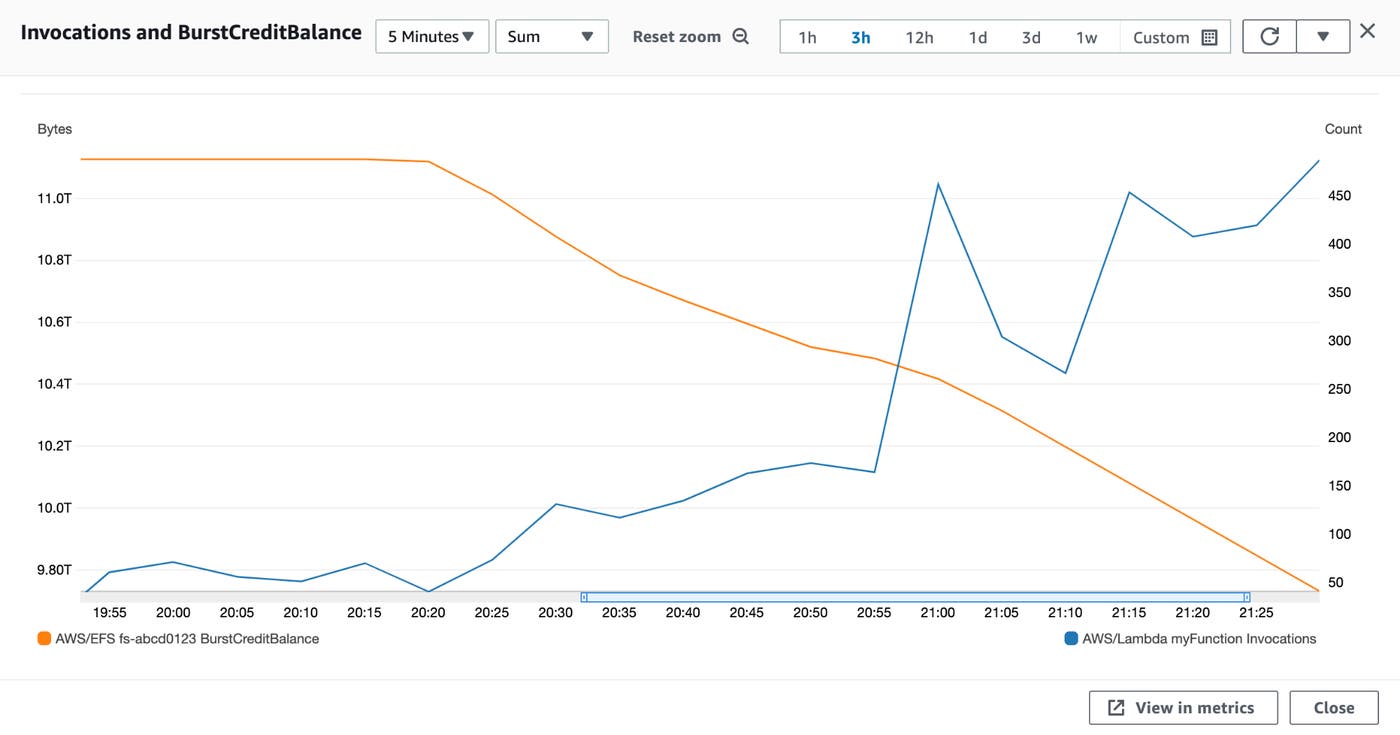
You can open any one of these graphs in CloudWatch metrics, where you can modify it and add it to a custom dashboard. Custom dashboards allow you to graph metrics from multiple AWS services in a single view or even on the same graph, so you can quickly explore possible causes of an issue you need to troubleshoot. For example, the graph in the screenshot below shows the BurstCreditBalance value for an EFS file system decreasing as the rate of a Lambda function's Invocations rises. This correlation suggests that the Lambda function's increased disk activity could be consuming the available burst credits, which, as discussed in the section on throughput metrics in Part 1 of this series, could ultimately cause user-facing latency.
You can create an alarm for any metric you see in the CloudWatch console by defining a threshold value for the metric and an SNS topic to which AWS will automatically send a message if the metric breaches that value. You can also create anomaly-based CloudWatch Alarms to automatically notify you, for example, if the number of clients connected to your file system changes significantly from its historical range of values.
CloudWatch API
In the previous section, we discussed how the CloudWatch console lets you visualize and alert on EFS metrics. You can also fetch EFS metrics programmatically from the CloudWatch API via AWS SDKs or the AWS command-line interface (CLI). The AWS SDKs enable you to call the API with Python, Ruby, Go, and many other languages, so you can integrate EFS monitoring into your processes or applications. In contrast, the CLI is useful for manually executing ad hoc queries or creating scripts that automatically collect metrics.
To use the AWS CLI, you'll first need to install it on the host where you'll execute the API calls. You'll also need to configure the necessary authentication, for example by using an EC2 instance profile.
To get CloudWatch metrics through the CLI, you use the cloudwatch subcommand. The example below uses the get-metric-statistics action to retrieve the value of the StorageBytes metric from the AWS/EFS namespace. The command includes start-time and end-time parameters to scope the request to a one-hour time frame, a period parameter to aggregate the metrics every 15 minutes, and a statistics parameter to request a sum of the collected metric values. The dimensions parameter holds key-value pairs to define the file system (FileSystemId) and the storage class (StorageClass) to query.
aws cloudwatch get-metric-statistics \--metric-name StorageBytes \--start-time 2021-04-02T16:35:00 \--end-time 2021-04-02T17:35:00 \--period 900 \--statistics Sum \--namespace AWS/EFS \--dimensions Name=FileSystemId,Value=<MY-FILE-SYSTEM-ID> Name=StorageClass,Value=TotalThe get-metric-statistics action returns a JSON object like the one shown below. This example result contains four records, one every 15 minutes over the one-hour time frame specified in the request. Note that CloudWatch does not guarantee that records returned by get-metric-statistics will appear in chronological order.
{ "Label": "StorageBytes", "Datapoints": [ { "Timestamp": "2021-04-02T16:50:00+00:00", "Sum": 4220928.0, "Unit": "Bytes" }, { "Timestamp": "2021-04-02T17:05:00+00:00", "Sum": 4220928.0, "Unit": "Bytes" }, { "Timestamp": "2021-04-02T16:35:00+00:00", "Sum": 2123776.0, "Unit": "Bytes" }, { "Timestamp": "2021-04-02T17:20:00+00:00", "Sum": 4220928.0, "Unit": "Bytes" } ]}See the AWS CLI documentation to learn more about interacting with the CloudWatch API. And to find more information on the CloudWatch metrics available in the EFS namespace, see the EFS documentation.
Linux tools
If your EFS client is a Linux-based EC2 instance (EFS does not support Windows), you can use Linux utilities to collect metrics that describe the file system and the performance of the client. In this section, we'll show you how to query an instance to see the size of its mounted file systems, as well as per-client metrics that aren't available in CloudWatch: the latency, throughput, and error rate of its EFS read and write operations. To execute the commands shown in this section, you can SSH to your instance's command line or use AWS Systems Manager Run Command. On EKS, you can use kubectl to execute these commands, and on ECS, you can use ECS Exec. And although Lambda doesn't provide a CLI, we'll show you an example of how you can query a file system's size from within a Lambda function.
Determine the storage used by a file system
AWS calculates and charges for EFS storage based on metered size—the space required to store your objects and metadata. Knowing the size of your file system can help you spot unexpected changes in the amount of data your application is storing and can even help you estimate your EFS costs. On a Linux host, you can use the df tool to see the total space used by a mounted file system, which means you can use df to view the metered size of your EFS file systems. It's important to note, however, that because the data dfprovides is eventually consistent, you should not rely on it for real-time data.
In addition to viewing the aggregate size of your file system, you may also need to track the sizes of individual objects. Log files, for example, accumulate data over time and can influence your overall storage needs. You can use the du and stat tools to view the size of any single file you've stored in EFS. The command below allows you to see the size of the file myFile located in the file system mounted at /mnt/myFileSystem:
stat /mnt/myFileSystem/myFileAs shown below, stat's output includes additional information beyond the file's size, such as the number of blocks used by the file, its inode, its permissions, and the file's creation and modification history.
File: ‘/mnt/myFileSystem/myFile’ Size: 3048448000 Blocks: 5954000 IO Block: 1048576 regular fileDevice: 26h/38d Inode: 16195615950234888882 Links: 1Access: (0664/-rw-rw-r--) Uid: ( 1000/ec2-user) Gid: ( 1000/ec2-user)Access: 2021-04-27 21:48:50.398000000 +0000Modify: 2021-04-27 21:48:50.398000000 +0000Change: 2021-04-27 21:48:50.398000000 +0000See the AWS documentation for more information about how to view the metered size of both your file system and the individual objects it contains.
See the aggregate size of a file system from a Lambda function
If your EFS client is a Lambda function, you don't have access to a command line, but some Lambda runtimes allow you to include code in your function that can collect storage metrics. For example, Python's standard library includes a shutil package that you can use to check the size of a file system. The following function uses the disk_usage method to check the disk space used by the file system mounted at /mnt/myFileSystem:
import shutil
def lambda_handler(event, context): return { 'output': shutil.disk_usage("/mnt/myFileSystem") }This function returns a JSON object like the one shown below. In our case, it shows that the file system is using slightly less than 3,600 MB of storage space.
{ "output": { "total": 9223372036853727000, "used": 3598712832, "free": 9223372033255014000 }}Measure EFS performance with nfsiostat
To attach your EC2 instance to EFS, AWS recommends that you install the amazon-efs-utils package, which includes an NFS client. This means you can use the nfsiostat utility to view some of the key metrics covered in Part 1 of this series, including throughput (kB/s) and latency (avg RTT). For example, to see metrics from the file system mounted at /mnt/myFileSystem, you can use this command:
nfsiostat /mnt/myFileSystemThe output, shown below, details the client's read and write activity since the file system was mounted or since nfsiostat was last executed.
op/s rpc bklog 2.81 0.00read: ops/s kB/s kB/op retrans avg RTT (ms) avg exe (ms)0.000 0.000 0.000 0 (0.0%) 0.000 0.000write: ops/s kB/s kB/op retrans avg RTT (ms) avg exe (ms)2.266 2284.646 1008.283 0 (0.0%) 129.606 356.155Collect EFS logs
To gain even deeper insight into the performance of your file systems, you can collect logs from your EFS clients. Logs reveal details of each client's activity—such as when a given client mounted an EFS file system and how much data it sent to the mount target—that can be useful when you need to analyze and troubleshoot EFS performance. In this section, we'll show you how you can collect and view EFS logs using AWS services and Linux tools.
AWS logging services
AWS provides logging services that allow you to gather EFS logs from EC2 instances, as well as network logs that show connection activity to your EFS mount targets. You can analyze and alert on these logs using Amazon CloudWatch Logs and query them with CloudWatch Logs Insights.
Mount helper logs
The EFS client software includes a mount helper tool which allows you to collect logs from your EC2 instances and forward them to CloudWatch Logs. To collect logs from an instance, install botocore—the foundation of the AWS SDK for Python—onto the instance, attach the necessary IAM policy to the instance's role, and then install the EFS client software.
Logging is disabled by default, so you need to update the client's configuration file (/etc/amazon/efs/efs-utils.conf) to enable logging and configure the helper to forward logs to CloudWatch Logs. The efs-utils.conf excerpt shown below sets enabled = true in the [cloudwatch-log] section of the configuration file. As a result, this instance will automatically forward its mount helper logs to the CloudWatch Logs group named /aws/my-efs-mount-helper-logs.
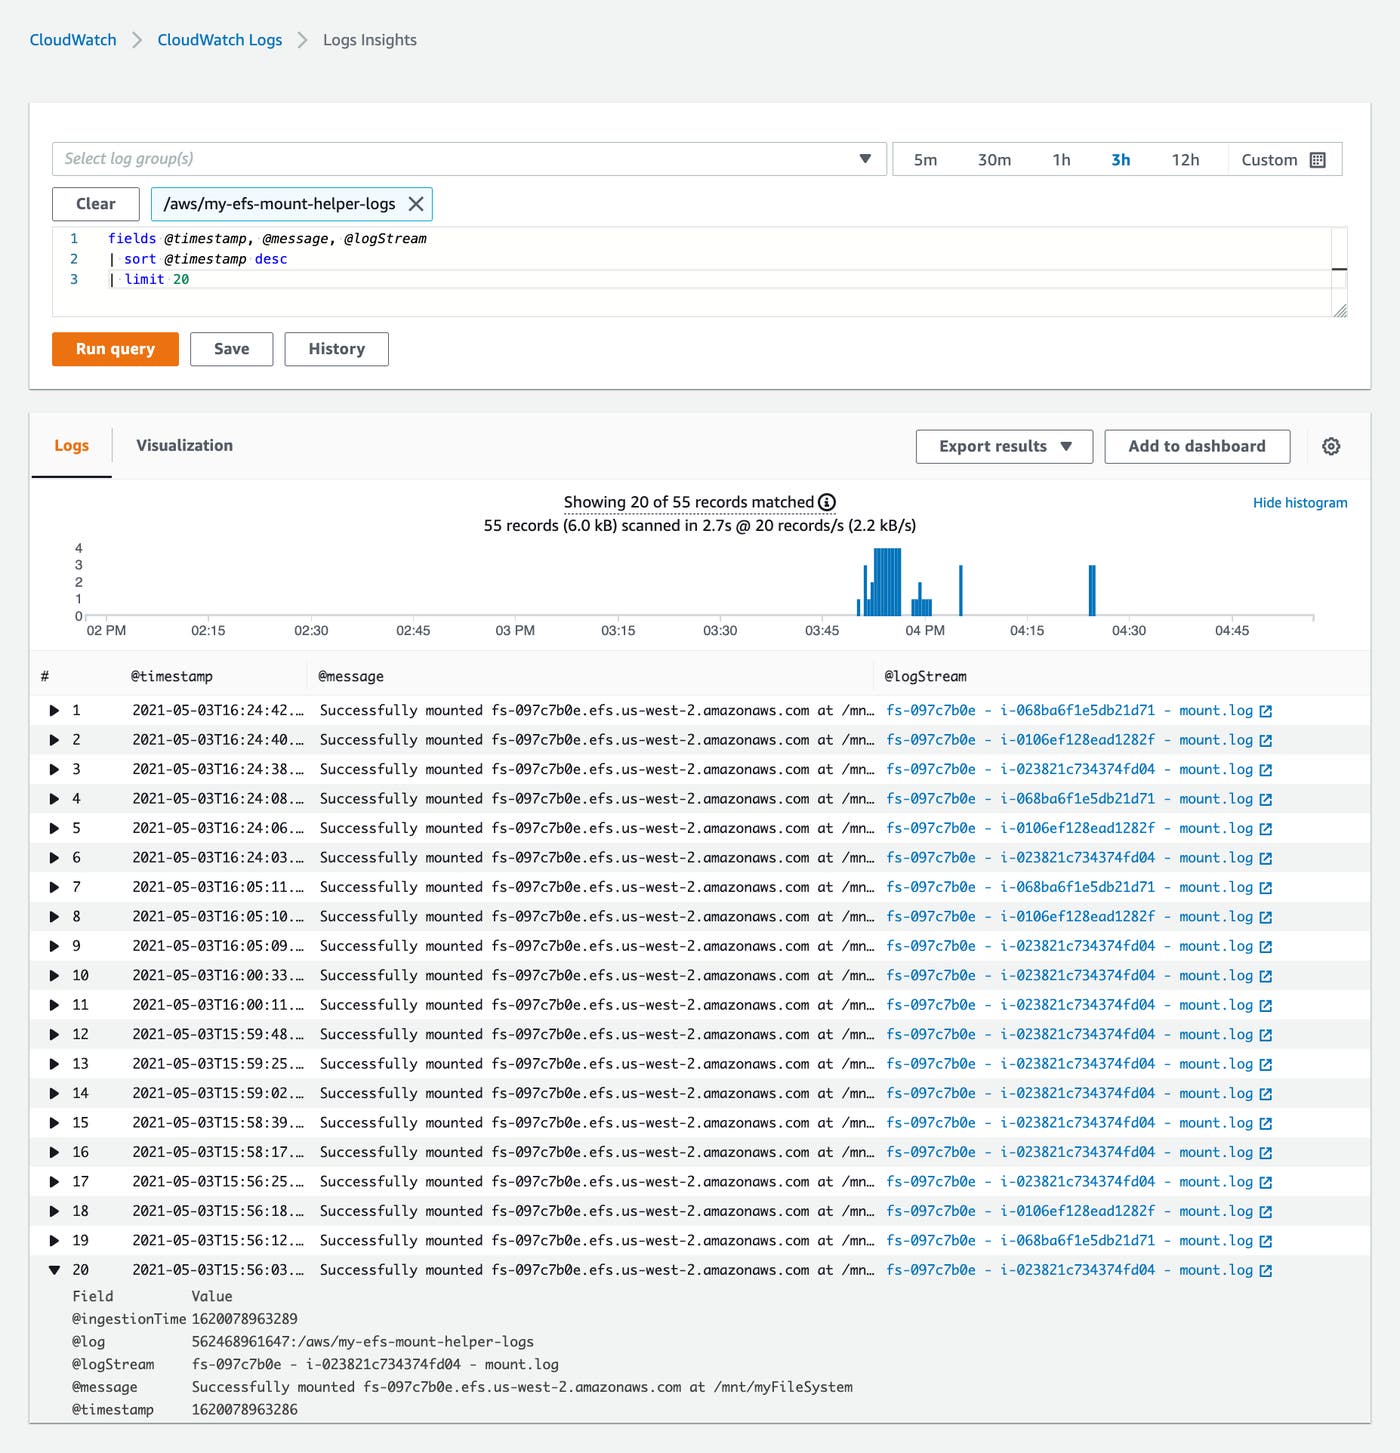
[cloudwatch-log]enabled = truelog_group_name = /aws/my-efs-mount-helper-logsOnce you've aggregated your mount helper logs in CloudWatch Logs, you can explore the status and history of mount activity across all of the EC2 instances that connect to your file system. You can also use CloudWatch Logs Insights to search and filter your logs, which can reveal patterns and trends in EFS performance and client activity. For example, the CloudWatch Logs Insights query in the screenshot below searches the /aws/my-efs-mount-helper-logs logs group and displays the timestamp, message, and log stream identifier fields from the 20 most recent logs across all of the streams in the group. The timeseries graph above the results visualizes the rate at which the logs occur.
VPC Flow Logs
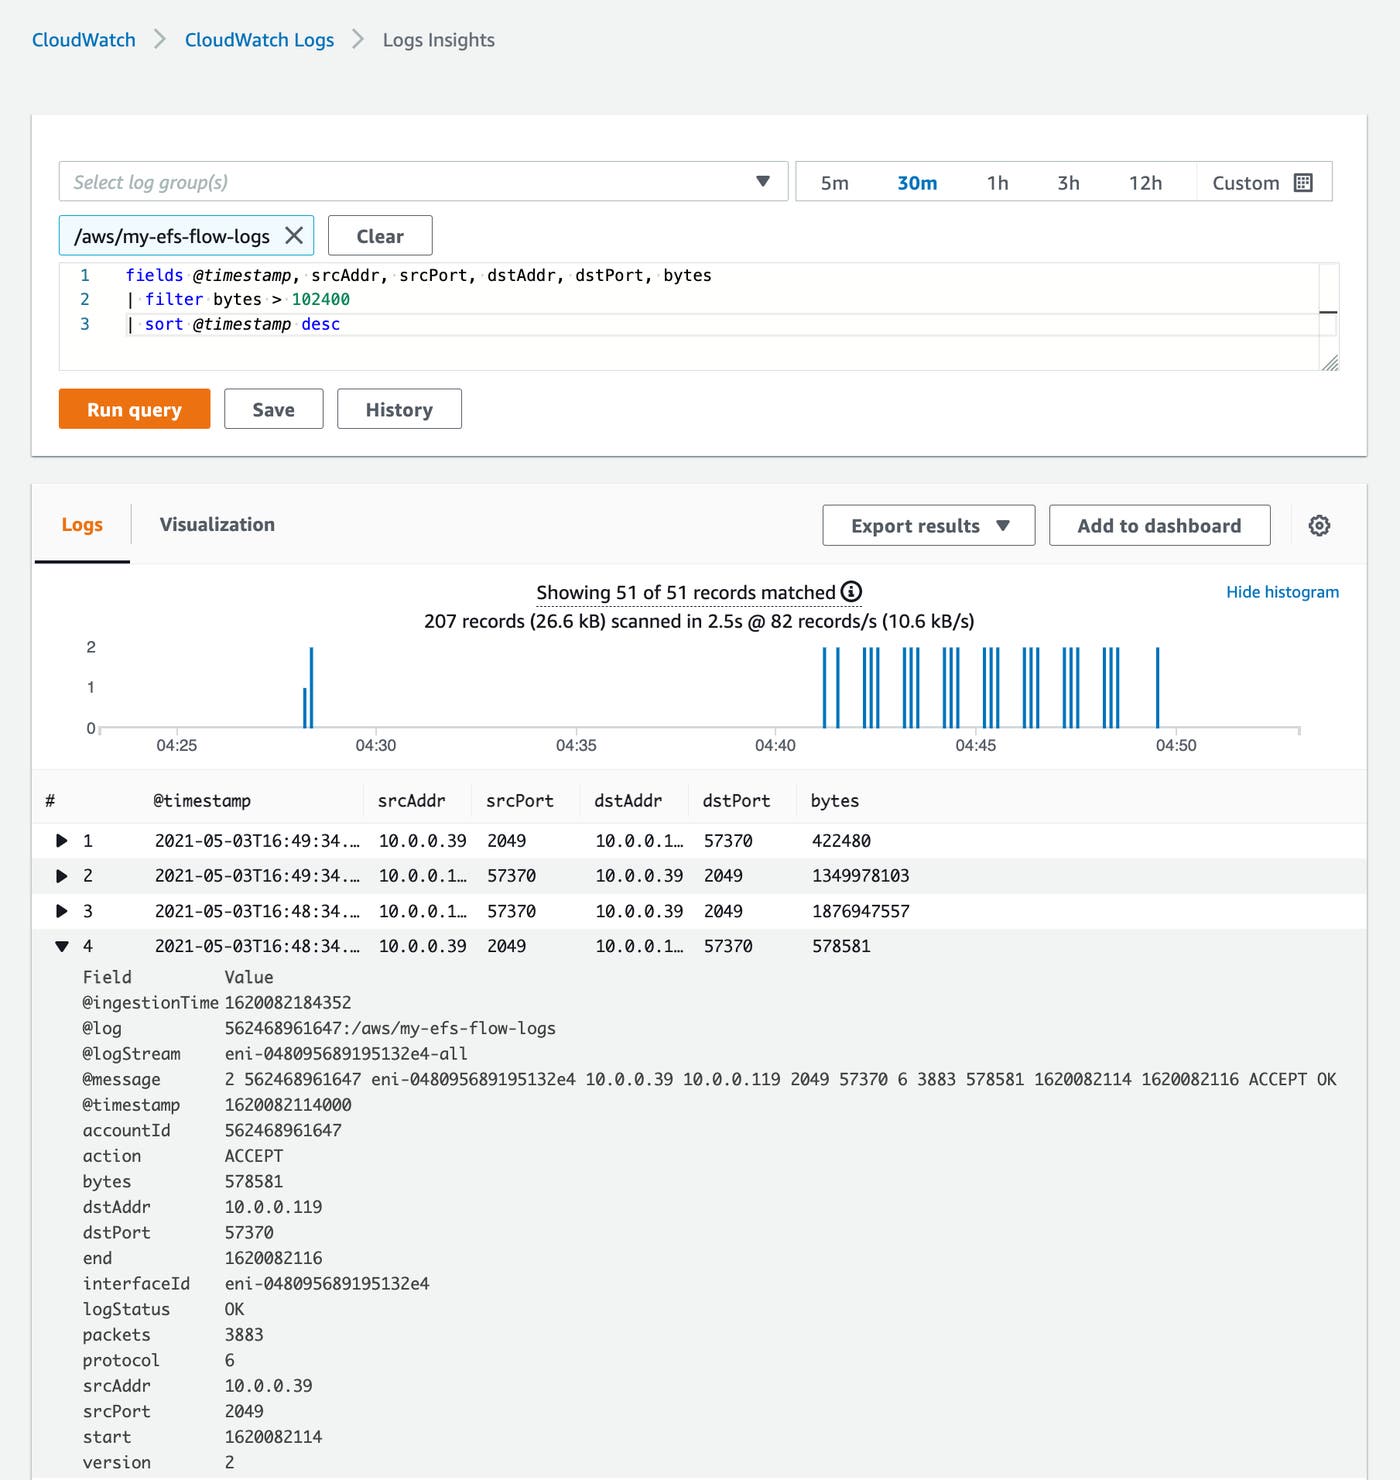
VPC Flow Logs allow you to monitor traffic on the network interfaces your AWS resources use. The clients connected to an EFS file system interact with it by sending requests to port 2049 on the Elastic Network Interface (ENI) of one of its mount targets. By capturing these requests in a flow log, you can aggregate network activity from multiple clients in a single log, which you can then publish to Cloudwatch Logs. This allows you to see, for example, the IP addresses of all the clients that have connected to your file system. You can also filter your results based on the values contained in fields you identify. For example, the screenshot below illustrates a CloudWatch Logs Insights query that finds flow logs showing data transfers greater than 102,400 bytes to and from the file system's mount targets.
See the AWS documentation for more examples about collecting and querying VPC Flow Logs in CloudWatch Logs.
Non-AWS logging tools
If your EFS clients are running on EC2 instances, including EC2-backed EKS or ECS clusters, their log activity can reveal important details about changes within the file systems they mount. In this section, we'll show you Linux utilities you can use to log the activity of clients making changes to the EFS file system. The Linux auditing system provides tools that allow you to monitor your Linux hosts for changes that could indicate security concerns. Linux security is a topic that extends beyond file system monitoring, but you can use these tools to increase your visibility into EFS by logging file creation, deletion, modification, and access. auditd is the process that monitors and logs activity on the host, and auditctl is the program you use to configure auditd. To log changes to your file system, you create rules that tell auditd which directories to monitor and which activities to watch for. When a change takes place in the file system that aligns with a rule you've defined—for example, when a client writes to a file that's being monitored—auditd will create a new log in /var/log/audit/audit.log.
You can then use two complementary utilities—ausearch to filter the log contents and aureport to format the output—to view the contents of audit.log and see the activity on the file system. The command below searches for logs created by the mykeyname rule. It includes the -i flag to interpret the output and the -f flag to return log entries related to file activity.
sudo ausearch -k mykeyname | aureport -f -i
File Report===============================================# date time file syscall success exe auid event===============================================1. 04/16/2021 16:50:27 /mnt/myFileSystem/myFile openat yes /usr/bin/bash ec2-user 1242. 04/16/2021 16:50:43 /mnt/myFileSystem/myOtherFile openat yes /usr/bin/bash ec2-user 125You can also use the rpcdebug tool to log an instance's interactions with an EFS file system, which includes creating, modifying, reading, and executing files. For example, if your application creates and writes to a file named myNewFile in the root directory of an EFS file system, rpcdebug will add the following messages to the instance's system log:
Apr 5 22:17:06 ip-172-31-46-92 kernel: NFS: open file(/myNewFile)Apr 5 22:17:06 ip-172-31-46-92 kernel: NFS: flush(/myNewFile)Apr 5 22:17:06 ip-172-31-46-92 kernel: NFS: fsync file(/myNewFile) datasync 0Apr 5 22:17:06 ip-172-31-46-92 kernel: NFS: write(/myNewFile, 5@0)Apr 5 22:17:06 ip-172-31-46-92 kernel: NFS: flush(/myNewFile)Apr 5 22:17:06 ip-172-31-46-92 kernel: NFS: fsync file(/myNewFile) datasync 0Apr 5 22:17:06 ip-172-31-46-92 kernel: NFS: release(/myNewFile)Apr 5 22:18:31 ip-172-31-46-92 dhclient[2818]: XMT: Solicit on eth0, interval 121000ms.Monitor EFS and your whole stack
In this post, we've looked at how you can collect and alert on EFS metrics and logs using AWS and Linux tools. In Part 3 of this series, we'll show you how Datadog enables you to visualize and analyze this data alongside telemetry from more than 1,000 other technologies, so you can gain full visibility into your EFS file systems and the applications they support.
Acknowledgments
We'd like to thank Ray Zaman at AWS for their technical review of this post.
