Network Traffic Visualization | Datadog

Network Traffic Visualization

Visualize network traffic from a birds-eye view across on-premise, cloud-based, and containerized environments.

Visualizing network traffic across your whole environment is often difficult, tedious and sometimes impossible. With Datadog’s Network Map, you gain a bird’s-eye view of your network to help you visualize network partitions, dependencies, and bottlenecks across all your infrastructure or services.


Track hybrid environment network traffic

Unify Network views across on-prem and cloud environments.
  • Visualize network traffic from various sources, including on-prem servers, VMs, containers and serverless functions
  • Monitor how much traffic is traveling between on-prem datacenters and cloud availability zones in a single view
  • Pinpoint and analyze traffic flowing across availability zones to help reduce cloud network costs

Kubernetes traffic flow, simplified

Proactively map cluster and pod dependencies.
  • Identify cross-pod communication and troubleshoot inefficient load balancing to improve cluster performance by grouping by pod name
  • View dependencies by drilling into a specific pod or service to find and monitor potential misconfigurations
  • Visualize Kubernetes network traffic by deployment to aggregate data across replicas and gain a holistic view of performance

Correlate network traffic visualizations with application performance

Use a single pane of glass to connect network and application teams.
  • Visualize service bandwidth usage and latency to determine whether slowness is due to network traffic or the underlying code
  • Pivot directly from a service into related traces for seamless analysis and troubleshooting
  • Break down communication silos between your network and development teams and increase collaboration

The Essential Monitoring and Security Platform for the Cloud Age

Datadog brings together end-to-end traces, metrics, and logs to make your applications, infrastructure, and third-party services entirely observable.

platform_diagram_lpg

Next-Generation Network Monitoring

Monitor your environment and its network dependencies in real time.
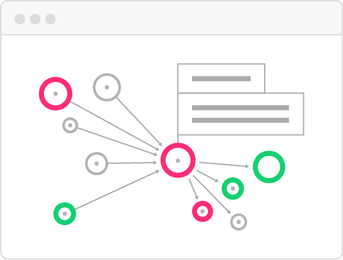
servicemap-apm-illustration.png

Live Network Map

Visualize all dependencies in one place with the live network map.

hostmap-infra-illustration.png

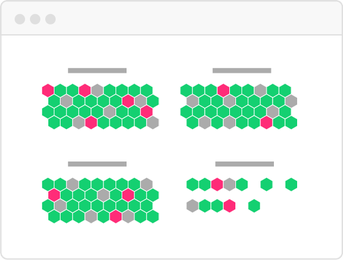
Host and Container Maps

Visualize the status of your hosts or containers in a single view.

synchronized-dashboards-infra-illustration.png

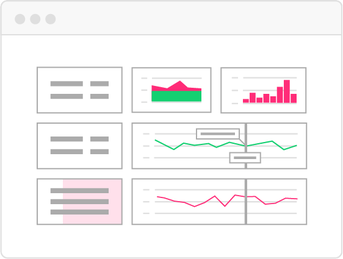
Synchronized Dashboards

Track incidents across metrics with a common tagging structure.

Loved & Trusted by Thousands

Washington Post logo 21st Century Fox Home Entertainment logo Peloton logo Samsung logo Comcast logo Nginx logo