Network Traffic Visualization | Datadog

Network Traffic Visualization

Visualize network traffic from a birds-eye view across on-premise, cloud-based, and containerized environments.

Visualizing network traffic across your whole environment is often difficult, tedious and sometimes impossible. With Datadog’s Network Map, you gain a bird’s-eye view of your network to help you visualize network partitions, dependencies, and bottlenecks across all your infrastructure or services.


Next-Generation Network Monitoring

Monitor your environment and its network dependencies in real time.
servicemap-apm-illustration.png

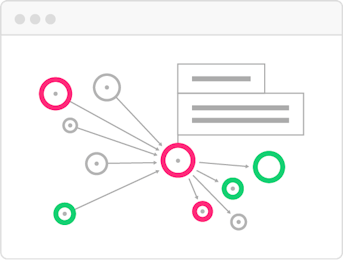
Live Network Map

Visualize all dependencies in one place with the live network map.
hostmap-infra-illustration.png

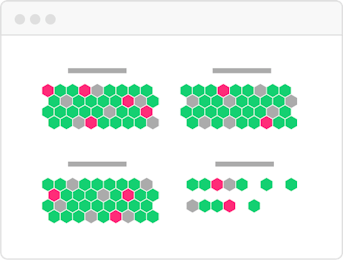
Host and Container Maps

Visualize the status of your hosts or containers in a single view.
synchronized-dashboards-infra-illustration.png

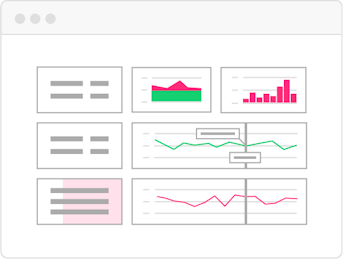
Synchronized Dashboards

Track incidents across metrics with a common tagging structure.

多くの企業で愛用され信頼を得ています

Samsung logo Ubisoft logo Deloitte Cloud logo Cybozuinc logo sansan logo Nginx logo Chef logo Nasdaq logo DreamWorks Animation logo Nikon logo Zynga logo Evernote logo Sonos logo Monotaroco logo