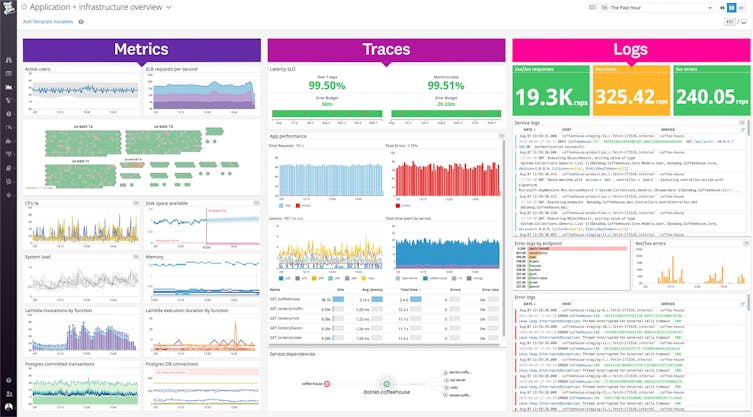
Microservice Visualization | Datadog

Microservice Visualization

Visualize microservices at scale and analyze application performance with Datadog

It is critical to visualize microservices and their dependencies across your entire environment as you modernize your architecture and move workloads to the cloud. Datadog’s unified platform allows you to visualize your stack using a single pane of glass, reducing blind spots and speeding up troubleshooting.


Explore dynamic microservice visualizations

  • Filter and group a view of your entire containerized environment with the Container Map and automatically enroll new containers using Autodiscovery
  • Proactively map service dependencies and set alerts to identify disruptions to your microservices with the Service Map
  • Identify poorly performing containers and pods and visualize microservice network inefficiencies with Network Performance Monitoring
Visualize microservice environments with the Container Map

Monitor and visualize microservices in real time

  • Gain a real-time overview of your container health, resource consumption, logs, and deployments with the Live Container View
  • Explore active processes by filtering and grouping them using tags and drill down into granular process-level metrics with the Live Process View
  • Enhance microservice visualizations by viewing them alongside full stack data in easily configured and time-correlated dashboards
Track and visualize live container views and microservice metrics

Optimize microservices with full stack data

  • Explore and analyze traces from distributed microservices architectures at the span or code level with Datadog APM
  • Search and filter logs using facets and leverage tags to pivot to relevant log events directly from your microservice visualizations
  • Evaluate user experience and journeys by correlating microservices data with frontend metrics, API checks, and browser tests
Visualize microservices alongside metrics, traces, logs

700+ Turn-Key Integrations, Including

The Essential Monitoring and Security Platform for the Cloud Age

Datadog brings together end-to-end traces, metrics, and logs to make your applications, infrastructure, and third-party services entirely observable.

platform_diagram_lpg

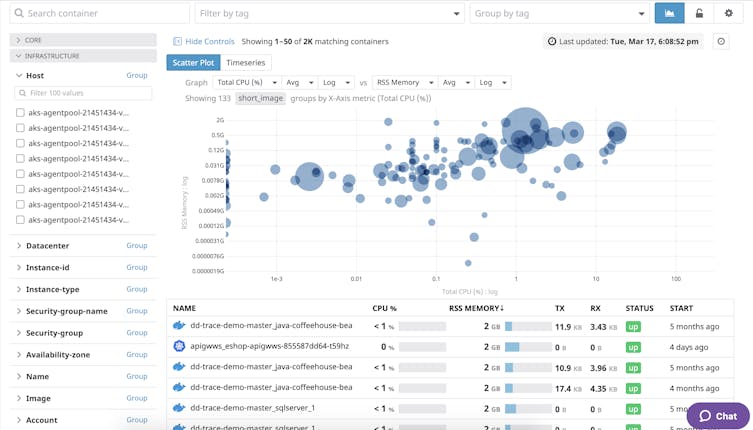
Visualize dynamic microservices in real time

Analyze your infrastructure and services from a bird’s eye view.

hostmap-infra-illustration.png

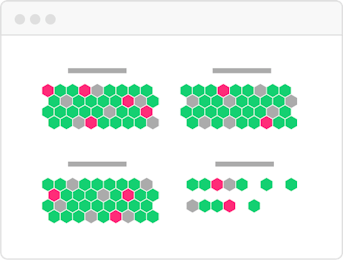
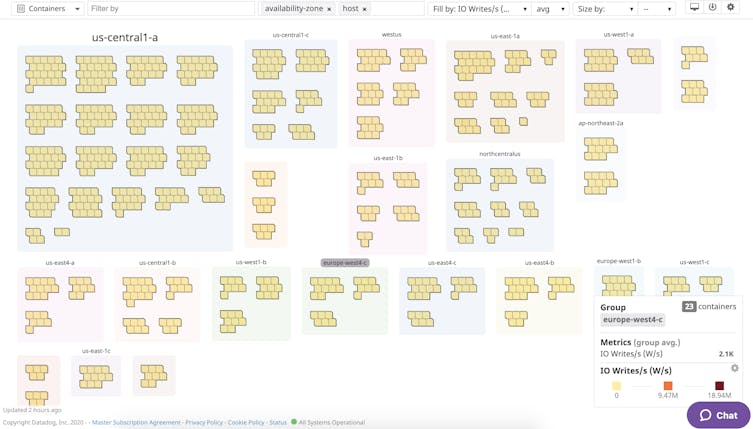
Host and Container Maps

Visualize the status of your servers or containers in a single view.

synchronized-dashboards-infra-illustration.png

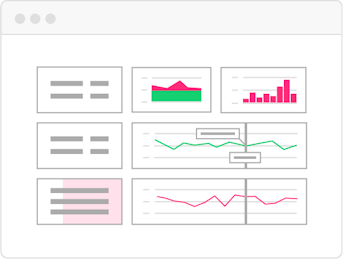
Synchronized Dashboards

Track incidents across metrics with a common tagging structure.
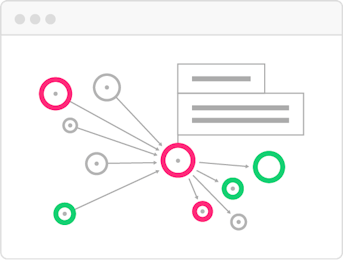
servicemap-apm-illustration.png

Service Map

Map application data flows and dependencies in real-time.

Loved & Trusted by Thousands

Washington Post logo 21st Century Fox Home Entertainment logo Peloton logo Samsung logo Comcast logo Nginx logo

Microservice Visualization Resources

Use these resources to learn microservice visualization best practices.

Microservices Monitoring with Datadog

Microservices and Container Research