Java Flamegraph | Datadog

Optimize applications with Java flamegraphs

Use Java flamegraphs to identify and troubleshoot bottlenecks in your services and code

Flamegraphs cut through the complexity introduced by applications built using microservices and different programming languages. Java flamegraphs help visualize service dependencies, span durations, as well as stack traces, to pinpoint the slowest requests and the most resource-consuming parts of your Java code. Use flamegraph to troubleshoot bottlenecks, optimize Java applications, improve user experience, and save on cloud costs with Datadog.


Optimize Java methods and classes using flamegraphs

Easily identify and address the most resource-consuming parts of your code.
  • Avoid unexpected latency or downtime by monitoring the impact of recent Java code deployments on resource consumption
  • Save on cloud hosting costs by optimizing methods that are spending a long time on CPU or allocating memory inefficiently
  • Enhance user experience by addressing the problematic leaf nodes on Java flamegraphs across different types of code profiles
Optimize Java methods and classes using flamegraphs

Reduce service latency and errors with Java flamegraphs

Reduce service latency and errors with Java flamegraphs.
  • Quickly detect the services causing latency and errors for your users
  • Pinpoint error traces down to the service level and rapidly fix problems that directly impact user experience by analyzing Java flamegraph
  • Reduce your mean time to resolution (MTTR) by quickly pinpointing the slowest services in a Java flamegraph or correlating an error span and the related logs with one click
Reduce service latency and errors with Java flamegraphs

Seamless correlations for full stack observability

Put Java flamegraphs in context with the rest of your environment.
  • Correlate service performance metrics, logs, processes, and code profiles directly from the Java flamegraph view
  • Drill down from a spike in latency to a single customer’s request flamegraph or investigate a spike in cpu utilization down to a particular line of Java code
  • Gain org-wide adoption with a simple, intuitive UI that allows both inexperienced and seasoned engineers to easily make sense of Java flamegraphs
Seamless correlations for full stack observability

The Essential Monitoring and Security Platform for the Cloud Age

Datadog brings together end-to-end traces, metrics, and logs to make your applications, infrastructure, and third-party services entirely observable.

platform_diagram_lpg

Next-Generation Application Performance Monitoring

Leverage Datadog APM to monitor and troubleshoot Java performance issues.

watchdog-apm-illustration.png

Watchdog

Auto-detect and surface performance problems without manual Java alert configuration.
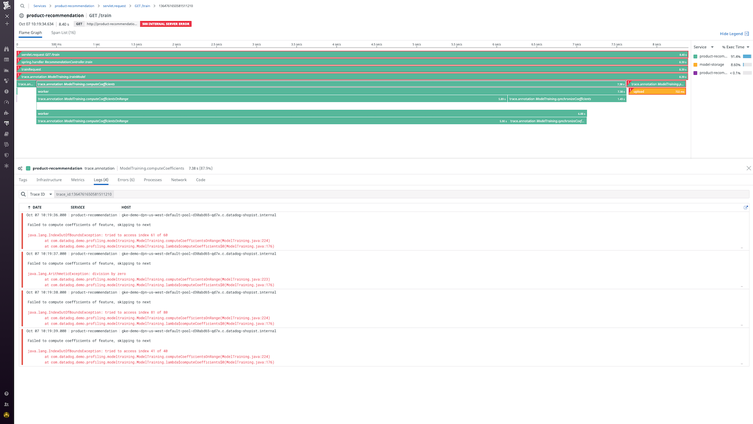
tracesearch-apm-illustrationv2.png

App Analytics

Search, filter, and analyze Java stack traces at infinite cardinality.
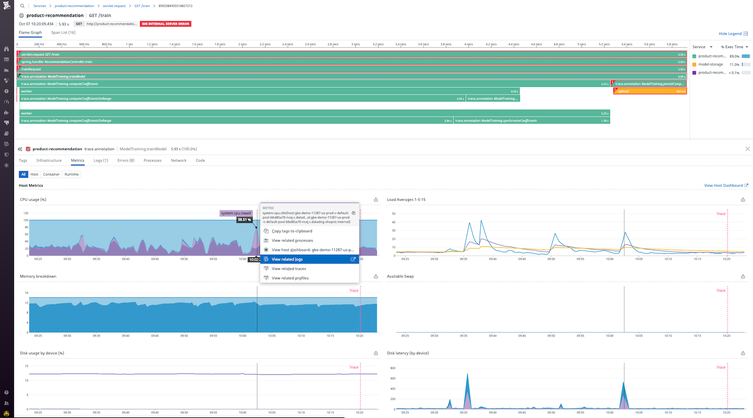
servicemap-apm-illustration.png

Root Cause Analysis

Full stack correlation from synthetic tests to metrics, traces, and logs.
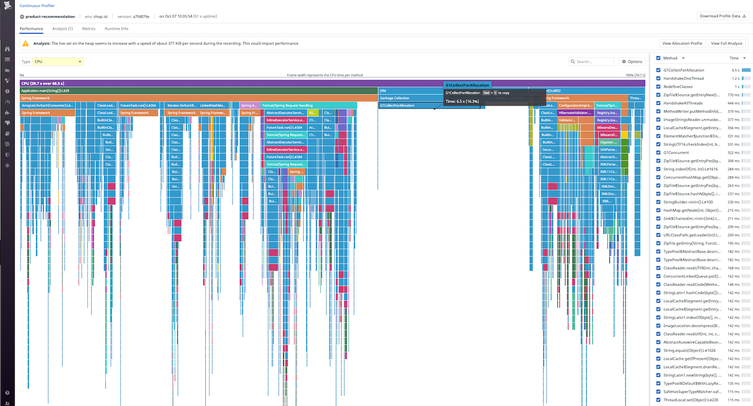
Loved & Trusted by Thousands

Washington Post logo 21st Century Fox Home Entertainment logo Peloton logo Samsung logo Comcast logo Nginx logo