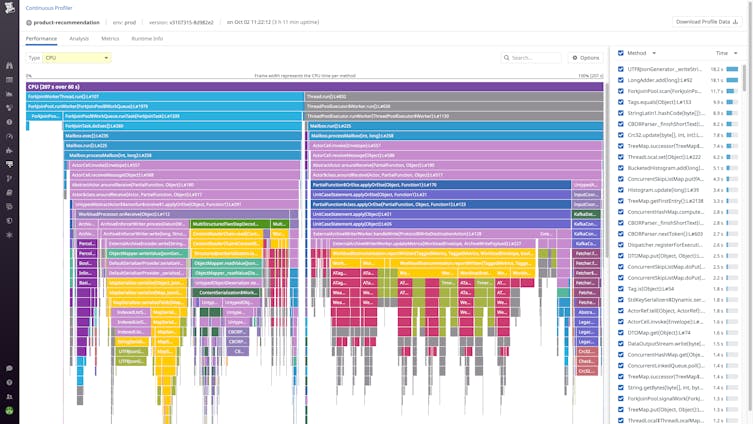
Code Profiling Tools | Datadog

Code Profiling Tools

Detect, analyze, and optimize slow and resource-consuming methods and classes in your production code with Datadog’s cutting edge code profiling tools.

Code profiling tools allow you to analyze the performance of your code by measuring the time it takes your methods to run and the amount of CPU and memory they consume. Datadog code profiling tools allow you to continuously profile your code in any environment, including production, with no impact to your application performance.


Discover and optimize bottlenecks in your code

Detect high resource-consuming methods and optimize application performance with code profiling tools.
  • Visualize code profiles with the Datadog flamegraph to understand how your methods, classes, and packages are performing
  • Gain visibility into CPU and memory consumption, as well as time spent on locks, I/O, and garbage collection, down to the line of code
  • Reduce latency, improve end-user experience, and save on cloud provider costs by optimizing your slowest and resource-heavy lines of code
Discover and optimize bottlenecks in your code

Always on, production level code profiling tools

Profile your code at any scale with the Datadog Continuous Profiler.
  • Reduce MTTR by pinpointing production code issues that are invisible to other tools and hard to replicate in other environments
  • Explore multiple profile types—CPU, memory, lock, I/O, and more—to determine the root cause of code issues
  • Derive actionable code profiling insights from an automated heuristic analysis of the main problem areas in your code
Always on, production level code profiling tools

Correlate code profiles with all other telemetry

Leverage code profiling tools that are not siloed from your monitoring solutions to find the root cause faster.
  • Tie every slow distributed trace to the methods and threads that executed the request
  • Quickly detect and resolve anomalous spikes in infrastructure metrics caused by inefficiencies in your code
  • Compare code behavior and impact across hosts, services, and versions during code deployments
Correlate code profiles with all other telemetry

The Essential Monitoring and Security Platform for the Cloud Age

Datadog brings together end-to-end traces, metrics, and logs to make your applications, infrastructure, and third-party services entirely observable.

platform_diagram_lpg

Modern APM and Code Profiling Tools

Proactively track and troubleshoot application performance.
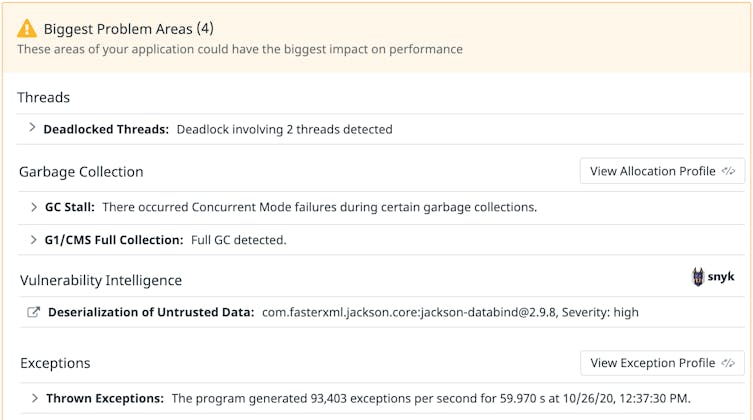
watchdog-apm-illustration.png

Watchdog

Auto-detect and surface performance problems without manual alert configuration.

tracesearch-apm-illustrationv2.png

App Analytics

Search, filter, and analyze stack traces at infinite cardinality.
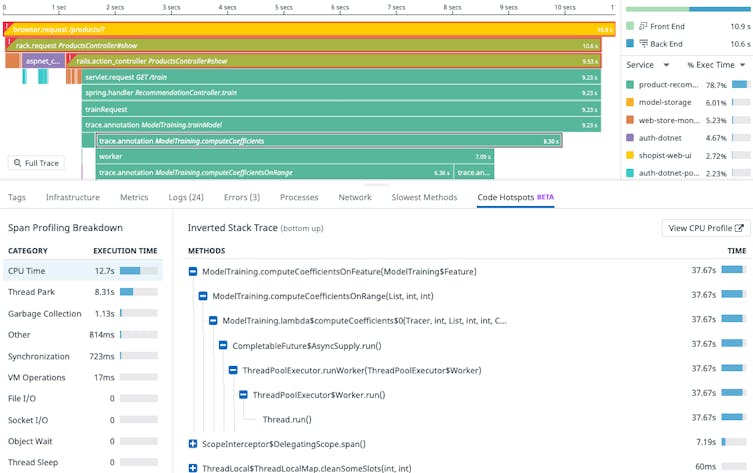
servicemap-apm-illustration.png

Root Cause Analysis

Full stack correlation from synthetic tests to metrics, traces, and logs.

Code Profiling Resources

Learn about Datadog code profiling tools.

Datadog Continous Profiler Starter Kit

Loved & Trusted by Thousands

Washington Post logo 21st Century Fox Home Entertainment logo Peloton logo Samsung logo Comcast logo Nginx logo