
Code Profiling Tools | Datadog

Code Profiling Tools

Detect, analyze, and optimize slow and resource-consuming methods and classes in your production code with Datadog’s cutting edge code profiling tools.

Code profiling tools allow you to analyze the performance of your code by measuring the time it takes your methods to run and the amount of CPU and memory they consume. Datadog code profiling tools allow you to continuously profile your code in any environment, including production, with no impact to your application performance.


Datadogを始める5つのステップ

ステップ1
トライアル登録フォームに入力 わずか30秒で無料でアカウントを作成。クレジットカードは不要
ステップ2
技術スタックに関する基本的な質問に回答 約1分で完了
ステップ3
Datadog エージェントをインストール システムレベルのメトリクスをDatadogプラットフォームに送信
ステップ4
API経由で追加のメトリクスを取得するための認証情報を提供 AWS、Azure、GCPなどのクラウド環境を完全に可視化
ステップ5
すぐに使えるダッシュボードでパフォーマンスを視覚化 環境全体のパフォーマンスをリアルタイムで確認可能

Modern APM and Code Profiling Tools

Proactively track and troubleshoot application performance.
watchdog-apm-illustration.png

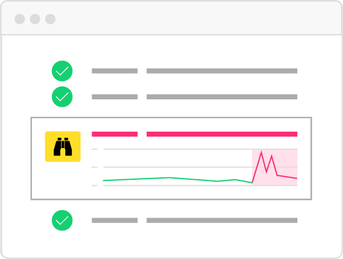
Watchdog

Auto-detect and surface performance problems without manual alert configuration.
tracesearch-apm-illustrationv2.png

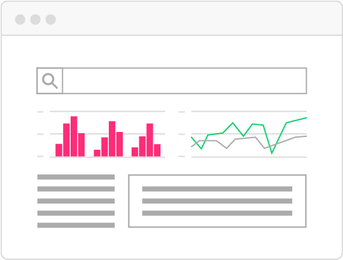
App Analytics

Search, filter, and analyze stack traces at infinite cardinality.
servicemap-apm-illustration.png

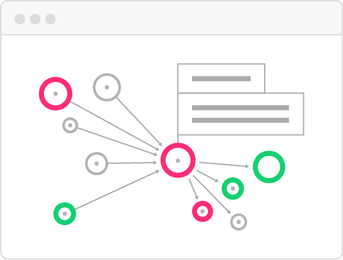
Root Cause Analysis

Full stack correlation from synthetic tests to metrics, traces, and logs.

Code Profiling Resources

Learn about Datadog code profiling tools.

Datadog Continous Profiler Starter Kit

Datadog プラットフォームは数多くのお客様に選ばれ、信頼されています

Samsung logo
Ubisoft logo
Deloitte Cloud logo
Cybozuinc logo
sansan logo
Nginx logo
Chef logo
Nasdaq logo
DreamWorks Animation logo
Nikon logo
Zynga logo
Evernote logo
Sonos logo
Monotaroco logo