

This is an updated blog version of Alexis Lê-Quôc’s original ebook, which can be found here.
For many IT users and developers, using Amazon Web Service’s (AWS) Elastic Compute Cloud (EC2) to host their application introduces multiple changes to software development, deployment, and maintenance processes. EC2 promises increased flexibility, ease of deployment, instant scalability, and a vast ecosystem of third party services.
However, EC2 functions differently from the traditional on-premise servers system administrators and developers have previously used. These differences can lead to novel performance issues that require different tools to gain visibility into an application and its underlying cloud-based infrastructure. In this article, you will learn about the five most common performance issues that occur in EC2, as well as how to detect and resolve them.
Find and fix EC2 performance issues in real time with Datadog.
1. Unpredictable EBS Disk I/O
Elastic Block Storage (EBS) is a storage service offered by AWS that is backed by network-connected block storage. EBS is critical for traditional database systems because it offers a combination of large storage capacity and reasonable throughput and latency. EBS volumes come in two flavors: Standard and Provisioned IOPS.
IOPS stands for input/output operations per second. A careful read of the EBS documentation indicates these IOPS are to be understood as applying to blocks that are up to 16KB in size.
Standard EBS volumes can deliver 100 IOPS on average (on blocks of 16KB or less). 100 IOPS is roughly what a single desktop-class 7200rpm SATA hard drive can deliver.
Provisioned IOPS volumes can deliver up to 4,000 IOPS per volume if you have purchased that throughput. You can expect that 99.9% of the time in a given year the volume will deliver between 90% and 100% of its provisioned IOPS, but only after a number of conditions have been met:
- You use a compatible instance.
- Your application sends enough requests to the volume as measured by the average queue length (i.e. the number of pending operations) of that volume.
- The read and write operations apply to blocks of 16KB or less. If your block size is 64KB, you should expect ¼ of the provisioned IOPS.
- The blocks on the volume have been accessed at least once.
- No volume snapshot is pending.
These extensive conditions are expected from a networked storage service, but are nonetheless fairly restrictive.
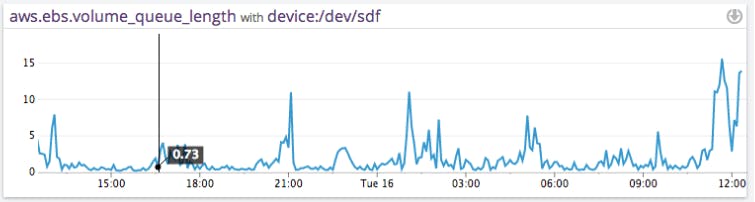
When I/O on EBS volumes increase until their rate reaches the IOPS ceiling for that volume, I/O operations will queue up and the Volume Queue Length will markedly grow. This delay is directly visible by the operating system via various I/O related metrics (e.g.percentage of CPU spent in “I/O wait”). At that point your application is likely to go only as fast as the EBS volumes go. Here is an example of the VolumeQueueLength for a standard EBS volume over 24 hours.
In the worst-case scenario, your EBS performance can grind to a halt, if a widespread outage of an entire EBS node occurs. While these massive outages are infrequent, they have occurred twice before the time of this writing.
Why It Occurs
Two fundamental reasons:
- Standard EBS volumes are slow
- The actual storage devices and storage network are shared
The first reason is easy to tackle. Once you know to expect 100 IOPS from standard EBS volumes, you can devise strategies to support your application. Common strategies include: using RAID to pool together EBS volumes, getting Provisioned IOPS volumes or skipping EBS altogether in favor of solid-state drives (SSD).
The sharing of hardware for EBS is much more a design constraint. Because EBS data traffic must use the network, it will always be slower (as measured by its latency) than local storage, by an order of magnitude.
Moreover, the network that exists between your instances and your EBS volumes is shared with other customers. AWS has started to add in dedicated network connections for storage to make EBS latency more predictable, it is not the norm as of the time of this writing.
On a dedicated storage system, by and large, latency and IOPS are strongly correlated. As you dial up the number of IOPS, latency is going to increase slowly until you saturate the storage bus or the drives themselves. At the point of saturation, pushing more IOPS simply creates a backlog ahead of the storage system (usually at the operating system layer).
On a shared storage system, the picture is a lot less clear as the behavior of other users of the system will have a direct impact on the latency you experience. To show this,let us look at an example of latency observed on an EBS volume compared to the number of IOPS.
- The first graph measures the time it takes, in milliseconds, for requests to be serviced by the EBS volume, as measured by the operating system of the instance.
- The second graph measures the Volume Queue Length of that same EBS volume.
- The third graph measures the number of IOPS performed on that same EBS volume, again measured by the operating system of the instance.
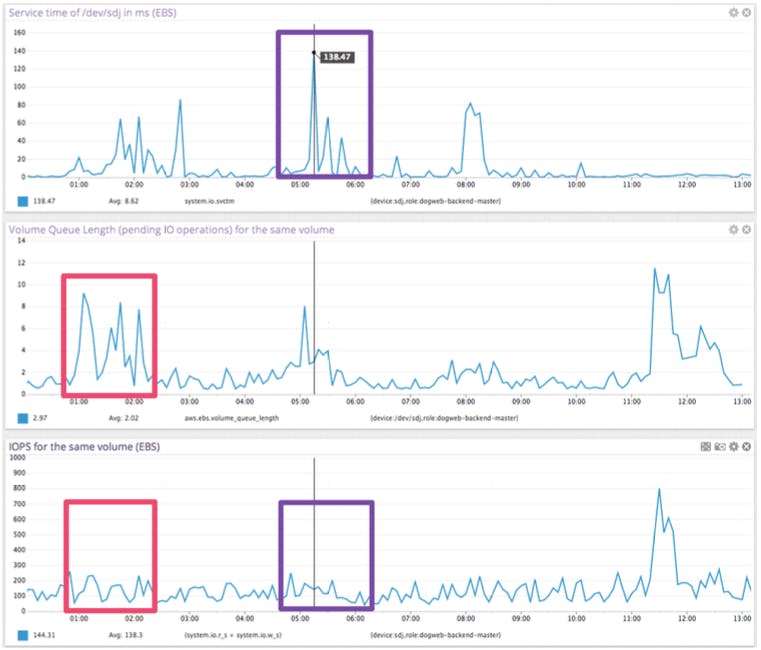
Notice the weak correlation between IOPS (third graph) and the observed service time in milliseconds for the same EBS device (first graph), highlighted in purple.
Notice also the lack of strong correlation between the pending EBS requests (second graph) and the IOPS (third graph), highlighted in bright red. The interesting pattern happens on the left of the graph, where IOPS stay roughly around 150, while the Volume Queue Length varies widely.
If IOPS were a great predictor of EBS performance you would expect to have a clear correlation between IOPS and Volume Queue Length, independent of other factors. The second and third graph show this is clearly not the case.
Even if your EC2 instances were using dedicated network connections (known as “provisioned IOPs volumes” in AWS parlance), the physical disks behind EBS may still be shared with other AWS customers, whose workloads may end up consuming a fair share of disk bandwidth when you need it the most. Due to AWS’ opacity, there is simply no way to know how much bandwidth (disk or otherwise) to expect for a given EBS volume. Provisioned IOPS only offer a partial solution to this issue and at a high financial cost.
How to Detect this Issue
AWS CloudWatch tracks the I/O latency per EBS volume with the metric VolumeQueueLength as the number of I/O requests that are pending at a given time. By comparing this metric for each EBS volume attached to a slow application you can narrow down the cause of the slowness to an EBS issue.
A sustained increase of VolumeQueueLength above one on a standard EBS volume should be treated as exhausting the throughput of that EBS volume.
A sustained increase of the same metric way above the number of provisioned IOPS divided by 100 should be treated as exhausting the throughput of that EBS volume.
For more significant issues related to hardware or misconfiguration, AWS will release a note on their RSS feed or AWS User Console if AWS system engineers note an issue and are able (and authorized) to report it.
Problem Avoidance and Resolutions
- Selecting the Right Storage and Instance Types – Understanding the data I/O needs that an application will put on the storage attached to an EC2 instance is crucial to understand the right EBS storage types. While this will not insulate from multi-tenant “noisy neighbor” issues or network constraints that can occur from other sources, it will limit I/O mismatches that would essentially be caused from misconfiguration.
- Prime your EBS volumes - The first access to any block on EBS will be done at a 50% throughput in IOPS so you should make sure that all blocks have been accessed once if you want optimal performance from the start. On linux one command you can run once the EBS volume (attached here as sdf) has been formatted is: sudo dd if=/dev/sdf of=/dev/null bs=16384
- Use Instance Store instead of EBS – To get more predictable I/O performance, use Instance Store (HD or SSD). Instance Store is another EC2 storage option where the hard disk space utilized is housed on the server. Instance Store is less flexible in that disk capacity cannot be adjusted and also introduces other management considerations. For example, if the server with instance store dies, the data on that storage will be lost if it has not been backed up. However, gaining dedicated storage through Instance Store will ensure that applications will suffer much less from multi-tenancy issues, and that storage performance will become more predictable. Note: newer EC2 instances(them3 family) no longer offer Instance Store.
- Purchase Provisioned IOPS – Packages guaranteeing a certain level of IOPS availability are costly, but available from AWS. This will ensure that your application’s Disk I/O is being transmitted in networks with enough IOPS capacity. There is a shortage of Provisioned IOPS packages available for purchase at the time of this writing, as like Reserved Instances, there is a restricted amount of Provisioned IOPS that AWS will sell. AWS must increase their hardware capacity based on reservation and demand to be able to offer more.
- Replace a degraded EBS Volume – If you assemble your EBS volumes using RAID 1, 5, 6, or 10, you can decommission and replace the problematic EBS volume without disruption, albeit with degraded performance. If you don’t use RAID but you have been snapshotting frequently enough, you can copy data over from a snapshot. The copy-over will have an impact however, as it will take up more bandwidth and increase storage latency. A judgment call must be made to determine when it is better to copy over rather than wait out an EBS network I/O issue. While snapshotting at the moment an EBS disk I/O issues occurring would technically be an option, the additional data volume to take a snapshot may exacerbate the problem.
- Wait for EBS Latency to Drop Back to Normal Levels – If another AWS customer or separate system is creating large amounts of network traffic, it is likely that those incidents will at some point stop, or that other customers sharing the underlying storage may move elsewhere. At some point, the EBS network volumes will likely drop back to normal rates.

2. EC2 Instance ECU Mismatch and Stolen CPU
What is an ECU?
While AWS has a large number of physical servers under management it does not rent them per se, rather only access to these servers in the form of virtual machines is available. The types of virtual machines are limited to a small list so as to make choosing an instance relatively easy. Somehow a virtual machine type, e.g. m1.large, can run on very different underlying hardware platforms and yet yield roughly the same performance in terms of compute.
To standardize compute, AWS has created a logical computation unit known as an Elastic Compute Unit (ECU). ECUs equate to a certain amount of computing cycles in a way that is independent of the actual hardware – one ECU is defined as the compute power of a 1.0-1.2Ghz of a 2007 server CPU. As an example, the most common and oldest instance type, m1.large, is rated at four ECUs (two cores of two ECUs each). A beefier instance with 64GB of memory, m2.4xlarge, suitable for most databases, is rated at 26 ECUs (eight cores of 3.25 ECUs each). The relative performance tracks fairly closely benchmarking results. The newer high compute instance, (e.g. cc2.8xlarge is rated at 88 ECUs which equals32 virtual cores of 2.75 ECUs each).
| Instance type | Physical CPU (core count) | PassMark per core | Cores per instance | ECUs per instance | ECU per core |
|---|---|---|---|---|---|
| m1.large | Intel E5507 (4) | 812 | 2 | 4 | 2 |
| m2.4xlarge | Intel X5550 (8) | 663 | 8 | 26 | 3.25 |
| cc2.8xlarge | Intel E5-2670 (16) | 832 | 32 | 88 | 2.75 |
Table 1 - CPU model and ECUs per instance type
The main conclusion to draw from this table is that on larger instances you are much more likely to run by yourself or with very few neighbors. The cc2.8x large offers 32 cores, which is the total number of threads available on a server with two Intel E5-2670 CPUs (which is what Intel recommends at most). Conversely, one Intel 5507 CPU with its 4 cores can host at a bare minimum two instances. This makes the probability of having neighbors on the same physical hardware higher. There is a difference in underlying physical processor quality based on which EC2 Instance type is purchased to host an application, and the ECUs reflect that only partially. For instance the newer models have more on-die cache (20MB for the E5- 2670, 8MB for the X5550, 4MB for the E5507), which helps compute-intensive applications.
Not all ECU are priced equally. The more powerful instances are priced per ECU at roughly 50% of the less powerful instances.
| Instance type | ECUs per instance | Cost per instance-hour | Cost per ECU-hour |
|---|---|---|---|
| m1.large | 4 | $0.24 | $0.06 |
| m2.4xlarge | 26 | $1.64 | $.06 |
| cc2.8xlarge | 88 | $2.40 | $0.03 |
Table 2 - Cost per ECU
These differences can have a noticeable impact on how fast your application will run and how much it will cost per hour. We have also shown that:
- Not all instance types have the same number of neighbors.
- Not all instance types are priced the same per ECU.
Hence by choosing the right instance type you can significantly speed up your application and lower your marginal costs.
What is “stolen” CPU?
Stolen CPU is a metric that’s often looked at but can be hard to understand. In short, it is a relative measure of the cycles a CPU should have been able to run but could not due to the hypervisor diverting cycles away from the instance. From the point of view of your application, stolen CPU cycles are cycles that your application could have used.
Some of these diverted cycles stem from the hypervisor enforcing a quota based on the ECU you have purchased.In other cases,such as the one shown below,the amount of diverted or stolen CPU cycles varies overtime, presumably due to other instances on the same physical hardware also requesting CPU cycles from the underlying hardware.
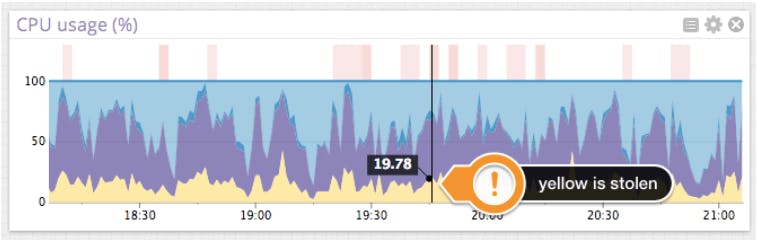
Here is a graph of CPU usage on a host with stolen CPU (in yellow). Light blue denotes “idle”, purple denotes “user” or cycles spent executing application code, and dark blue denotes “system” or cycles spent executing kernel code. In this case, we can see that the amount of stolen CPU is clearly visible.
Let us now find out whether other tenants on the same machine can affect the amount of stolen CPU. The following graphs show the amount of stolen CPU (top) and the amount of idle CPU (bottom), both measured in percent of all CPU cycles for the same machine at the same time.
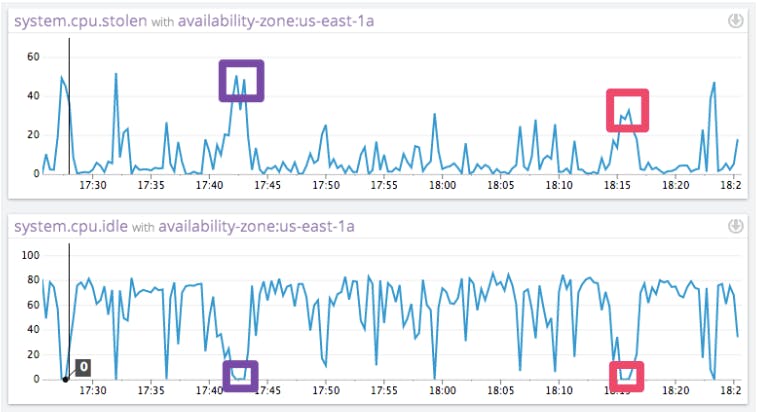
The interesting part occurs when idle CPU reaches zero. All cycles have been accounted for, either doing useful work (not represented here) or being taken away by the hypervisor(the stolen CPU graph).
Notice that at in the highlighted sections, the amount of stolen CPU ranges from 30% to 50%. If the ECU quota were the only thing causing CPU to be stolen, we should expect the stolen CPU to be equal at these two points in time.
Why Picking the Right Instance Type is Hard
Benchmarks are notoriously controversial and hard to use to predict how your particular application will perform. Yet ECU is itself a benchmark that may or may not be a good predictor for your application. Traditionally, instance price has been the decision factor to pick an instance type since that changes very slowly. As we have seen, not all ECUs are priced the same and the larger instances tend to be less sensitive to noisy neighbors and run on more modern hardware.
Why Stolen CPU Occurs
“Stolen” CPU is a fundamental property of virtual environments. Virtualization offers the ability to over-subscribe compute (among other things) between multiple instances on the premise because not all instances needCPU at the same time.This results in lower compute costs.
Since the price per instance type is the same in a given region, AWS, through the use of hypervisors, ensures that all virtual machines get a fair share of access to the underlying hardware to actually run. When a hypervisor has to juggle among a large number of virtual machines, the overhead of virtualization becomes higher and scheduling fairness(how often the hypervisor will run a particular instance) can get in the way of optimally sharing resources.
How to Detect This Issue
Because of EC2’s opacity, it is not possible to see how the compute resources that have been allocated are being used within the physical infrastructure. In particular the current allocation of instances per physical server is not available.
However, CloudWatch’s CPU Utilization metric will report on how much compute is currently used by the instance, as a percentage. CPU Utilization of 100% means that the instance has exhausted all available CPU. A CPU Utilization of 0% indicates that the instance is idle. There is no optimal value, but a CPU Utilization at 100% is a clear sign that the application could benefit from an instance with more ECUs.
By tracking the granular CPU utilization data from the OS that an application is running on (and also including any overhead from the OS itself), you can account for how the active compute is being used within the processes that are being supported by that infrastructure.
If the amount of CPU used reported by the OS is nearly equal to what AWS is providing, you have likely exceeded your compute quota and do not have any more compute available. If there is a discrepancy between all of the CPU reported by the OS (and the OS overhead) and the compute that EC2 is reporting as having actively provided, that discrepancy is stolen CPU. This indicates that your application could benefit from more ECUs.
Problem Avoidance and Resolutions
- Buy More Powerful EC2 Instances–More expensive EC2 instances will grant more compute capacity, and based on price, will also make it likely that fewer other AWS customers are sharing the hardware with you. The likelihood of limiting compute-based issues based on price however is not completely linear, and this option may become too expensive.
- Baseline Your Application Compute Needs – To ensure that you have enough compute resources on hand, for your application’s needs, be sure to baseline your application’sCPU use by observing the OS’s CPU utilization during normal operating hours and peak times. Understanding how much CPU must be purchased in an EC2 instance can help avert compute shortages actually caused by misconfiguration.
- Briefly Profile Your App on an EC2 Instance Before Finalizing a Deploy Decision – By briefly monitoring the OS and EC2 compute metrics in the initial hours of deploying on an EC2 instance, you can determine if the underlying hardware is over-subscribed, and if your application is at risk of experiencing regular stolen CPU.
- Re-Deploy Your Application in Another Instance – If you have detected that there is stolen CPU in your EC2 instance, redeploy the application elsewhere.

3. Running out of EC2 Instance Memory
When an application running on EC2 runs out of memory, it will suffer the worst possible performance problem: it will crash and cease functioning all together. Many operating systems allow for memory swapping in order to save an application from crashing by transferring the data in memory to storage at the cost of a significant performance hit. EC2’s most popular instance images do not include swap volumes.
Why It Occurs
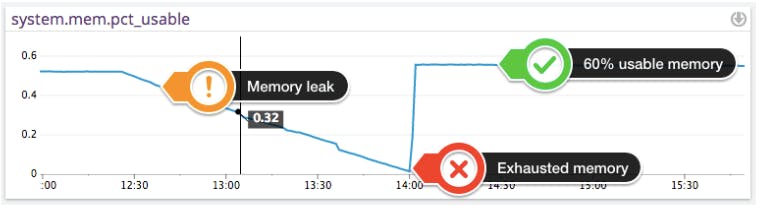
Processes in an application that experience greater than expected use, or are not written to effectively use memory, will overload the allocated memory in the EC2 instance. Without freeing memory at the same rate as allocating new memory, the application will eventually exhaust all the available memory and the system will become unstable. This is known as a memory leak. Here is an example of memory leak, with available memory reaching almost 0% in 90 minutes. Notice the sudden jump back to normal once the faulty process is terminated.
How to Detect This Issue
All operating systems have instrumentation into the amount of memory available, active and consumed yet most do not offer simple remedies to relieve memory pressure (save shutting down the most memory-hungry applications).
By design, the AWS hypervisor does not expose memory metrics, making it difficult to detect that memory for an application is running low or experiencing heightened rates of consumption.
When memory begins to run low, the OS will kill processes in order to free up memory. This can be detected in the OS logs. In a worst-case scenario, the application will crash and there will be no mention of the application crashing in the AWS console.
Problem Avoidance and Resolution
- Monitor Memory Consumption at the OS Level – By constantly monitoring the amount of memory used for application processes at the application level, you can detect when one process is consuming memory at a rate that could lead to memory exhaustion.
- Manually Kill Leaking Processes – If you can see that certain processes are leaking memory, you may manually kill processes to free up memory before the whole system crashes.
- Add Swap Volumes to your AWS Instance–By dedicated additional storage as a swap volume, you will be able to postpone catastrophic failure if one process consumes all the memory. This will be at the expense of your application performance as disk I/O is slower by several orders of magnitude than memory.
- Program your Application in a “Server-Disposable” Manner – By programming an application to take advantage of automatically scaling, additional EC2 instances can be automatically launched if an application crashes. The application can then be installed on one of the newly provisioned servers to take advantage of the fresh memory. However, as with a manual reboot, if the underlying condition that caused the memory to become exhausted repeats so will this issue.

4. ELB Load Balancing Traffic Latency
Elastic Load Balancing (ELB) is a load balancing service from AWS. Load balancing is used to distribute network traffic and requests across multiple servers, often in different geographic areas to handle more traffic than any one server could support.
ELB itself runs on EC2 instances and can suffer from the other issues that were described in this guide as well as many others. When ELB is not adequately handling web traffic, users will find the web application slow.
Why it Occurs
AWS ELB shunts traffic between servers, but gives very limited visibility into its performance. AWS will scale an ELB instance up or down based on your traffic patterns, and AWS proprietary algorithms that determine how large an ELB instance should be. If the ELB instance doesn’t fit your traffic patterns, you will get increased latency.
How to Detect This Issue
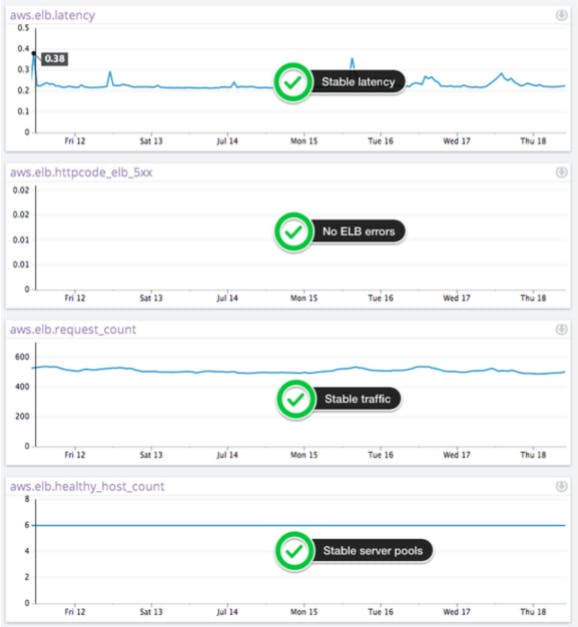
The CloudWatch metric Latency reports on latency for an ELB instance that is being used, but it does not provide a good indication of whether the ELB instance is performing properly.
The CloudWatch metric HTTPCode_ELB_5XX is another key metric to watch as it measures the number of requests that could not be load-balanced properly. The two main reasons why traffic could not be load-balanced include not having any healthy servers to route traffic to and exceeding the request rate that the ELB instance can support. Another important distinction to make is that this metric does not cover errors that occur on your web servers. Server errors are measured by the metric HTTPCode_Backend_5XX.
The CloudWatch metric Request Count will measure web requests per minute. While you usually don’t have control over the number of requests, it is a good general indicator especially if you see ELB errors.
The CloudWatch metric Healthy Host Count will measure the number of healthy web servers in the pool behind the load balancer. That number should always be greater than one for every availability zone where you host web servers.
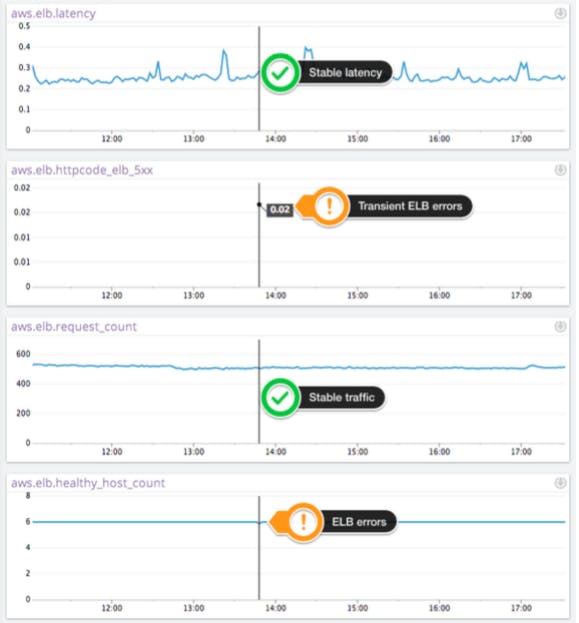
When you are experiencing ELB errors the metric HTTPCode_ELB_5XX will have non-null values, as shown below.
Other tools like Pingdom (which measures latency from about 40 different locations) can then be used to compare the CloudWatch Latency metric to an outside measure to see if there may be issues with the ELB load.
Lastly, while time consuming, server logs can be examined to understand where requests were directed and how long the requests took to be completed. These results can then be compared to baseline rates.
Problem Avoidance and Resolution
- Create a new ELB Instance – If you suspect that there is something wrong with your ELB instance, you can make another one. This process will take anywhere between a few minutes to several days for the new ELB instance to be routing all traffic, depending on the DNS expiration parameters you chose. Once the DNS is changed to the newly built ELB instance, traffic will be routed through a separate load balancer.
- Contact AWS Support – Because AWS does not release information about how its ELB functions, the only way to gain insight will likely be through your AWS support representative.

5. AWS Maintenance and Service Interruptions
AWS is made up of millions of hardware components scattered around the world. The sheer scale of hardware means that something will be in need of repair or will have failed somewhere in the infrastructure at any given time. AWS will give notice of maintenance events that could affect performance, or of outages that they are aware of and are reportable. However it is still incumbent on the customer to search for information on the status of their account, and then make the appropriate adjustments to ensure that performance is not affected.
Why it Occurs
Hardware either fails and must be repaired, replaced, or deemed obsolete and must be refreshed with newer models. Software must also be updated, which often requires scheduled downtime. In other cases, a bug in software underlying the EC2 instance can cause performance issues.
In any case, if a software or hardware component being used by your EC2 instances or related services such as ELB or EBS is malfunctioning or down, it may affect your applications. There is no hard and fast rule to know if your application is affected without monitoring your performance.
How to Detect These Issues
AWS maintenance will generally be reported on the AWS console, or in some cases, will be sent via email. Isolated and transient issues may not be reported on the AWS console.
Large-scale issues, maintenance, or outages to AWS infrastructure that have been identified will be reported on the AWS status pages.
Problem Avoidance and Resolution
- Ensure that AWS Emails are Not Being Caught by Spam Filters–As straightforward as it sounds, it is not uncommon for spam filters to catch emails coming from AWS. These emails may alert of an issue or maintenance, which will otherwise blindside an account.
- Regularly Check the AWS Account Console and Status Page – The AWS console should be checked on a daily basis to screen for any announcements from AWS about issues or scheduled downtime. Likewise, the AWS status page has an RSS feed that can be downloaded by an RSS reader to be checked with many other statuses.
Conclusion
AWS’ EC2 offers added benefits for developers and system administrators when running their applications. However, because of the differences in how IT resources are delivered and instrumented, EC2 functions differently than on-premise hardware resources. As a result, EC2 is prone to different types of performance problems that must be monitored for. After having read this guide, you should now understand why some of the most common performance issues in EC2 occur, how to identify these problems and how to either resolve these issues, or avoid them. A robust monitoring process for all applications and subcomponents used on AWS’ infrastructure is recommended to avoid issues that will affect end users.
How Datadog Can Help with AWS EC2 Performance Issues
Datadog allows for fast and easy graphing and alerting of EC2 performance metrics, which can also be correlated with metrics from other systems to understand changes in performance and issue causality.
As an example of this capability, Datadog generated the graphs embedded in this guide. Datadog also automatically registers and categorizes new hosts being deployed, and appropriately tags them. You can then use these tags to aggregate, “slice and dice” or otherwise drill down into performance metrics for analysis. Datadog also offers highly customizable alerting for AWS EC2 so you can identify and resolve AWS EC2 issues before they affect your application. Sign up for a free 14-day trial of Datadog to gain this insight.
