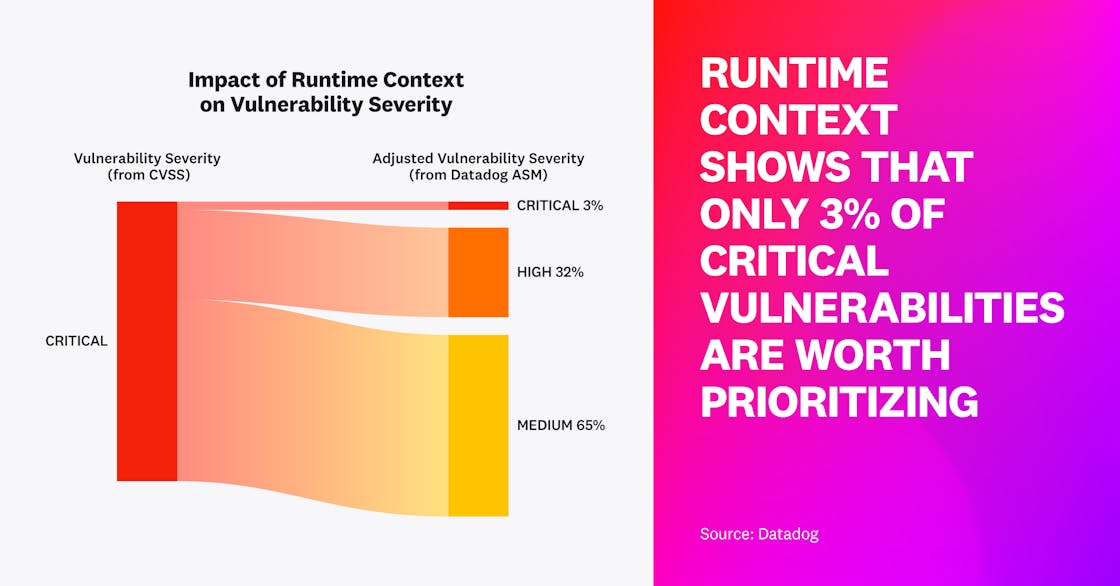
Only 3 percent of critical vulnerabilities are worth prioritizing
In order to address an ever-increasing number of security vulnerabilities in their applications, organizations need to prioritize the issues that matter most. The Common Vulnerability Scoring System (CVSS) aims to help teams assess vulnerabilities based on severity (e.g., with a score of 9–10 representing “critical” severity, or the highest risk), but it paints an incomplete picture. Context matters. Knowing where a vulnerability is (e.g., in production vs. a sandbox environment)—and whether the hosting service has been actively targeted by any attacks—makes a big difference in determining next steps for remediation.
Leveraging runtime context allows us to adjust CVSS scores to be more reflective of each vulnerability’s actual severity. The score should be lowered for vulnerabilities that meet at least one of two runtime context criteria: they are detected in a non-production environment or in a service that hasn’t been attacked in the last 30 days.
When we applied these criteria to calculate adjusted scores for vulnerabilities that had CVSS scores of 9+, we found that 97 percent of them should be downgraded in severity, meaning they can be deprioritized.
“It's extremely impactful to have very clear insights from Datadog returned—such as immediately having insight into which services are impacted, the time since detection, and how to fix them. It makes it much easier to investigate and remediate issues across all vulnerable services.”
SRE, Continental Digital Services France
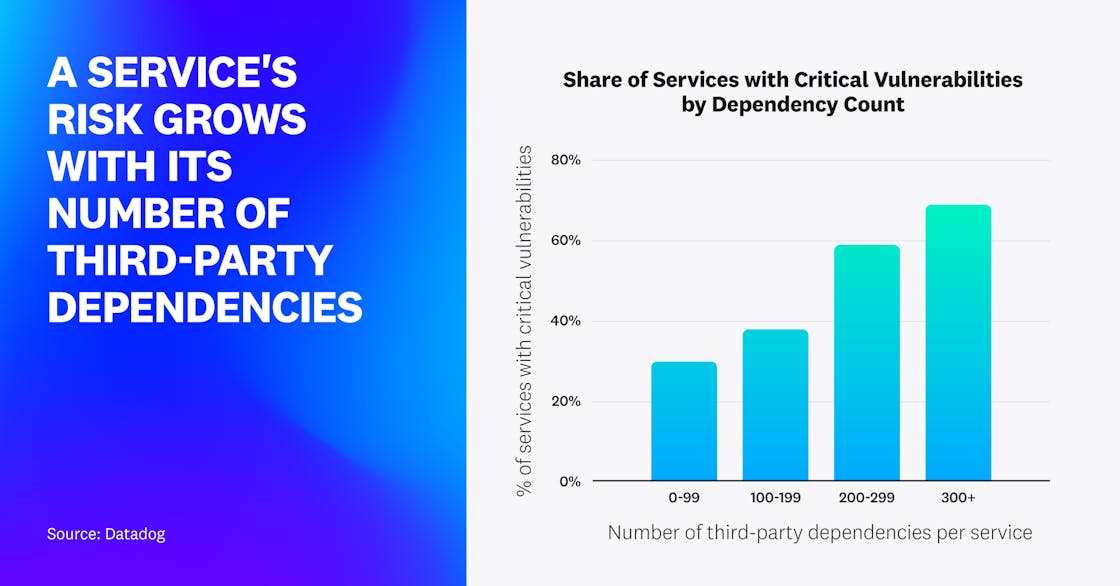
Risk grows with the number of third-party dependencies
Engineering teams utilize a large number of third-party libraries to build dynamic applications and accelerate time to market. However, from a security perspective, this presents a challenge because each library may contain vulnerabilities that put the entire application at risk.
In Java, Node.js, and Python services, we saw a marked trend—as the number of dependencies increased, so did the service’s risk (calculated based on the maximum CVSS score of its dependencies’ vulnerabilities). We also noted the same trend when we calculated adjusted vulnerability scores based on runtime context (see Fact 1). In Java, for example, all services with more than 300 dependencies had at least one vulnerability with a high or critical CVSS severity rating. Although services with more than 300 dependencies only represent 8 percent of our dataset across these three languages, we can see that they have the highest risk.
The exception to this trend was .NET, which didn’t show a clear correlation. This is possibly due to the fact that .NET vulnerabilities only accounted for 3 percent of vulnerabilities currently listed in the GitHub Advisory Database (across the four languages included in our analysis). There are a variety of possible factors that could be at play here, such as the important amount of functionality provided by the .NET standard library compared to other languages, or .NET could be getting less attention from a security research standpoint.
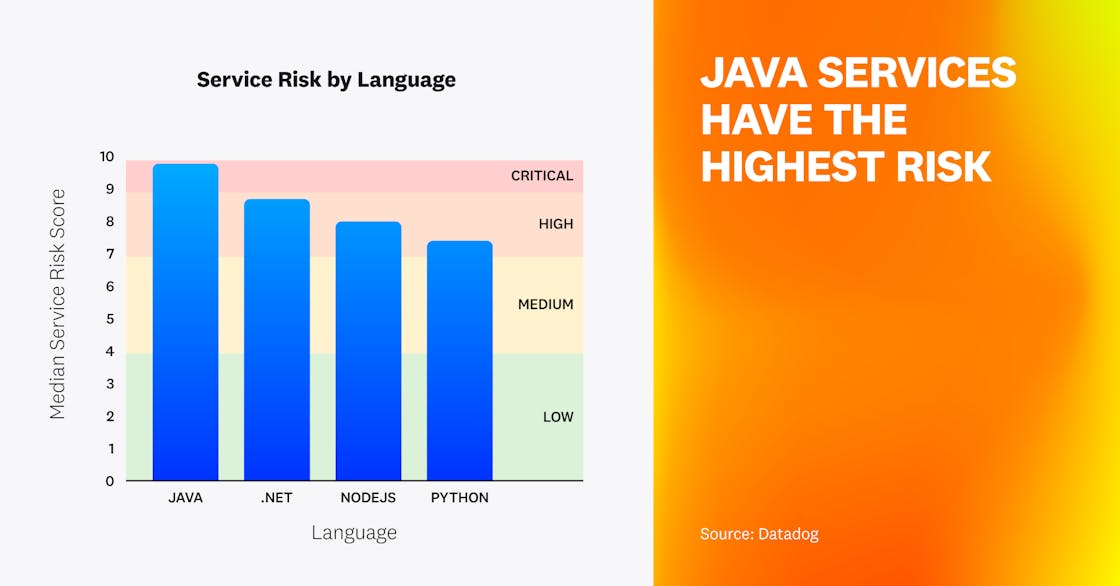
Java services have the highest risk
When comparing the different language ecosystems, one of the factors to consider is the relative severity of the known vulnerabilities in each one. To compare the four major languages used by Datadog customers, we reviewed the libraries used across a large number of organizations and services, and determined the median service risk score for each language. Java had the highest median service risk score, followed by .NET, Node.js, and Python.
One possible explanation for seeing higher CVSS scores in Java and .NET services is that those languages make it easier to access low-level primitives, potentially enabling an attacker to gain command execution. For instance, the use of reflection is common in both languages, and Java often utilizes Object-Graph Navigation Language (OGNL), which has opened the door to high-impact security issues like Log4Shell. As seen in Fact 2, .NET services have such a small number of reported vulnerabilities that their distribution might not be statistically meaningful.
At the same time, it’s important to note that CVSS scores are just one dimension to consider when evaluating the severity of vulnerabilities. In the case of Log4Shell, for example, organizations have been successful at reducing risk. We found that only 7 percent of organizations were still using vulnerable versions of the Log4j library in their Java applications—and over the course of a year, the Log4Shell vulnerability was successfully triggered in less than 0.1 percent of ASM organizations. When we analyzed data over a two-week period, we saw that only 6 percent of attacks targeted this vulnerability.
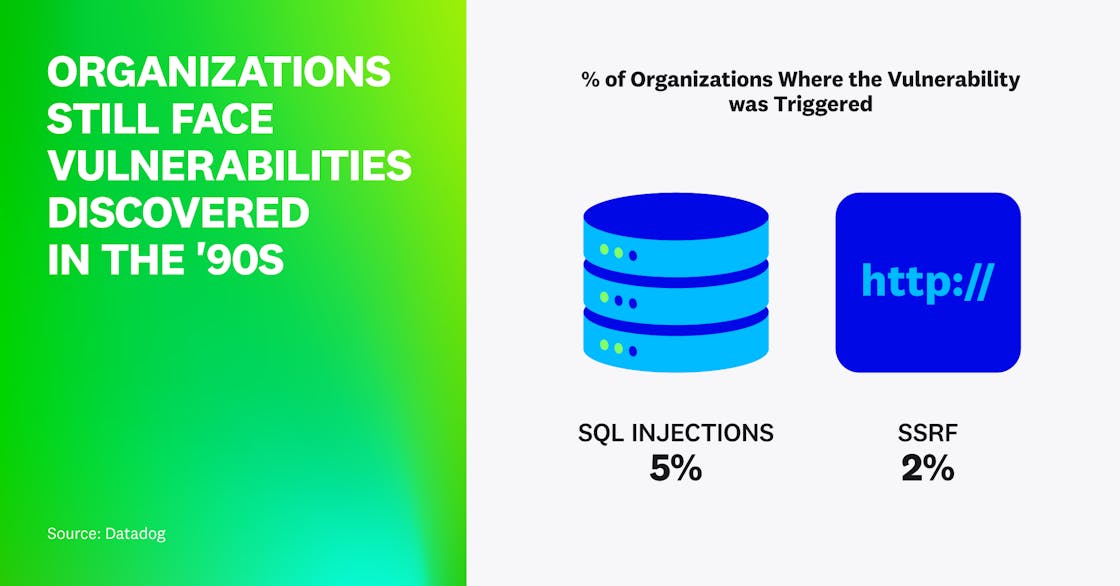
Organizations still face vulnerabilities discovered in the ’90s
Despite first being discussed and exploited over 20 years ago, SQL injection and server-side request forgery (SSRF) are still being seen in modern web applications.
Over the last year, 5 percent of organizations had at least one exploitable SQL injection vulnerability, which could lead an attacker to gain unauthorized access to data or potentially even compromise the underlying host.
Our research found that while SSRF vulnerabilities are not as prevalent as SQL injections, approximately 2 percent of organizations have seen an exploitable issue in their applications over the last year.
SSRF vulnerabilities have particularly serious consequences in cloud-hosted applications because they can allow attackers to access metadata services that contain sensitive information. In OWASP’s latest Top 10, SSRF was the only specific vulnerability given its own issue.
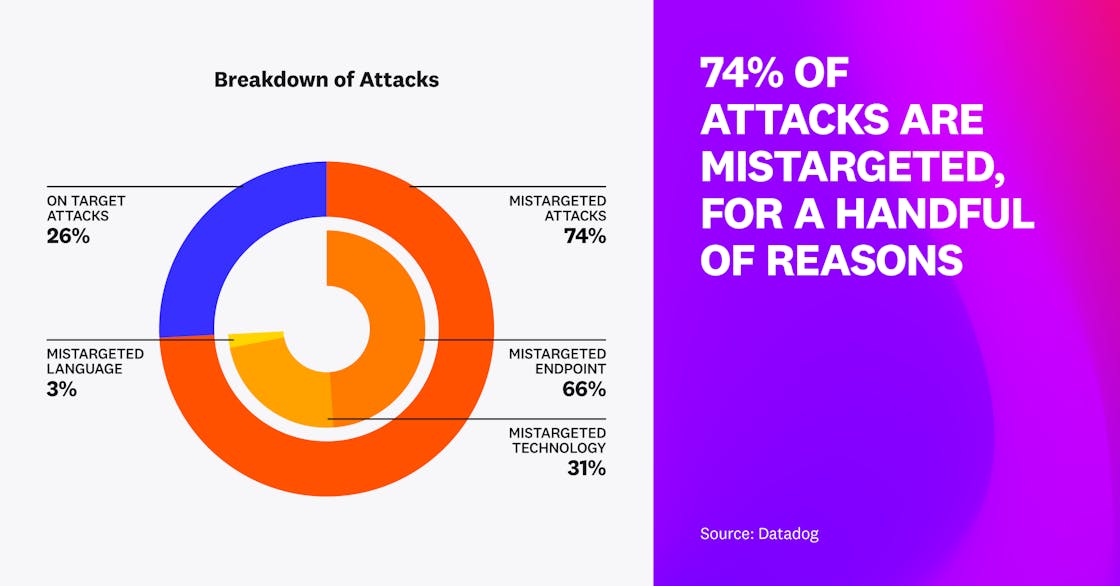
Three-quarters of attacks are mistargeted
Any organization that runs services connected to the internet is well aware that there is a lot of noise from automated scanners and attacks that are unlikely to succeed. In addition to attackers seeking to compromise systems, a large number of security companies regularly scan the internet for possible misconfigurations and vulnerabilities.
Looking at data over a two-week period, we saw that 74 percent of attacks would not succeed, based on runtime context. These attacks targeted endpoints that were not present in the services (66 percent of cases), tried to exploit vulnerabilities related to databases not used by those systems (31 percent of cases), or targeted languages that were not used in the application (3 percent of cases). For example, a mistargeted attack might attempt to exploit SQL injection in a system without a SQL database or try to exploit a PHP vulnerability in a Java application. This shows how important attack qualification is—security teams need to be able to sift through the noise and focus on the important attacks that require their attention.
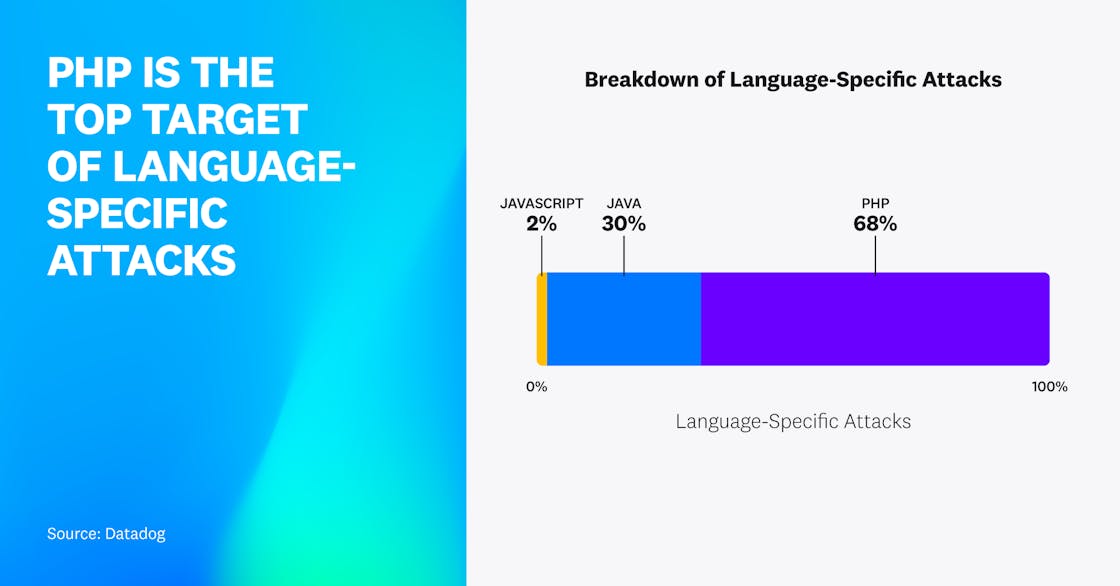
PHP is the top target of language-specific attacks
PHP has long been the most popular server-side language on the internet. According to W3Techs data that measured the number of sites using specific technologies, over 77 percent of websites are powered by PHP. Along with its enduring popularity, however, PHP also has a long history of security vulnerabilities and attacks.
When we looked at the attack data over a two-week period to see which languages were specifically being targeted (for example, by automated scanners), we saw that PHP, Java, and JavaScript were the main targets, and PHP was overwhelmingly the favorite. Sixty-eight percent of attacks that targeted language-specific vulnerabilities attempted to exploit PHP applications, showing that popularity does lead to increased attention from attackers.
When PHP was released in 1995, security practices were not a top concern. Since then, more modern PHP frameworks have emerged, but attackers continue to actively look for systems that still run older stacks.
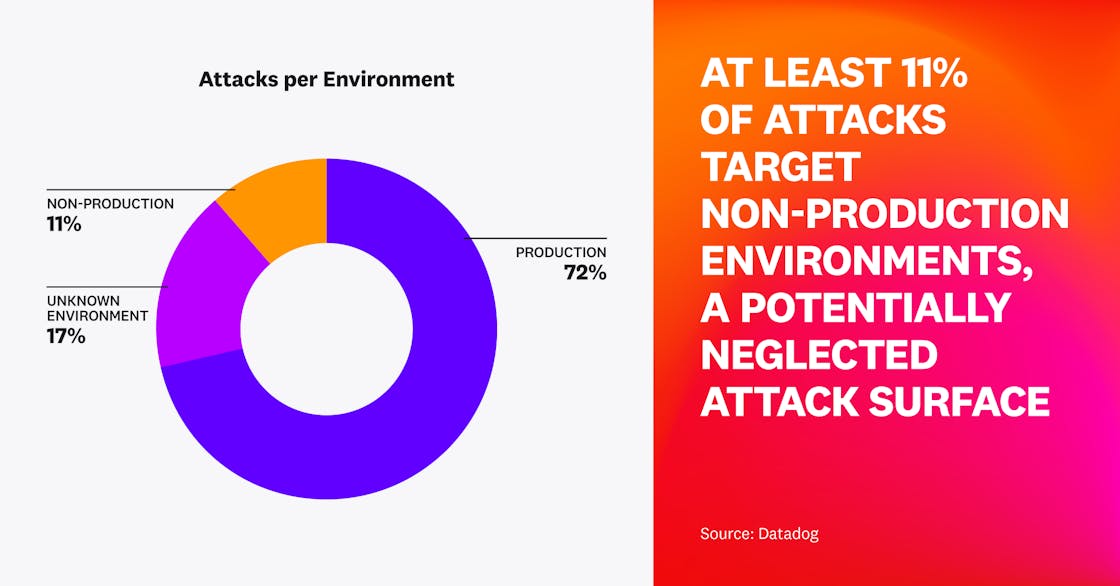
At least 11 percent of attacks target non-production environments
Production environments are the core of organizations’ operations. However, a successful attack on a non-production environment could also have serious consequences. Our data shows that 11 percent of attacks target non-production environments. This should be interpreted as a lower bound because we only classified environments that had obvious tags (e.g., staging, development) as non-production environments.
These attacks open up the possibility of supply chain attacks where artifacts are compromised prior to being deployed. Additionally, there may be cases where secrets are shared or sensitive data is used for testing purposes, emphasizing the need for companies to pay attention to all of their systems across every stage of the application lifecycle.