- Product
Infrastructure
Applications
Data
Logs
Security
- Overview
- Code Security
- Software Composition Analysis
- Static Code Analysis (SAST)
- Runtime Code Analysis (IAST)
- IaC Security
- Cloud Security
- Cloud Security Posture Management
- Cloud Infrastructure Entitlement Management
- Vulnerability Management
- Compliance
- Cloud SIEM
- Workload Protection
- App and API Protection
- Sensitive Data Scanner
- Security Labs Research
- Open Source Projects
- Secret Scanning
Digital Experience
Software Delivery
Service Management
AI
Platform Capabilities
- Bits AI Agents
- Metrics
- Watchdog
- Alerts
- Dashboards
- Notebooks
- Mobile App
- Fleet Automation
- Governance Console
- Access Control
- Incident Response
- Case Management
- Event Management
- Workflow Automation
- App Builder
- Cloudcraft
- CoScreen
- Teams
- OpenTelemetry
- Integrations
- IDE Plugins
- MCP Server
- Pup CLI
- Agent Directory
- API
- Marketplace
- DORA Metrics
- Customers
- Pricing
- Solutions
- Financial Services
- Manufacturing & Logistics
- Healthcare/Life Sciences
- Retail/E-Commerce
- Government
- Education
- Media & Entertainment
- Technology
- Gaming
- Amazon Web Services Monitoring
- Azure Monitoring
- Google Cloud Monitoring
- Oracle Cloud Monitoring
- Kubernetes Monitoring
- Red Hat OpenShift
- Pivotal Platform
- OpenAI
- SAP Monitoring
- OpenTelemetry
- Application Security
- Cloud Migration
- Monitoring Consolidation
- Unified Commerce Monitoring
- SOAR
- DevOps
- FinOps
- Shift-Left Testing
- Digital Experience Monitoring
- Security Analytics
- Compliance for CIS Benchmarks
- Hybrid Cloud Monitoring
- Edge Device Monitoring
- Real-Time BI
- On-Premises Monitoring
- Log Analysis & Correlation
- CNAPP
Industry
Technology
Use Case
- About
- Blog
- Docs
- Login
- Get Started

Manage rapidly scaling environments without rapidly increasing headcount
Modern applications are constantly in flux, cycling through ephemeral cloud and container infrastructure as they scale up and down in response to demand. As these systems become more complex and dynamic, operational tasks consume an increasing share of engineering time. Datadog provides built-in machine learning to simplify the complexity of managing and monitoring quickly growing environments. Machine learning enables engineering teams to cover more ground, so they can scale up their systems without requiring a proportional increase in headcount. With anomaly detection, forecasting, outlier detection, and automatic metric correlation, engineers can rely on machine learning to intelligently monitor larger numbers of objects, cut through the noise to provide clear visibility, and enable continual awareness of increasingly complex systems.
Watchdog is giving us faster incident response. It’s showing us where the problems are in our system that we wouldn’t have otherwise seen. And it’s showing us where other impacts are throughout the system… it’s allowing us to essentially deliver a better level of service to our customers.
Joe Sadowski
Engineering Manager, Square
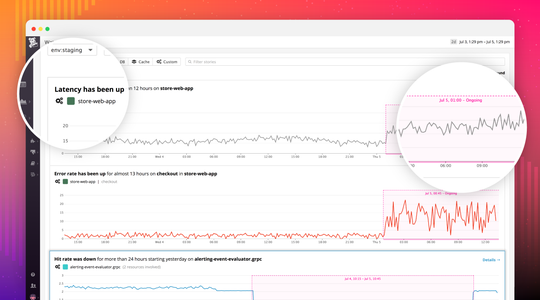
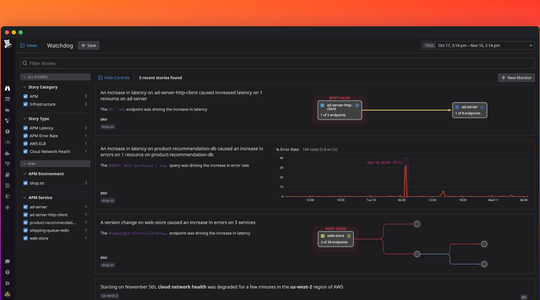
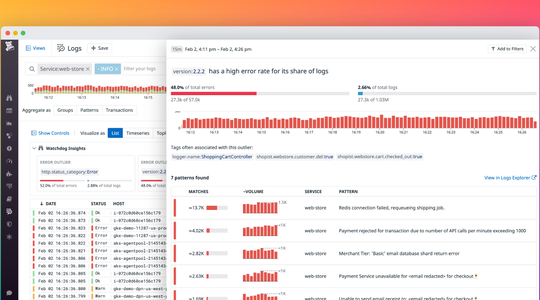
Application-wide auto-detection of issues without user setup
Datadog automatically analyzes infrastructure and application performance with machine learning, so that engineering teams can be made aware of issues without manually setting up alerts for every possible failure mode. The Watchdog anomaly detection engine automatically flags abnormal error rates in any application or service, elevated latency for any database or query, cloud provider network issues, and more. When an issue is detected, Datadog provides instant context for troubleshooting, with error messages from the application code and links to granular performance data in Datadog APM for deeper investigation.

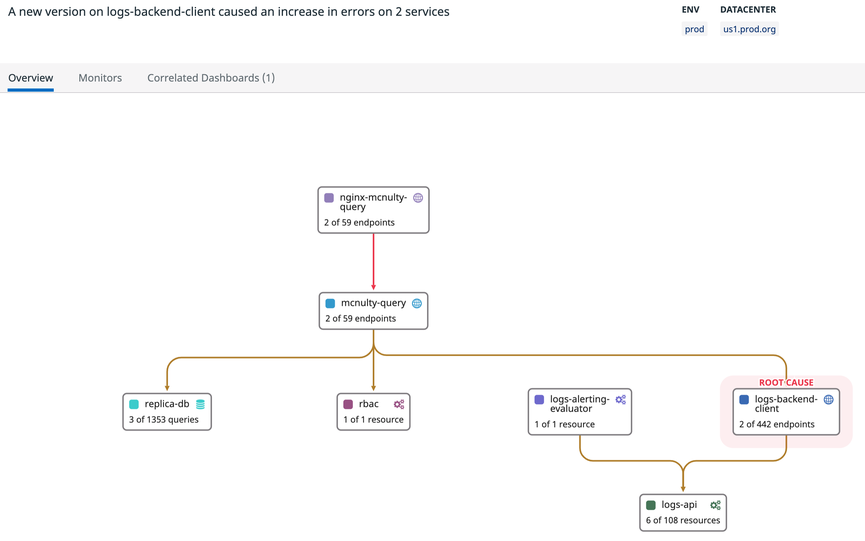
Automatic correlation to immediately identify potential “needle in a haystack” root causes
In application architectures that may include hundreds of services and thousands of hosts and containers, it can take hours of digging to find the root cause of an issue. Datadog's Correlations view narrows the focus of an investigation and surfaces potential root causes by isolating correlated metrics for any change in performance or availability. For example, when the number of completed checkouts declines unexpectedly, the Correlations view automatically identifies which services or infrastructure systems may be the cause of the dropoff. Datadog then surfaces the correlated metrics from each of those systems. With Correlations, responders can zero in on the source of an issue without having to rely on guesswork or a time-consuming, wide-ranging exploration of possible root causes.

Anomaly detection that accounts for trends and seasonality
Anomaly detection addresses one of the core challenges in monitoring dynamic, responsive, ever-scaling infrastructure: How to define normal versus abnormal performance. Setting static thresholds often leads to false alarms due to normal variations in key metrics like website traffic and customer checkouts, which tend to rise and fall depending on the time of day, day of the week, or day of the month. Anomaly detection accounts for those expected variations, as well as long-term trends, to intelligently flag behavior that is truly unexpected. Datadog's anomaly detection algorithms are rooted in established statistical models, but have been heavily adapted for the domain of high-scale infrastructure and application monitoring.

Outlier detection for monitoring large, dynamic fleets
Monitoring large fleets of servers, containers, Edge devices, or application instances makes it difficult to keep tabs on the health and performance of any individual member of the fleet. Datadog's outlier detection algorithms constantly evaluate large fleets or groups to identify if any member of the fleet starts behaving abnormally, as compared to its peers. Using outlier detection, engineers can automatically identify unhealthy application servers, databases, or other systems in need of maintenance, without having to define ahead of time what normal, healthy behavior looks like.

Forecasting to prevent bottlenecks
Even in dynamic systems, some limits are fixed, and breaching them can have severe consequences. When an application runs out of memory, or a database server runs out of disk space, the resulting crash can trigger a cascading failure and cause a user-facing outage. For resource constraints such as these, Datadog provides forecasting algorithms to alert engineering teams with sufficient time to address the problem and avoid issues altogether. For instance, forecast alerts can notify teams a week before disk space is predicted to run out, based on recent trends and seasonal patterns in that system's disk usage. With Datadog's Webhooks integration and monitoring APIs, teams can build automated AIOps (artificial intelligence for IT operations) workflows, such as archiving or deleting logs to reclaim disk space, or provisioning more instances of an application to reduce the memory pressure on app servers.

Root cause analysis for immediate diagnosis
When a system goes down or is affected by an unexpected issue, it can take hours to find the root cause of the problem and fix it, leading to prolonged service interruption and possibly loss of revenue. Watchdog RCA automatically detects anomalous behavior from across your applications and infrastructure, identifies the causal relationships among different symptoms, and clearly pinpoints the root cause. This approach enables you to resolve problems anywhere in your stack faster than ever, significantly reducing your mean time to resolution.