- Product
Infrastructure
Applications
Data
Logs
Security
- Overview
- Code Security
- Software Composition Analysis
- Static Code Analysis (SAST)
- Runtime Code Analysis (IAST)
- IaC Security
- Cloud Security
- Cloud Security Posture Management
- Cloud Infrastructure Entitlement Management
- Vulnerability Management
- Compliance
- Cloud SIEM
- Workload Protection
- App and API Protection
- Sensitive Data Scanner
- Security Labs Research
- Open Source Projects
- Secret Scanning
Digital Experience
Software Delivery
Service Management
AI
Platform Capabilities
- Customers
- Pricing
- Solutions
- Financial Services
- Manufacturing & Logistics
- Healthcare/Life Sciences
- Retail/E-Commerce
- Government
- Education
- Media & Entertainment
- Technology
- Gaming
- Amazon Web Services Monitoring
- Azure Monitoring
- Google Cloud Monitoring
- Oracle Cloud Monitoring
- Kubernetes Monitoring
- Red Hat OpenShift
- Pivotal Platform
- OpenAI
- SAP Monitoring
- OpenTelemetry
- Application Security
- Cloud Migration
- Monitoring Consolidation
- Unified Commerce Monitoring
- SOAR
- DevOps
- FinOps
- Shift-Left Testing
- Digital Experience Monitoring
- Security Analytics
- Compliance for CIS Benchmarks
- Hybrid Cloud Monitoring
- Edge Device Monitoring
- Real-Time BI
- On-Premises Monitoring
- Log Analysis & Correlation
- CNAPP
Industry
Technology
Use Case
- About
- Blog
- Docs
- Login
- Get Started

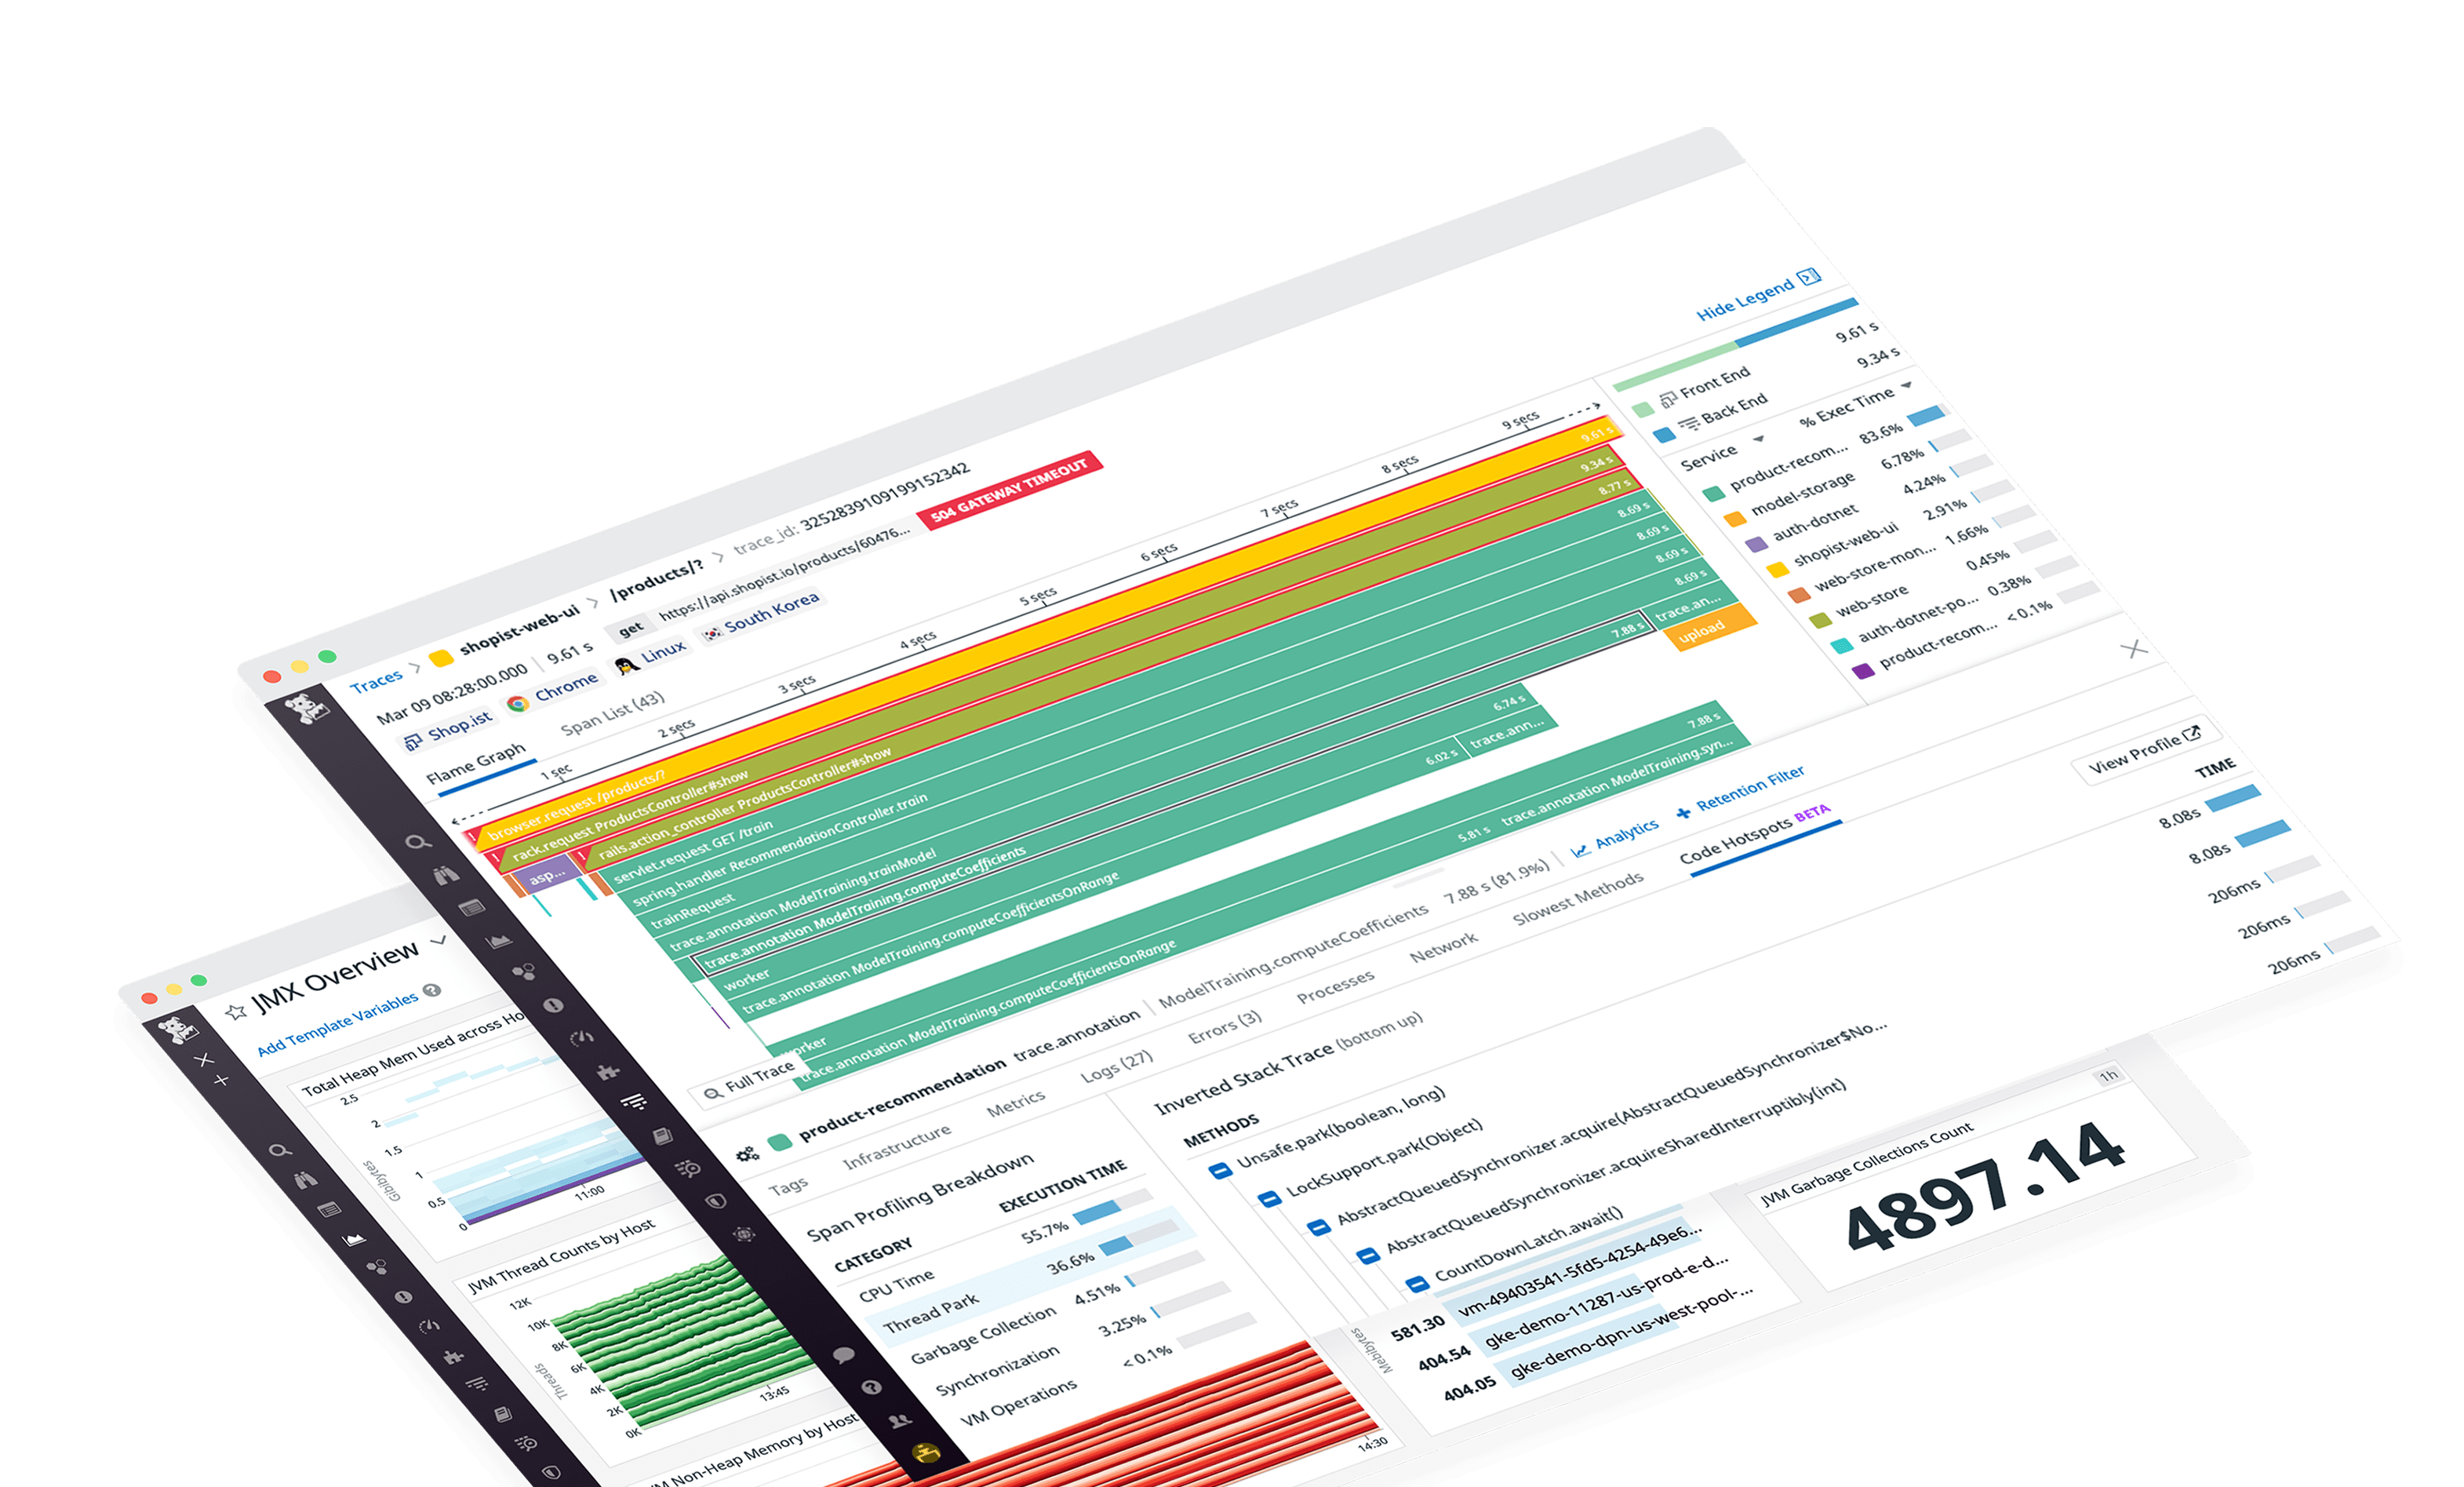
Java Application Monitoring
Java monitoring gives you real-time visibility into your Java stack, allowing you to quickly respond to issues in your JVM, optimize inefficiencies, and minimize downtime. You can also continuously profile your Java code and pivot seamlessly between request traces and all other telemetry to ensure your Java applications are highly performant.
Java monitoring gives you real-time visibility into your Java stack, allowing you to quickly respond to issues in your JVM, optimize inefficiencies, and minimize downtime. You can also continuously profile your Java code and pivot seamlessly between request traces and all other telemetry to ensure your Java applications are highly performant.


