

.NET Performance Monitoring & Tracing | Datadog

.NET Performance Monitoring & Tracing

Monitor .NET Framework metrics, stack traces, and logs with Datadog.

Full-stack .NET monitoring and analytics

  • Optimize and monitor .NET performance to meet SLAs and SLOs
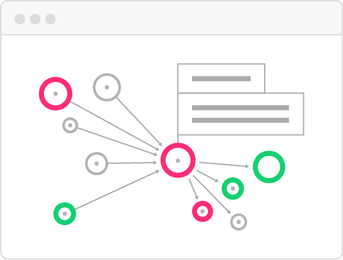
  • Identify .NET application dependencies with the automatically generated Service Map
  • Troubleshoot .NET at the service, endpoint, and customer-level with App Analytics

Debug apps with .NET tracing and logs

  • Search and filter .NET stack traces to highlight errored requests and functions in the trace view
  • Identify the root cause of problems by automatically correlating .NET trace data and logs with TraceID
  • Proactively track and solve .NET performance issues with Log Patterns and Analytics

Auto-instrumentation for .NET frameworks and runtimes

  • Instrument .NET applications for popular web frameworks like ASP.NET MVC or ASP.NET Core MVC
  • Automatically configure the .NET Tracer for the .NET Framework and .NET Core runtimes
  • Monitor .NET metrics, traces, and logs alongside data from 1,000+ other turnkey integrations
Datadog programming language and framework support integration tiles

Analyze .NET performance data in context

Leverage Datadog APM for next-generation .NET monitoring and tracing.
watchdog-apm-illustration.png

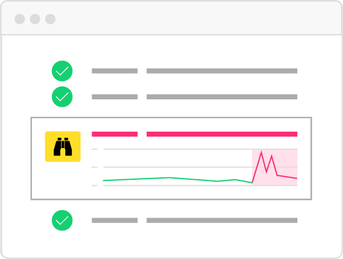
Watchdog

Auto-detect performance problems without manual setup or configuration.
tracesearch-apm-illustrationv2.png

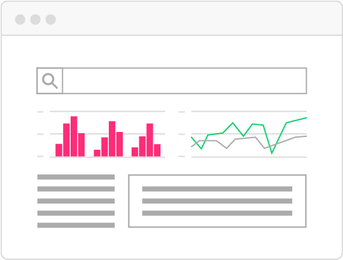
App Analytics

Search, filter, and analyze .NET stack traces at infinite cardinality.
servicemap-apm-illustration.png

Service Map

Map .NET applications and their supporting architecture in real-time.

Thousands of Customers Love & Trust the Datadog Platform

.NET Monitoring Resources

Learn about .NET monitoring tools and best practices.

Datadog .NET APM Starter Kit