PostgreSQL Monitoring | Datadog

PostgreSQL Database Monitoring

Monitor and visualize your most important PostgreSQL database metrics with Datadog database monitoring.

PostgreSQL, or “Postgres,” is an open source, object-relational database system used by organizations such as Cisco, Fujitsu, and Datadog. Using Datadog database monitoring, you can automatically collect PostgreSQL data and monitoring everything in one place. Instead of manually querying your PostgreSQL database, use the Datadog Agent to automatically aggregate metrics and visualize them in a custom dashboard.


Monitor PostgreSQL Database Metrics Alongside the Rest of Your Stack

  • Monitor your PostgreSQL databases, cloud services, containers, and serverless functions all in one place with Datadog’s 750+ vendor-backed integrations
  • Monitor query-level and host-level metrics together to better understand how resource constraints affect database performance
  • Leverage out-of-the-box integrations with the rest of the Datadog platform, including dashboards, monitors, and advanced formulas and function
Monitor PostgreSQL Database Metrics Alongside the Rest of Your Stack

Optimize PostgreSQL Database Performance

  • Rapidly identify problematic PostgreSQL queries with valuable metrics such as average latency, total execution time, and number of rows queried
  • Isolate query performance issues in minutes by visualizing query metrics over time
  • Pinpoint inefficient query patterns that hinder performance with explain plans

Troubleshoot PostgreSQL Issues Faster

  • Easily isolate performance issues in your database fleet with out-of-the box health summary telemetry
  • Better understand the loads on your databases with PostgreSQL host wait events; triage your databases with top query metrics
  • Seamlessly pivot to and from Datadog APM to resolve application issues faster
Troubleshoot PostgreSQL Issues Faster

The Essential Monitoring and Security Platform for the Cloud Age

Datadog brings together end-to-end traces, metrics, and logs to make your applications, infrastructure, and third-party services entirely observable.

Platform Diagram

Alert on database performance data in real time

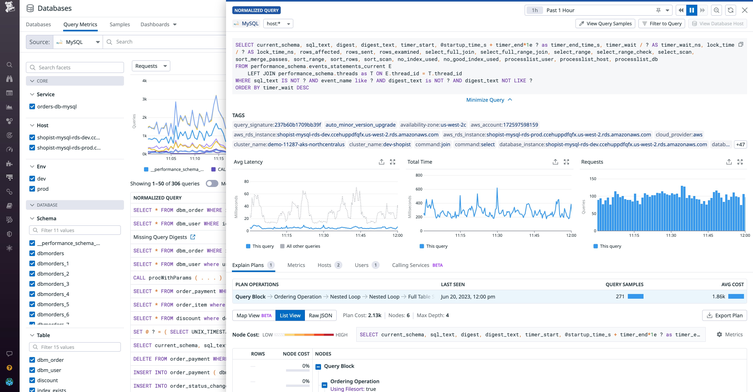
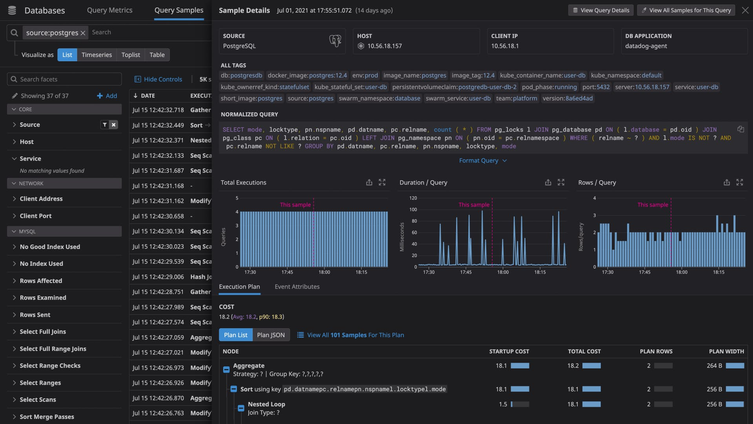
Analyze and monitor database performance in context with Datadog.
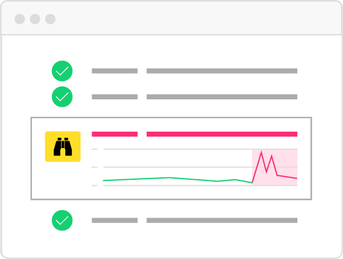
watchdog-apm-illustration.png

Watchdog

Auto-detect performance problems without manual setup or configuration.

synchronized-dashboards-infra-illustration.png

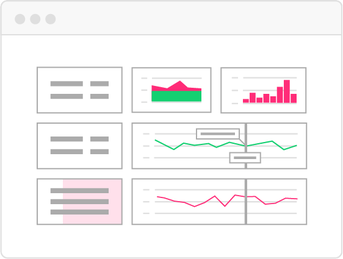
Synchronized Dashboards

Correlate database performance metrics with a common tagging structure.

servicemap-apm-illustration.png

Service Map

Visualize application health and database dependencies in real-time.

PostgreSQL Monitoring Resources

Learn about how to monitor PostgreSQL and monitoring best practices.

PostgreSQL Monitoring Blog Posts

Loved & Trusted by Thousands

Washington Post logo 21st Century Fox Home Entertainment logo Peloton logo Samsung logo Comcast logo Nginx logo