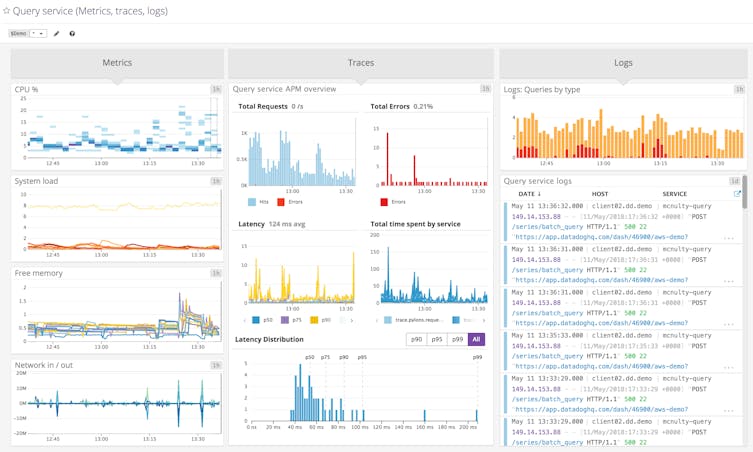
Monitor MongoDB Memory Usage | Datadog

MongoDB memory usage monitoring

Track MongoDB memory usage metrics alongside data from 700+ other technologies

It is critical to understand your MongoDB memory usage to ensure database performance and high availability. Datadog allows you to monitor your MongoDB usage in real time in the context with the rest of your stack to help you catch critical memory issues earlier and minimize downtime.


Monitor and analyze MongoDB memory usage metrics

  • Gain insights on MongoDB memory usage, cache statistics, page read into cache, pages evicted, volume of disk reads, and more at both the system and database level
  • Avoid insufficient usage of indexes, which can result in long queries and overwhelm the server’s ability to handle requests in the case of numerous concurrent ones
  • Identify memory allocation issues that can directly affect the end user and lead to downtime

Proactively track MongoDB memory usage

  • Monitor physical and virtual memory to improve latency and overall throughput
  • Visualize page fault trends to identify inefficient schema design, redundant or unnecessary indexes, or unnecessary use of available RAM
  • Optimize the amount of space utilized by cached and dirty data to identify memory available to be allocated
Visualize MonogoDB memory usage and other metrics in an out of the box dashboard

Ensure MongoDB memory availability and utilization

  • Optimize query performance to reduce MongoDB memory usage and execution time
  • Set alerts on memory usage to notify on-call teams about resource saturation, spot bottlenecks, and know when to scale up or out
  • Ensure the cache is big enough to hold the entire application working set for adequate WiredTiger storage engine performance

Achieve full visibility into MongoDB memory usage

  • Correlate MongoDB performance metrics with the rest your application data and logs to gain deeper insights on database behavior
  • Visualize key MongoDB metrics with Datadog’s out-of-the-box dashboard
  • Apply sophisticated ML-based alerting to take corrective actions if a memory failure is detected
  • Quickly identify memory issues, resource and locking saturations, cache usage, and latency breakdowns with anomaly and outlier detection
Track MongoDB metrics, traces, and logs in a unified platform

The Essential Monitoring and Security Platform for the Cloud Age

Datadog brings together end-to-end traces, metrics, and logs to make your applications, infrastructure, and third-party services entirely observable.

platform_diagram_lpg

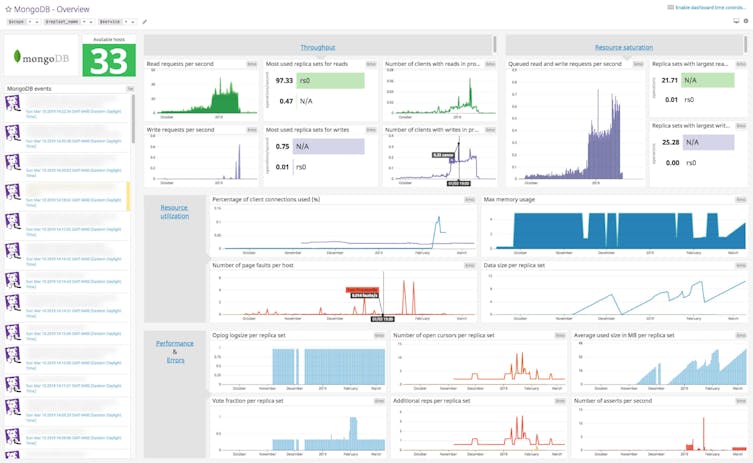
Seamlessly monitor key MongoDB memory metrics

Use Datadog to quickly analyze MongoDB memory limits and more.

hostmap-infra-illustration.png

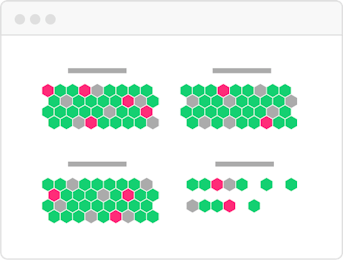
Host and Container Maps

Visualize the status of your hosts or containers in a single view.

synchronized-dashboards-infra-illustration.png

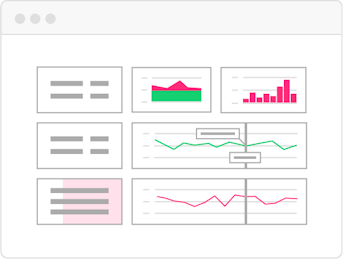
Synchronized Dashboards

Track incidents across metrics with a common tagging structure.

cloud-functions-infra-illustration.png

Cloud Functions

Monitor, filter, and analyze serverless functions.

Loved & Trusted by Thousands

Washington Post logo 21st Century Fox Home Entertainment logo Peloton logo Samsung logo Comcast logo Nginx logo

MongDB Memory Usage Monitoring Resources

Learn about MongoDB monitoring tools and best practices.

Datadog Starter Kit

MongoDB Monitoring with Datadog