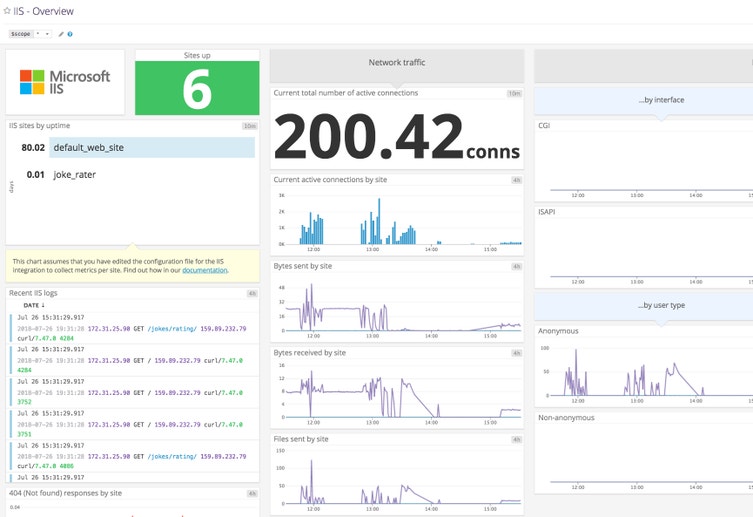
IIS Logs Monitoring and Analysis | Datadog

Monitoring IIS Logs

Collect, visualize, and alert on key IIS metrics including latency, rejected connections, HTTP status codes, connect counts, slow response times, and more.

With Datadog Log Management, you can monitor and analyze logs from IIS in real time. Collects metrics for active connections, bytes sent and received, request count by HTTP method, and more. Monitor and analyze your IIS logs without any need for active querying, and recieve alerts when there’s an issue with IIS.


Monitor the Health and Efficiency of Microsoft IIS

  • Monitor IIS workloads, requests, client connections, target services, host health, and application performance in real time
  • Collect, visualize, and alert on 180+ IIS metrics, including latency, rejected connections, HTTP status codes, connect counts, and slow response times
  • Identify load balancing inefficiencies, misconfigurations, and the sources of expensive cross-AZ traffic with the live network map
Monitor the Health and Efficiency of Microsoft IIS

Graph and Analyze IIS Data

  • Analyze your IIS log data, graph it over time, and aggregate it by any facet, whether it’s URI stem, HTTP request method, or any other log-based metric.
  • Drill dowhn and see any attribute Datadog has extracted with Log Explorer.
  • Graph any of your log attributes and easily understand changes in performance over time.
Graph and Analyze IIS Logs

Automated Alerts for IIS Monitoring

  • Configure custom alerts to immediately notify you wehen IIS runs into perofmrance issues, even if the issue spans multiple sites./li>
  • Alert on data from your IIS logs, such as the latency of a request.
Automated alerts for IIS monitoring

The Essential Monitoring and Security Platform for the Cloud Age

Datadog brings together end-to-end traces, metrics, and logs to make your applications, infrastructure, and third-party services entirely observable.

Platform Diagram

Next-Generation Synthetic Monitoring

Maintain a positive user experience and minimize downtime.
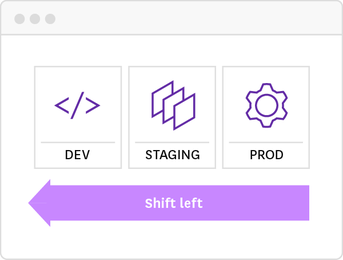
dg/cicd-illustration.png

CI/CD testing

Shift test automation practices to the left to catch issues earlier on in the development process.
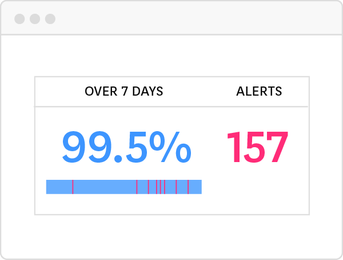
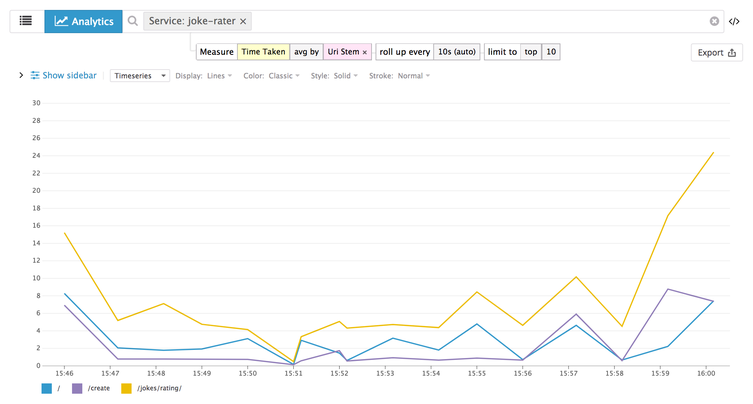
dg/slos-illustration.png

SLO tracking

Real time visibility into your SLOs through drag and drop dashboard widgets.
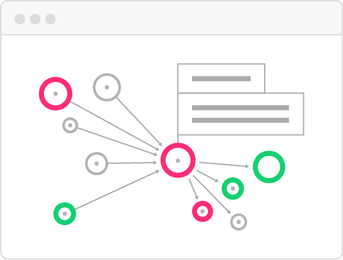
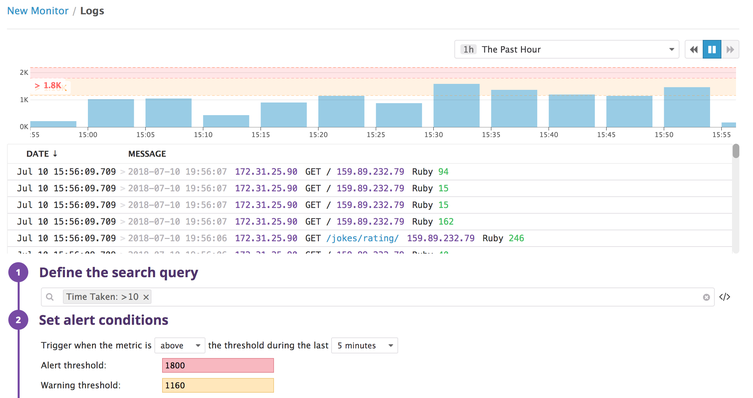
servicemap-apm-illustration.png

Root cause analysis

Full stack correlation from synthetic tests to metrics, traces, and logs.

IIS Logs Monitoring Resources

Learn about IIS logs and monitoring best practices.

IIS Monitoring Blog Posts

Loved & Trusted by Thousands

Washington Post logo 21st Century Fox Home Entertainment logo Peloton logo Samsung logo Comcast logo Nginx logo