Network Traffic Visualization | Datadog

Network Traffic Visualization

Visualize network traffic from a birds-eye view across on-premise, cloud-based, and containerized environments.

Visualizing network traffic across your whole environment is often difficult, tedious and sometimes impossible. With Datadog’s Network Map, you gain a bird’s-eye view of your network to help you visualize network partitions, dependencies, and bottlenecks across all your infrastructure or services.


Next-Generation Network Monitoring

Monitor your environment and its network dependencies in real time.
servicemap-apm-illustration.png

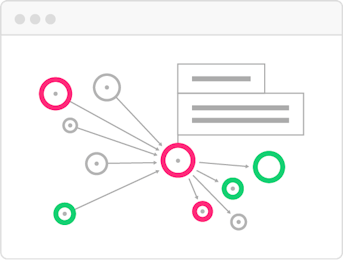
Live Network Map

Visualize all dependencies in one place with the live network map.
hostmap-infra-illustration.png

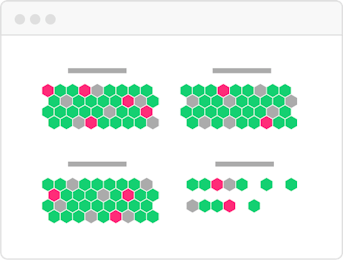
Host and Container Maps

Visualize the status of your hosts or containers in a single view.
synchronized-dashboards-infra-illustration.png

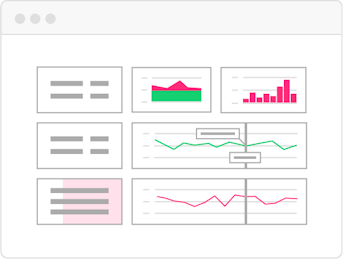
Synchronized Dashboards

Track incidents across metrics with a common tagging structure.

Network Monitoring Resources

Learn about Datadog Network Monitoring and read our blogs.

Visualizing Network Traffic with Datadog

Network Monitoring Blog Posts

Loved & Trusted by Thousands

Washington Post logo 21st Century Fox Home Entertainment logo Peloton logo Samsung logo Comcast logo Nginx logo