
What is OpenTelemetry?
OpenTelemetry (OTel) is an open source observability framework that provides standardized APIs, SDKs, and tools for collecting and routing telemetry data. Created under the Cloud Native Computing Foundation (CNCF) through the merger of the OpenTracing and OpenCensus projects, OpenTelemetry provides a consistent, vendor-neutral format for instrumenting, generating, gathering, and exporting the three pillars of observability — metrics, logs, and traces — to any compatible monitoring backend.
First introduced in 2019, OpenTelemetry is as of 2026 one of the largest and most active projects in the cloud native ecosystem, second only to Kubernetes in CNCF contributor volume.
How does OpenTelemetry work?
OpenTelemetry consists of loosely coupled components that work together to instrument applications, collect telemetry data, and export it to one or more observability backends. Individual components can be adopted independently, or the full stack can be used together, as the architecture is designed to be modular.
The main OpenTelemetry components are:
- Application programming interfaces (APIs)
APIs define the interfaces for creating telemetry data and coordinating collection across a system. They are language-specific, and the API must match the language the application is written in. A key design principle is that the API is decoupled from the SDK: applications can be instrumented with the OTel API while deferring the choice of SDK. If no SDK is configured, API calls are no-ops, so instrumentation carries no runtime cost in that state.
- Software development kits (SDKs)
SDKs implement the APIs and handle the practical work of data gathering, processing, and exporting. Like the APIs, they are language-specific. SDKs include configurable sampling, batch processing, and support for multiple exporters simultaneously — meaning the same telemetry can be sent to more than one backend without re-instrumenting the application.
- The OpenTelemetry Protocol (OTLP)
OTLP is the specification that defines how telemetry data is encoded and transported between sources, intermediaries, and backends. It has become the de facto standard for telemetry data transfer in the observability industry, with broad support across vendors and open source tools. Instrumentation that exports via OTLP can be directed to virtually any modern observability platform without code changes.
- Semantic conventions
Semantic conventions are standardized attribute names and values that give telemetry data consistent meaning across different languages, frameworks, and services. Conventions define how to name the attributes that describe an HTTP request, a database call, or a cloud provider resource — ensuring that the same query produces consistent results regardless of where the data originated. Following semantic conventions makes telemetry data interoperable and enables out-of-the-box dashboards and alerting from any OTLP-compatible backend.
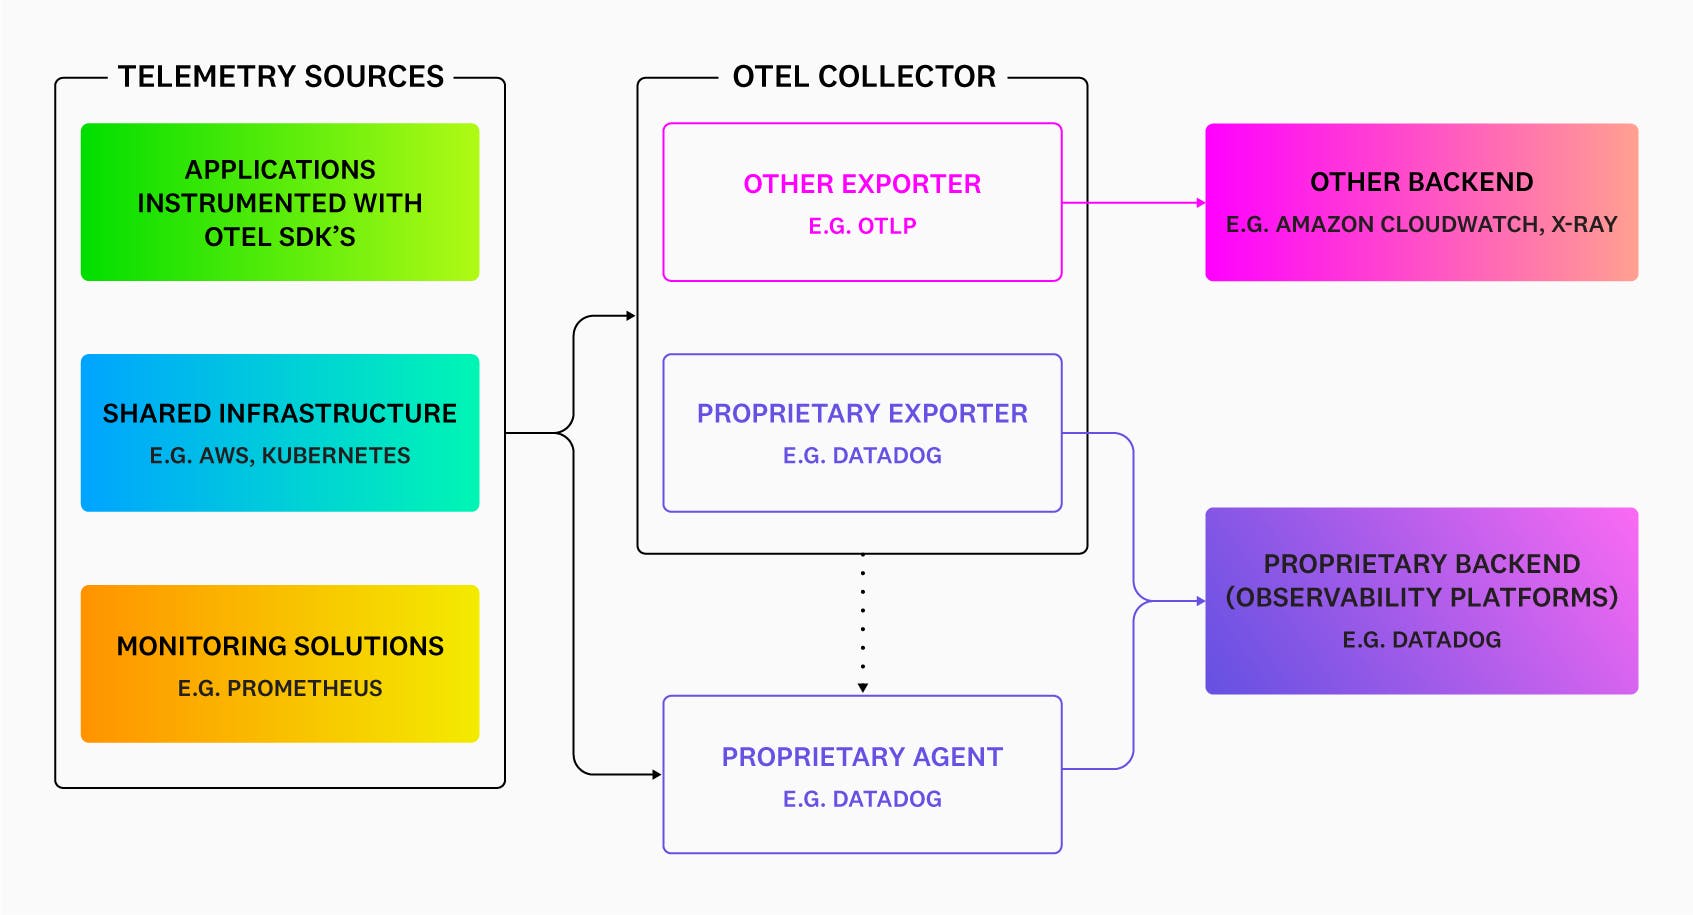
- The OpenTelemetry Collector
The Collector is a standalone, vendor-agnostic service that receives, processes, and exports telemetry data. It acts as a flexible pipeline between instrumented applications and an observability backend. The Collector has three core components:
- Receiver
The receiver defines how data is ingested — either by accepting pushed data from applications on a schedule or by pulling it on demand. A single Collector instance can receive data from multiple sources simultaneously, including OTLP, Prometheus, Jaeger, Zipkin, and many others.
- Processor
Processors perform operations on data in transit: batching, filtering, enriching with metadata, sampling (including tail-based sampling, which makes routing decisions after a full trace is assembled), and transforming attribute names to conform to semantic conventions.
- Exporter
Exporters send processed data to one or more backends. A single pipeline can fan out to multiple destinations, enabling teams to send data to a primary observability platform while also forwarding specific signals to specialized tools.
The Collector can run as an agent sidecar alongside individual services, as a gateway aggregating data from many agents, or both — making it adaptable to a wide range of infrastructure architectures.
- Instrumentation libraries
Beyond the core APIs and SDKs, the OpenTelemetry ecosystem includes a large and growing catalog of instrumentation libraries for popular frameworks — web servers, databases, messaging systems, HTTP clients, cloud SDKs, and more. These libraries auto-instrument supported frameworks without requiring changes to application code, providing immediate baseline visibility with minimal setup.
What are the benefits of OpenTelemetry?
Modern distributed systems present a fundamental observability problem: telemetry data comes from many sources. This data is often written in different languages, running on different infrastructure, owned by different teams, and historically required different proprietary agents and SDKs for each platform. The primary benefit of OpenTelemetry is to correlate this into a single, readable source of data across a complex organization.
A few specific benefits of OpenTelemetry are:
- Vendor neutrality and portability
With OpenTelemetry, instrumentation is decoupled from the backend. Applications are instrumented once using the OTel API and SDK; where data goes is configured separately through the Collector or an exporter, so that switching observability platforms does not require reinstrumentation. This eliminates vendor lock-in at the instrumentation layer and gives teams freedom to evaluate and change tools without incurring re-instrumentation costs.
- Unified instrumentation across the stack
A single instrumentation standard means that traces from a Java service, metrics from a Go service, and logs from a Python service all follow the same conventions and can be correlated in the same backend. Teams no longer need to maintain parallel instrumentation strategies for different parts of their stack, and new services can be onboarded with the same approach regardless of language or framework.
- Reduced instrumentation overhead
Because OpenTelemetry handles auto-instrumentation for a wide range of frameworks out of the box, teams can get meaningful baseline telemetry without writing instrumentation code manually. Custom spans and attributes can be added where needed, but the starting point is substantially lower effort than building from scratch or managing multiple vendor agents.
- Data control
OpenTelemetry gives teams control over what telemetry is collected, processed, and forwarded. The Collector’s processor layer supports filtering, sampling, and attribute manipulation before data reaches the backend, reducing noise, managing cardinality, and containing costs. This level of control is especially valuable in high-volume production environments where sending every event to every destination is neither practical nor economical.
- Open ecosystem and community
OpenTelemetry is backed by virtually every major observability vendor, cloud provider, and a large open source community. This means instrumentation libraries stay current with new frameworks and platforms, the specification continues to evolve, and organizations adopting OTel are aligned with the direction of the industry rather than betting on a single vendor’s roadmap.
Unify OpenTelemetry and Datadog with the Datadog Distribution of the OTel Collector
What are the challenges of OpenTelemetry?
OpenTelemetry is now a mature project, but adopting it in production involves real trade-offs that teams should understand before committing to a full rollout.
Some challenges of OpenTelemetry include:
- Uneven stability across languages and signals
While traces, metrics, and logs have all reached stable specification status, implementation maturity varies across languages. Major languages like Java, Python, Go, JavaScript/TypeScript, .NET, Ruby, and more have stable tracing and metrics implementations. Logs are more uneven: some languages have stable log bridge implementations, while others are still progressing. Before adopting OTel for a specific language or signal, it’s worth consulting the current status page for the components under consideration.
- Instrumentation library coverage gaps
Auto-instrumentation works well for widely used frameworks, but coverage is not universal. Less common frameworks, internal libraries, or niche infrastructure components may require manual instrumentation. Teams with heterogeneous stacks should audit coverage early rather than assuming auto-instrumentation will handle everything.
- Collector complexity at scale
Running the OTel Collector in production requires operational investment. Tail-based sampling, multi-pipeline configurations, and high-throughput processing introduce meaningful complexity. Teams should plan for testing, monitoring, and tuning the Collector as part of their observability infrastructure.
- Cost concerns do not disappear completely
OpenTelemetry is free and open source, but it does not eliminate observability costs. Instead, it shifts them from proprietary instrumentation and vendor lock-in toward infrastructure for running the Collector, storage and ingestion costs at the chosen backend, and engineering time for configuration and maintenance. For organizations moving from an all-in-one proprietary platform to an OTel-native approach, the cost profile may shrink, but it will not vanish.
Monitoring tools and OpenTelemetry
OpenTelemetry handles instrumentation, collection, and transport. It does not handle storage, querying, alerting, or visualization, as those functions require an observability backend.
When selecting a backend for use with OpenTelemetry, the most important criteria are:
- Native OTLP support: whether the backend can ingest data directly via OTLP, without requiring a proprietary agent or translation layer
- Correlated signal analysis: the ability to move between traces, metrics, and logs in context, rather than treating them as separate data silos
- Semantic convention support: whether the platform understands OTel’s attribute naming conventions and surfaces them in queries, dashboards, and alerts out of the box
- Collector compatibility: whether the backend provides a maintained exporter for the OTel Collector, and what configuration options are supported
- Tail-based sampling integration: for high-volume environments, whether the backend supports making sampling decisions based on complete traces rather than individual spans
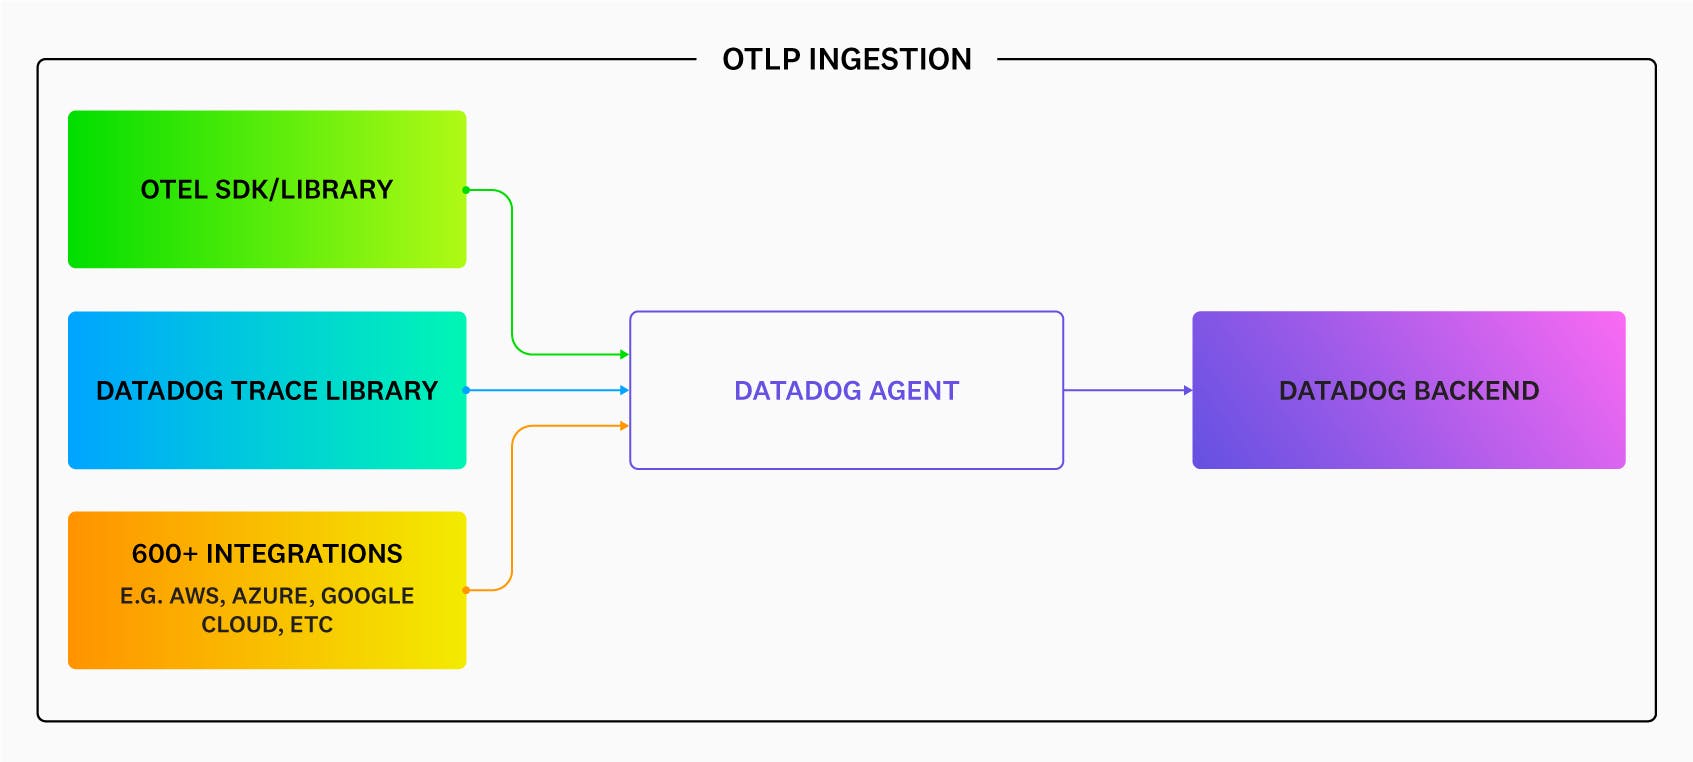
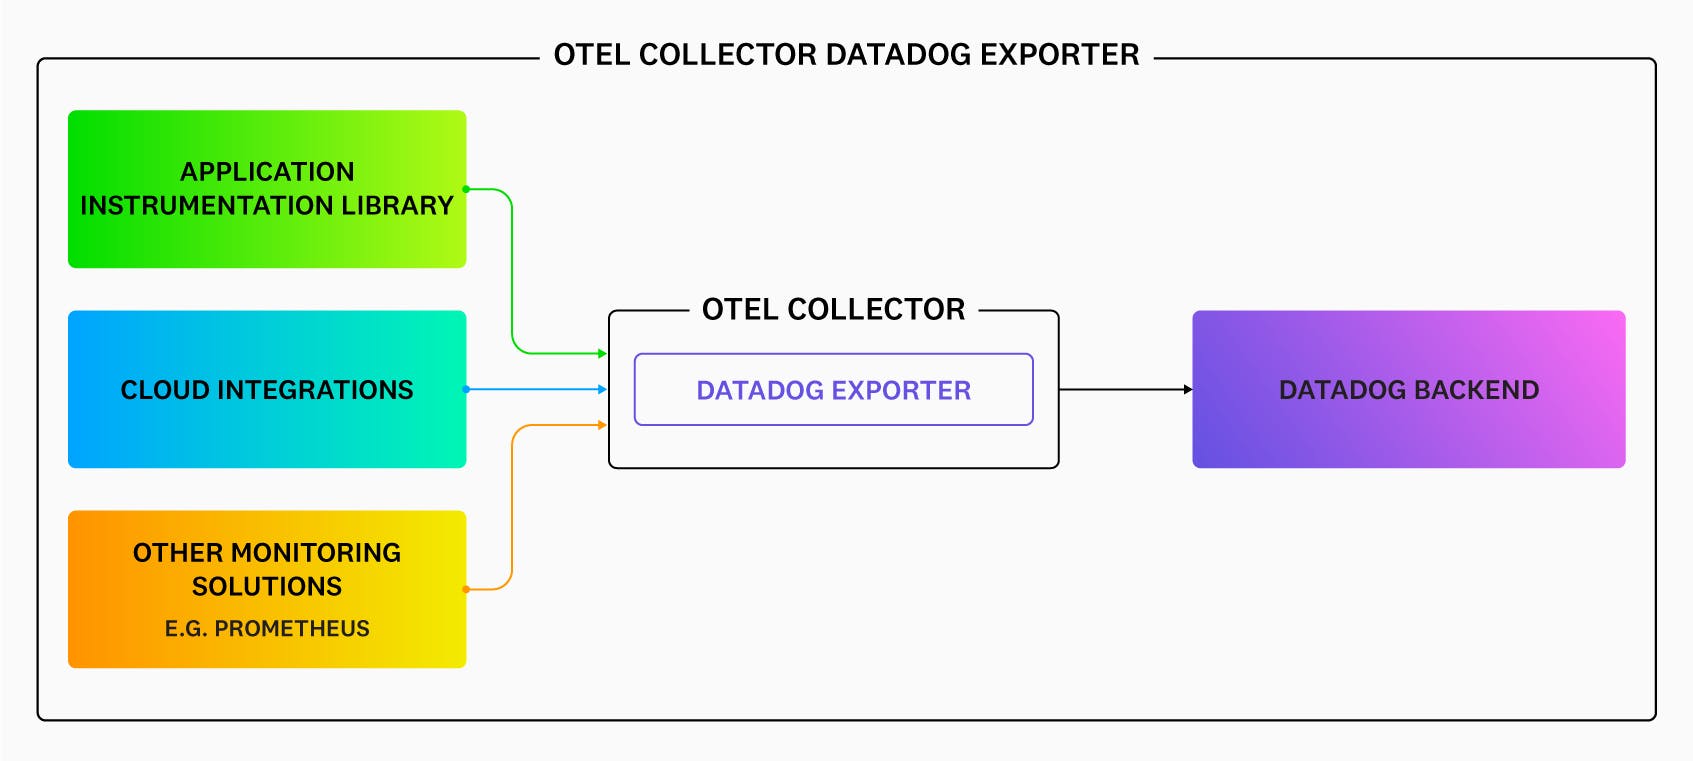
Datadog supports OpenTelemetry data through three primary paths: direct OTLP ingestion via the Datadog Agent, the Datadog Exporter for the OpenTelemetry Collector, and the Datadog Distribution of the OTel Collector (DDOT Collector). The DDOT Collector is an OTel-native Collector distribution built into the Datadog Agent that supports full Collector pipeline flexibility — including fan-out to multiple destinations — alongside Datadog platform features not available through the upstream Collector path. All three approaches allow teams to use OTel SDKs and instrumentation while sending data to Datadog for analysis, alerting, and visualization.
For complete visibility into system health and performance, start using Datadog with OpenTelemetry today.