What is Distributed Tracing?
Distributed tracing is a method of tracking a request as it moves from frontend devices through backend services and databases. It records where the request went, how long it spent in each place, and what failed along the way, so developers can troubleshoot latency and errors in systems where no single service has the full picture.
A trace represents one request’s complete journey. Each unit of work within that journey — an API call, a database query, a function execution — is a span. Spans nest inside one another to form the structure of the trace, and every span carries the same trace ID, which is what makes it possible to reassemble a single request from telemetry emitted by a dozen independent services.
Distributed tracing is one of the core signals of observability, alongside metrics and logs. Where metrics tell you that latency rose and logs tell you what an individual service recorded, a trace tells you where in the request path the time actually went.
How Distributed Tracing Works
Applications may be built as monoliths or microservices. A monolithic application is developed as a single functional unit. In microservice architecture, an application is broken down into modular services, each of which handles a core function of the application and is often managed by a dedicated team.
Microservices are used to build many modern applications because they make it easier to test and deploy quick updates and prevent a single point of failure. But it can be challenging to troubleshoot microservices because they often run on a complex, distributed backend, and requests may involve sequences of multiple service calls. By using end-to-end distributed tracing, developers can visualize the full journey of a request—from frontend to backend—and pinpoint any performance failures or bottlenecks that occurred along the way.
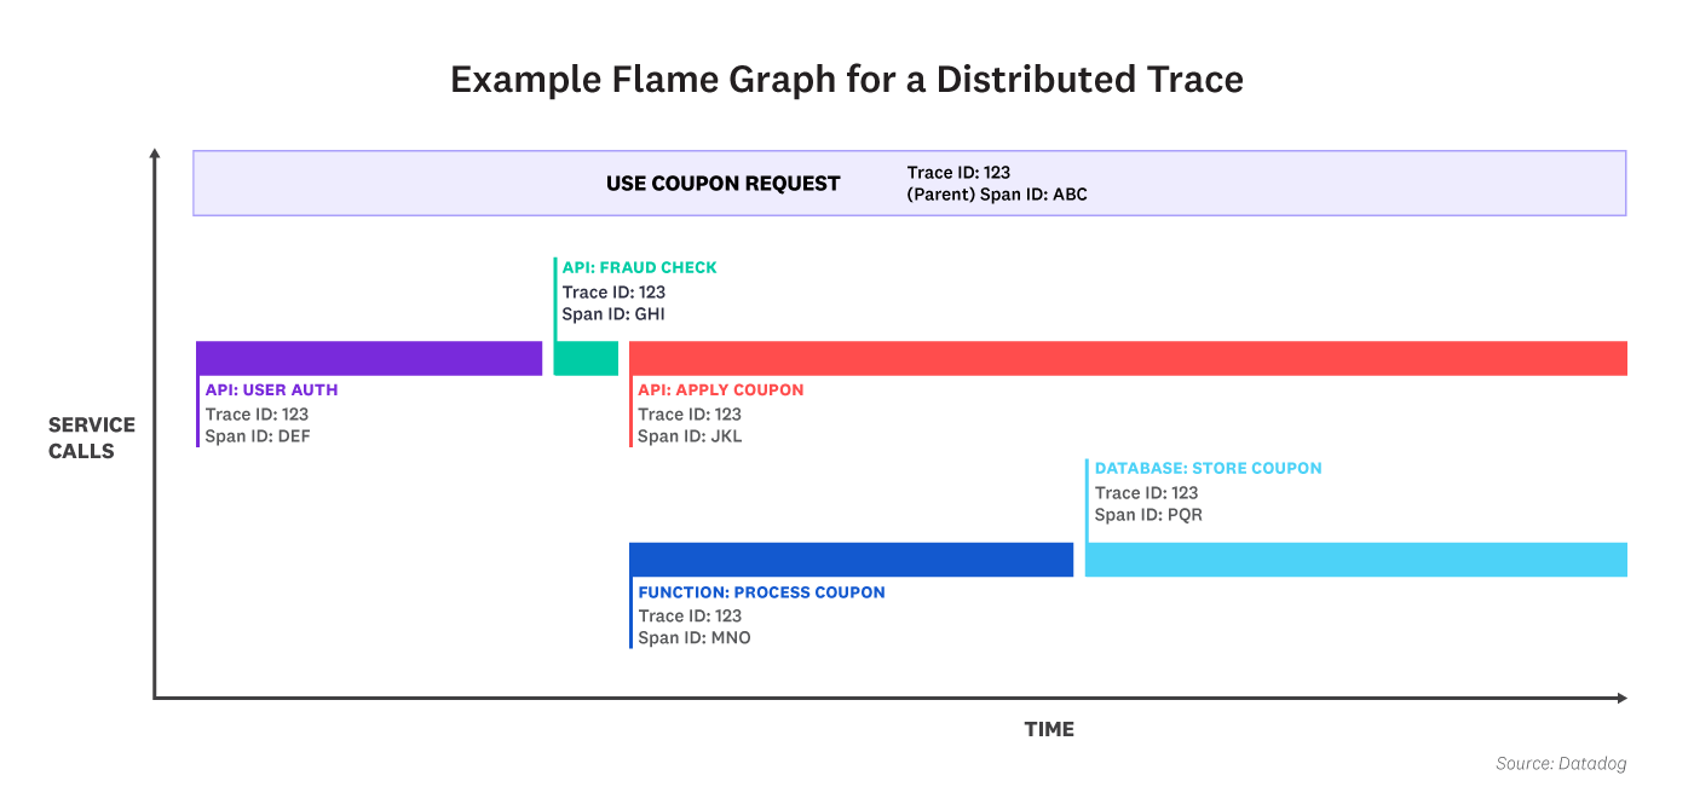
End-to-end distributed tracing platforms begin collecting data the moment that a request is initiated, such as when a user submits a form on a website. This triggers the creation of a unique trace ID and an initial span—called the parent span—in the tracing platform. A trace represents the entire execution path of the request, and each span in the trace represents a single unit of work during that journey, such as an API call or database query. Whenever the request enters a service, a top-level child span is created. If the request made multiple commands or queries within the same service, the top-level child span may act as a parent to additional child spans nested beneath it. The distributed tracing platform encodes each child span with the original trace ID and a unique span ID, duration and error data, and relevant metadata, such as customer ID or location.
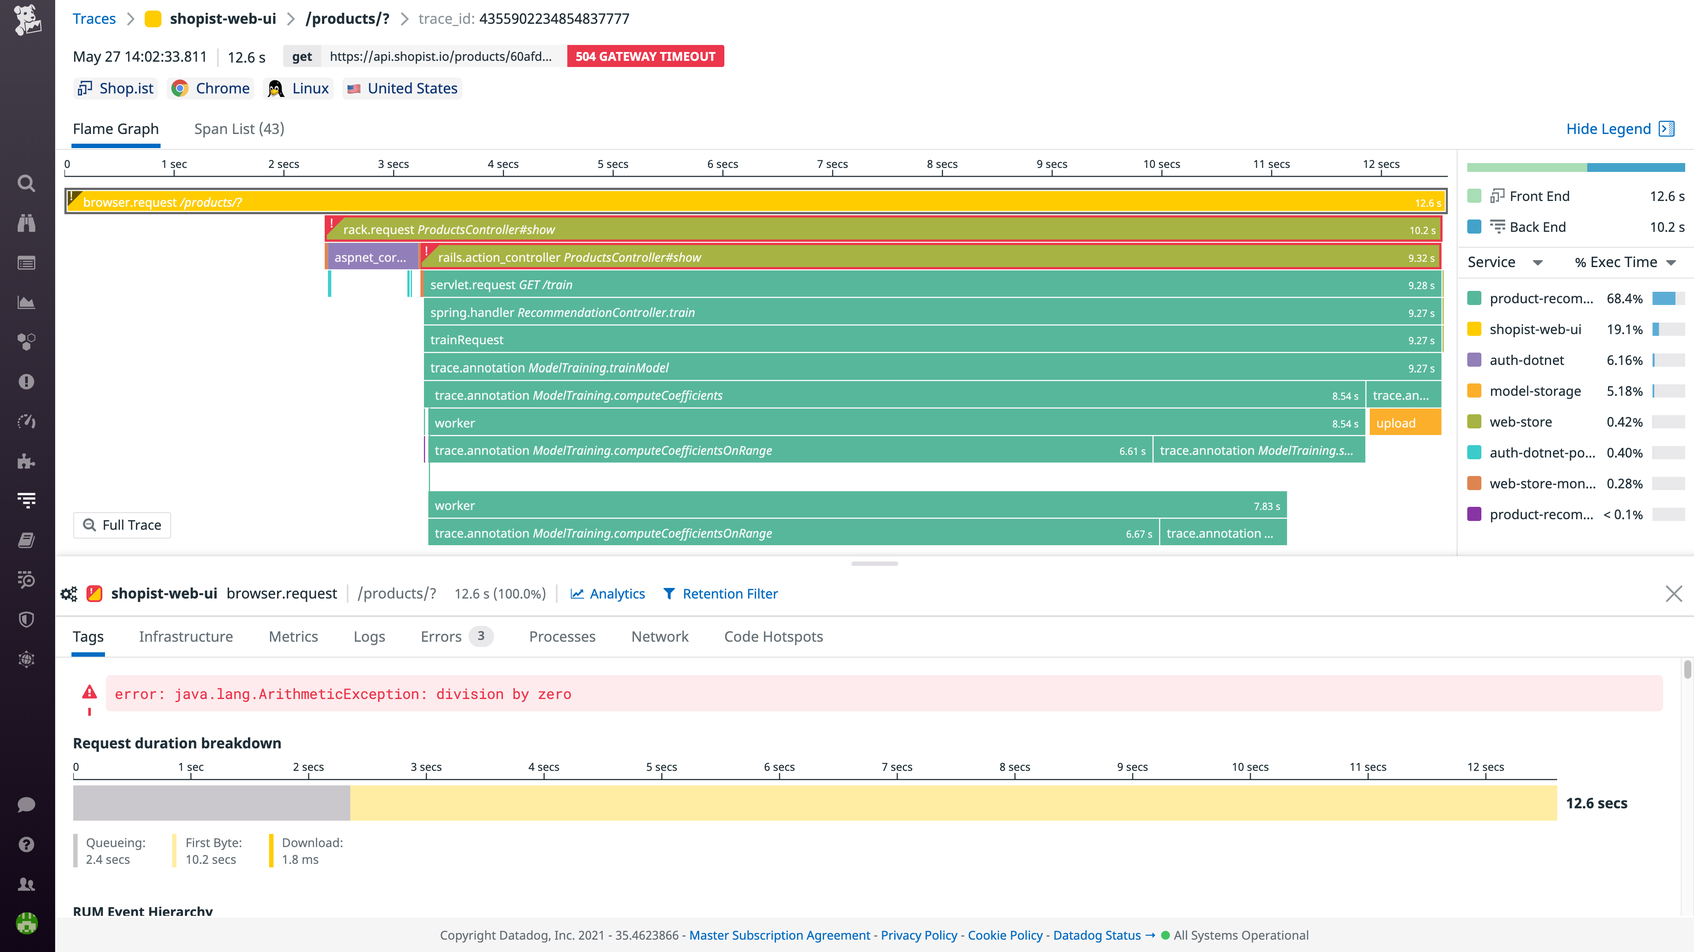
Finally, all of the spans are visualized in a flame graph, with the parent span on top and child spans nested below in order of occurrence. Since each span is timed, engineers can see how long the request spent in each service or database, and prioritize their troubleshooting efforts accordingly. Developers can also use the flame graph to determine which calls exhibited errors.
Traces, spans, and context propagation
Three concepts do most of the work in distributed tracing.
Traces represent a single request end to end. A trace has one ID that every participating service shares.
Spans represent individual units of work inside the trace. Each span records a start time, a duration, a status, and a set of attributes describing what it did. Spans reference their parent, which is what gives a trace its tree structure.
Context propagation is the mechanism that carries the trace ID and parent span ID across service boundaries. When one service calls another, it injects that context into the outgoing request — typically as HTTP headers — and the receiving service extracts it and continues the same trace rather than starting a new one.
Context propagation is where distributed tracing most often breaks in practice. If a service drops the headers, uses an uninstrumented HTTP client, or passes work through a queue without forwarding context, the trace splits into disconnected fragments and the request path goes dark at exactly the boundary you wanted to see across.
The W3C Trace Context specification standardizes this handoff through the traceparent and tracestate headers, so services instrumented with different libraries or different vendors’ agents can still participate in the same trace. Support for it is now broad across tracing tools and frameworks, which has largely resolved what used to be a significant interoperability problem.
Distributed Tracing vs. Logging
Both distributed tracing and logging help developers monitor and troubleshoot performance issues. Logs can originate from the application, infrastructure, or network layer, and each time stamped log summarizes a specific event in your system. For example, a container may emit a log when it runs out of memory. A distributed trace, on the other hand, occurs only at the application layer and provides visibility into a request as it flows across service boundaries. Using a trace, you can visualize the entire request path and determine exactly where a bottleneck or error occurred. To dig even deeper into the root cause of the latency or error, you may need to examine the logs associated with the request.
Distributed tracing for AWS Lambda with Datadog APM
Benefits and Challenges of Distributed Tracing
Microservice architectures are now the default for new distributed applications, and the more services a request touches, the less any single service’s telemetry explains. Frontend engineers, backend engineers, and site reliability engineers use distributed tracing to achieve the following benefits:
- Reduce MTTD and MTTR
If a customer reports that a feature in an application is slow or broken, the support team can review distributed traces to determine if this is a backend issue. Engineers can then analyze the traces generated by the affected service to quickly troubleshoot the problem. If you use an end-to-end distributed tracing tool, you would also be able to investigate frontend performance issues from the same platform.
- Understand service relationships
By viewing distributed traces, developers can understand cause-and-effect relationships between services and optimize their performance. For example, viewing a span generated by a database call may reveal that adding a new database entry causes latency in an upstream service.
- Measure specific user actions
Distributed tracing helps measure the time it takes to complete key user actions, such as purchasing an item. Traces can help identify backend bottlenecks and errors that are harming the user experience.
- Improve collaboration and productivity
In microservice architectures, different teams may own the services that are involved in completing a request. Distributed tracing makes it clear where an error occurred and which team is responsible for fixing it.
- Maintain Service Level Agreements (SLAs)
Most organizations have SLAs, which are contracts with customers or other internal teams to meet performance goals. Distributed tracing tools aggregate performance data from specific services, so teams can readily evaluate if they’re in compliance with SLAs.
Despite these advantages, there are some challenges associated with the implementation of distributed tracing:
- Manual instrumentation
Some distributed tracing platforms require you to manually instrument or modify your code to start tracing requests. Manual instrumentation consumes valuable engineering time and can introduce bugs in your application, but the need for it is often determined by the language or framework that you want to instrument. Standardizing which parts of your code to instrument may also result in missing traces.
- Backend coverage only
Unless you use an end-to-end distributed tracing platform, a trace ID is generated for a request only when it reaches the first backend service. You won’t have visibility into the corresponding user session on the frontend. This makes it harder to determine the root cause of a problematic request and whether a frontend or backend team should fix the issue.
A high-throughput system may generate millions of spans per minute, which makes it hard to identify and monitor the traces that are most relevant to your applications. Fortunately, there are tools to help you surface the most useful performance data.
Trace sampling
A high-throughput system can generate millions of spans per minute. Storing all of them is usually neither affordable nor useful, so tracing tools sample: they keep some traces and discard others. How that decision gets made matters a great deal for what you can investigate later.
Head-based sampling decides at the start of the request, before the outcome is known. It is cheap and simple, and it keeps a representative sample of normal traffic. Its weakness is that the decision is made blind — a request that turns out to be a 12-second error has the same chance of being kept as any other, which means the traces you most want are retained only by luck.
Tail-based sampling waits until the request finishes and decides with the outcome in hand. This makes it possible to keep every error and every slow trace while retaining only a small percentage of successful, fast ones. The cost is complexity: spans have to be buffered until the trace completes, which requires more memory and coordination.
Most teams end up with some form of outcome-aware retention, because the practical goal isn’t a statistically representative sample of traffic. It’s having the specific traces that explain the incident you’re currently investigating.
Distributed Tracing Tools
Modern distributed tracing tools typically support three phases of request tracing:
- Instrumentation
First, you modify your code so requests can be recorded as they pass through your stack. Modern tracing tools usually support instrumentation in multiple languages and frameworks, and may also offer automatic instrumentation, which does not require you to manually change your code.
- Data collection
Once your code has been instrumented, a distributed tracing tool will begin to collect span data for each request.
- Analysis and visualization
Finally, the spans are unified into a single distributed trace and encoded with business-relevant tags for analysis. Depending on the distributed tracing tool you’re using, traces may be visualized as flame graphs or other types of diagrams.
OpenTelemetry is the open standard for generating and collecting telemetry, and it is now the default choice for instrumentation. It graduated from the Cloud Native Computing Foundation in May 2026, placing it in the foundation’s highest maturity tier alongside Kubernetes and Prometheus. Tracing is its most mature signal, stable across essentially every supported language.
OpenTelemetry defines how trace data is produced and moved: APIs and SDKs for instrumenting applications, semantic conventions so attributes are named consistently across languages and teams, and a collector that processes and routes telemetry to a backend. What it does not do is store, index, or visualize that data. Instrumenting with OpenTelemetry still requires a backend to send traces to.
Zipkin and Jaeger are open source tracing backends with their own visualization interfaces. Both are viable for teams that want to self-host, with the usual trade-off: you take on the operational burden of scaling storage and retention, and you correlate traces with other telemetry yourself rather than getting it as a property of the platform.
The practical question when evaluating any tracing setup is less about which tool collects the spans and more about what happens after: whether traces retain enough cardinality to search by customer or endpoint, whether sampling keeps the traces you actually need, and whether a trace can be pivoted to the logs, metrics, and profiles from the same moment without leaving the tool.
Datadog offers complete Application Performance Monitoring (APM) and distributed tracing for organizations operating at any scale. You can use Datadog’s auto-instrumentation libraries to collect performance data or integrate Datadog with open source instrumentation and tracing tools.
Datadog Distributed Tracing allows you easily ingest traces via the Datadog libraries and agent or via OpenTelemetry, search and analyze them in real time, and use UI-based retention filters to keep all of your business-critical traces while controlling costs. Tail-based decisions ensure that you get continuous visibility into traces that show errors or high latency. And with Datadog’s unified platform, you can easily correlate traces with logs, infrastructure metrics, code profiles, and other telemetry data to quickly resolve issues without any context switching.