Datadog APM | Datadog

End-to-End Cloud Visualization and Service Mapping with Datadog

Observe your architecture’s data flows and investigate the root cause of service failures.

Supported Languages

제품 설명

Navigate Applications Seamlessly with the Service Map

Datadog is built to support live root-cause analysis to reduce resolution time and help teams release features more quickly.
  • Automatically map data flows and cluster services based on their interdependencies in real-time
  • Investigate service disruptions by isolating the services that interact with the application of interest
  • One-click navigation from global alerts to relevant traces, logs, and infrastructure metrics

Identify Needle-in-the-Haystack Issues with App Analytics

Slice and dice APM data by tags and request attributes.
  • Quickly find traces that match a particular customer, error code, any custom tag
  • Ensure your 10 most valuable customers have a high-quality experience on your applications
  • Break down latency with end-to-end flame graphs

Scalable, Automated Monitoring with Watchdog

Datadog is scalable, extensible, and easily automated to reduce overhead and ensure the right data is accessible to everyone who needs it.
  • Use machine-learning-based Watchdog to auto-detect and surface anomalies with zero configuration
  • Reduce dozens of dashboards to just one template—instantly re-scope by customer, endpoint, or any other tag
  • Build drag-and-drop performance dashboards or automate dashboarding via API

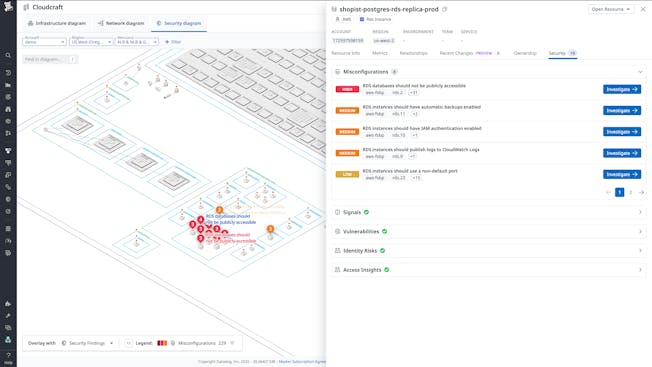
Visualize and Design Your Entire Cloud Infrastructure

  • Inventory and visualize Amazon Web Services and Azure cloud infrastructure automatically
  • Create focused diagrams with preset infrastructure, network, and security views, grouping, and filtering
  • Track changes in your environments and maintain a complete archive of your architecture using version history
  • Draw professional architecture diagrams faster with cost estimation to optimize your cloud spending
products/cloudcraft/03-cloudcraft-security.png

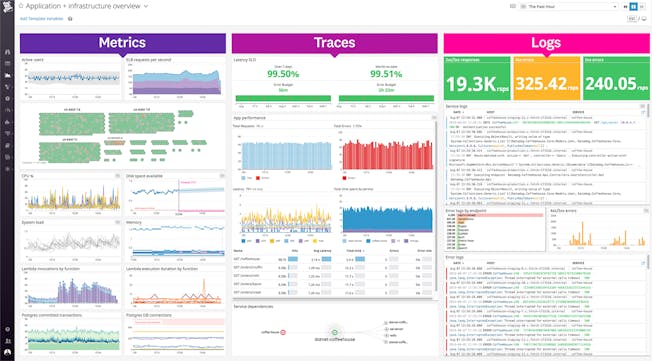
Three Pillars of Observability in One Platform

  • Seamlessly unites metrics, traces, and logs
  • Aggregate metrics and events from 900+ technologies
  • Search, analyze, and explore enriched log data
  • Trace requests across distributed systems and alert on app performance
  • Easily pivot between correlated data for rapid troubleshooting
ProductVideoDashboard_HD.jpg

Loved & Trusted by Thousands

Washington Post logo 21st Century Fox Home Entertainment logo Peloton logo Samsung logo Comcast logo Nginx logo